Abstract
Background
Telangiectasia, dilated blood vessels near the surface of the skin of small, varying diameter, are critical dermoscopy structures used in the detection of basal cell carcinoma (BCC). Distinguishing these vessels from other telangiectasia, that are commonly found in sun-damaged skin, is challenging.
Methods
Image analysis techniques are investigated to find vessels structures found in BCC automatically. The primary screen for vessels uses an optimized local color drop technique. A noise filter is developed to eliminate false-positive structures, primarily bubbles, hair, and blotch and ulcer edges. From the telangiectasia mask containing candidate vessel-like structures, shape, size and normalized count features are computed to facilitate the discrimination of benign skin lesions from BCCs with telangiectasia.
Results
Experimental results yielded a diagnostic accuracy as high as 96.7% using a neural network classifier for a data set of 59 BCCs and 152 benign lesions for skin lesion discrimination based on features computed from the telangiectasia masks.
Conclusion
In current clinical practice, it is possible to find smaller BCCs by dermoscopy than by clinical inspection. Although almost all of these small BCCs have telangiectasia, they can be short and thin. Normalization of lengths and areas helps to detect these smaller BCCs.
Keywords: basal cell carcinoma, image analysis, vessels, telangiectasia, neural network, dermoscopy
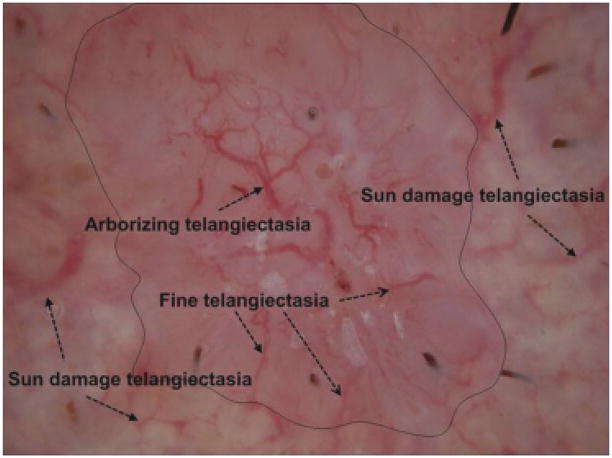
Telangiectasia (telangiectases) are dilated blood vessels of small, varying diameter within the superficial dermis. They are common in fair-skinned persons, especially in sun-exposed areas in older persons. These vessels are also observed with a number of diseases, including rosacea, congenital lesions such as port-wine stains, scleroderma, inherited disorders such as ataxia-telangiectasia and hereditary hemorrhagic telangiectasia, and with prolonged use of oral or topical corticosteroids (1). Basal cell carcinoma (BCC), the most common skin cancer, frequently displays telangiectasia. Although often visible without magnification, these blood vessels can best be visualized with dermoscopy, using either a glass plate with fluid interface (contact non-polarized dermoscopy) or cross-polarized lighting, together with 10-power magnification. In BCC, the classical form of telangiectasia is termed ‘arborizing telangiectasia,’ with a thick central trunk vessel with narrow radiating branch vessels (2, 3). Figure 1 presents an example of a dermoscopy skin lesion image with arborizing telangiectasia and fine telangiectasia. Figure 1 also shows sun-damaged skin that has telangiectasia, found in many non-malignant lesions, often seen in sun-damaged skin. The challenge here is to differentiate the wider, shorter, and often less distinct telangiectasia seen commonly from the longer, finer vessels of BCC in order to discriminate BCC from non-malignant lesions.
Fig. 1.
Telangiectasia, arborizing telangiectasia (trunk and branches) are the classical telangiectasia seen in a contact, non-polarized dermsocopy image of basal cell carcinoma (BCC). Fine telangiectasia are more numerous than arborizing telangiectasia in BCC. Note that sun damage telangiectasia are often rudimentary and tend to be wider, shorter, have less sharp edges, have a greater variation in width, and are less numerous per area than BCC telangiectasia.
There have been numerous imaging-based approaches for vessel segmentation in a variety of medical domains. Approaches investigated for vessel extraction and analysis include: (1) mathematical morphology and grayscale histogram thresholding of edge pixels for semi-automatic extraction of vessels in vascular network images (4), (2) a rule-based expert system for segmentation of coronary vessels in digital angiograms, using edge and region information along with domain specific knowledge for segmenting, grouping and performing shape analysis (5), (3) morphological and modified Otsu threshold techniques for initialization of a level set method for tracking interfaces and shapes in the segmentation process for automatic segmentation of liver blood vessels using (6), (4) image analysis, self-organizing map-based registration and neural network classification techniques for vessel shape analysis to detect glaucomatous change (7), (5) B-spline methods for semi-automated segmentation and modeling of lumen and vessel surfaces in three-dimensional intravascular ultrasound (8), (6) shape decomposition for segmenting blood vessels in ultrasound color Doppler images based on shape decomposition (9), (7) ridge- and feature-based vessel segmentation in two-dimensional color images of the retina (10), (8) texture-based segmentation of blood vessels in retinal images using unsupervised clustering techniques, which addresses local contrast variations for detecting minor vessels (11) among others.
In this research, we explore a vessel detection algorithm for extracting and characterizing telangiectasias in dermoscopy skin lesion images for discriminating BCC from benign skin lesions. The proposed technique incorporates a color drop-based method for finding vessel-type objects with morphological and other image analysis methods to eliminate vessel-type mimics.
The remaining sections of this paper include the following: overview, description of data sets used, pre-processing, first pass vessel detection by local drops, image noise filtering technique, post-processing, vessel features used for skin lesion discrimination, and neural network methods for BCC diagnosis, experiments performed, results, discussion, and conclusions.
Methods
Telangiectasia detection overview
An overview of methods used is shown in Fig. 2. Following pre-processing of images, color drops are used for vessel localization and characterization. Noise filtering, segment connection, and size filtering are used to produce vessel masks. Various features sets are used as input to the neural network to generate receiver operating characteristic (ROC) curves.
Fig. 2.
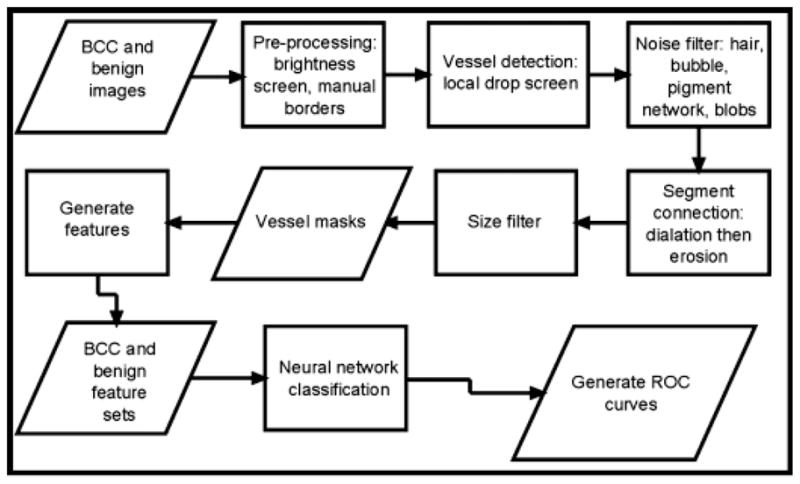
Overview – basal cell carcinoma (BCC) diagnosis by telangiectasia detection.
Data sets used
The data set consisted of 59 BCC dermoscopy images with visible telangiectasia obtained from two clinics: Skin and Cancer Associates (Plantation, FL, USA) and the Dermatology Center, Rolla, MO, USA. One-hundred and sixteen benign dermoscopy images were selected from benign lesions in the same study for image processing algorithm development, including: 31 dysplastic nevi (23 with mild atypia and eight with moderate atypia), 21 seborrheic keratoses, 13 congenital nevi, eight nevocellular nevi, eight intradermal nevi, seven lentigines, six compound nevi, three junctional nevi, two acral nevi, two actinic keratoses, two hemangiomas, two lichen-planus like keratoses, two warts, and nine single examples of various benign diagnoses were identified in the same dermoscopy study and used as the competitive test set. A test set used for lesion discrimination from the BCCs with 152 benign dermoscopy images used from the same study: 34 seborrheic keratoses, 32 dysplastic nevi (28 with mild atypia and four with moderate atypia), 19 congenital nevi, 13 lentigines, 11 nevocellular nevi, eight actinic keratoses, five compound nevi, four blue nevi, four lichen-planus like keratoses, three intradermal nevi, two Grover’s disease, two histiocytomas, two lichen simplex chronicus, two junctional nevi, and 11 single examples of various benign diagnoses (NIH SBIR R44 CA-101639-02A2). All images were taken with the HR II DermLite (3Gen, Dana Point, CA, USA) using ultrasonic gel for the fluid interface. Lesions were included in the study if by clinical or dermoscopy evaluation they were malignant, potentially malignant, changing, or of interest to physician and/or patient. Lesions that were biopsied for cosmetic reasons were not included in the study. The data set was of moderate diagnostic difficulty and was felt to represent BCCs and benign lesions encountered in the clinic. The Phelps County Regional Medical Center Institutional Review Board, Rolla, MI, approved this research and each subject or subject’s parent or guardian signed a consent form for this research. All BCCs in the study had histopathology examined by a dermatologist or a dermatopathologist.
Pre-processing
The images obtained are not all of equal contrast. The dark vessels cannot be found in low-contrast images. All images failing a minimum contrast threshold, measured by standard deviation, underwent a uniform contrast enhancement and brightness decrease. Borders are then found manually (D. C.) and corrected by a dermatologist (W. V. S.), by selecting border points, creating a closed curve with a send-order spline, and a subsequent binary lesion border mask (12).
Color-drop vessel detection
To a human, a vessel looks red compared with the surrounding skin. Using machine vision, it is seen that pixels inside the vessel have green and blue color drops from the surrounding pixels while the red pixels are at most, only slightly brighter.
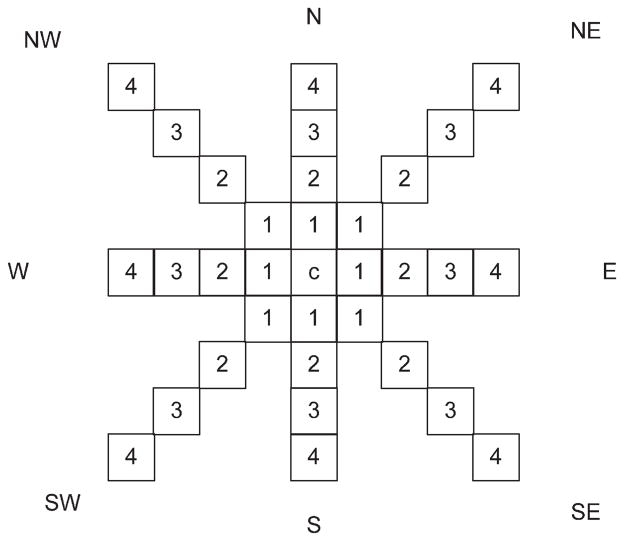
The algorithm is based upon the premise that the vessels are narrow. Iterating through every pixel inside the lesion, labeling a new designated center pixel as c (Fig. 3), it then moves outward a set number of pixels (NumPix) from a given center in eight directions, and demands a minimum drop, different for each color – red, green, and blue, respectively optimized at −2, 4, and 12. A candidate pixel is marked if for any satisfied direction pair, the drop requirements are satisfied in at least two directions. As determined experimentally, 135° is large enough to compare the surrounding pixel with the center pixel; 45° and 90° yield very much noise, while 180° may miss some actual vessel pixels. The goal at this stage is to find all possible vessel pixels.
Fig. 3.
Direction mask used for pixel marking.
Figure 4 presents an example of the output images based on different red color drops with 2 in (b) and −2 in (c). With decreasing the red drop from 2 to −2, some vessels missed in (b) can be detected.
Fig. 4.

Mask image with different red drops. (a) Original image. (b) Mask image with red drop of 2. (c) Mask image with red drop of −2.
Vessels have different widths. Wider vessels are missed, i.e. no drop is detected, unless the outward pixel search parameter (NumPix) is large enough to include both vessel and surround. Figure 5 shows NumPix = 4 is not sufficiently high to detect the widest vessels that NumPix = 7 can detect.
Fig. 5.

Mask images with different NumPix values. (a) Original Image, (b) NumPix = 4, (c) NumPix = 7.
Noise elimination
After implementing the above algorithm, noise sources such as brown network, blobs, hair, bubbles and brown network were marked. A noise filtering technique is used to mitigate these noise sources. Figure 6(a) shows brown areas that are labeled as vessels using the vessel detection technique. The following sections present noise-filtering approaches used to address the different types of noise sources. All of these techniques are applied on a pixel-by-pixel basis to pixels included in the vessel mask from the vessel detection algorithm.
Fig. 6.

Brown area filtering. (a) Brown areas labeled as vessels. (b) Brown areas after removal from vessel mask by G>B+5 Filter. (c) Brown areas after removal from vessel mask by G>B+20 filter. Filter shown in (b) is optimal.
Brown network filtering
Figure 6(a) shows the mask result after applying above vessel detection algorithm, with most noise due to brown areas. Let RGB represent the red, green and blue values, respectively, at a pixel location within the lesion or pixels within brown network structures, G>B, because brown is a degraded orange, which has G>B. The opposite is true for vessels. We find that this condition, G>B+5, could be used to filter the brown area as shown in Fig. 6(b). Figure 6(c) shows the mask result using the filter condition G>B+20 for comparison purposes. Based on empirical analysis of the data set, as can be observed comparing Figs 6(b) and (c), the filter condition G>B+5 provided optimal removal of brown areas compared with other G and B combinations.
Hair filtering
Hairs are noise found by the vessel algorithm, as shown in Fig. 7(a). Hair is best distinguished from vessels by means of the variance of Red/Green (R/G), which is higher at hair boundaries than at blood vessel boundaries. This is due to the very high relative drop in red moving from surround to inside the hair, compared with an essentially zero drop in red moving from surround to inside the vessel, as noted above in the color drop discussion in ‘Color-drop vessel detection’. Note that other features of hair lower luminance, sharp double boundaries, and long and narrow shape, are all present in blood vessels. The optimal hair filter, compared with other filters investigated, shown in Fig. 7(b) used a 5 × 5 sliding window to eliminate all pixels whose centered 5 × 5 surrounding areas had variance of the R/G>0.01, the highest ratio, which eliminates almost all hairs and preserves vessels. Figure 7(c) shows the unmarked hair part if setting the R/G ratio >0.02.
Fig. 7.

Hair filtering. (a) Hair labeled as vessels. (b) Hair areas after removal by R/G>0.01 Filter. (c) Hair areas after removal R/G>0.02 filter. Filter shown in (b) is optimal.
Bubble filtering
A bubble displays a sharp local change in intensity combined with a higher than average intensity over a wider area. These findings are most prominent in the blue plane, which best reflects lighting changes. The bubble filter uses a Modified Range Filter (MRF), to screen center pixels (c) pixels in the blue plane (scaled from 0 to 1) as follows:
where LocalDrop(c) = difference in original value of c and local average (49 × 49 neighborhood based on empirical analysis applied to bubble filtering in the experimental dataset) and Local-Range(c, 3) = difference in local maximum and local minimum (3 × 3 neighborhood).
A pixel c is marked as a bubble pixel if 10 or more pixels p in the 15 × 15 neighborhood centered on c satisfies MRF(p) >0.5.
Figure 8 presents a skin lesion image example showing the original image with bubbles in (a), bubble regions labeled as vessels using the vessel detection algorithm in (b) and the reduction of bubble regions labeled as vessels in (c).
Fig. 8.

Bubble filtering. (a) Original image, (b) Bubble labeled as vessels, (c) Unmarked bubble using the bubble detection algorithm presented above.
Blob filtering for mask density
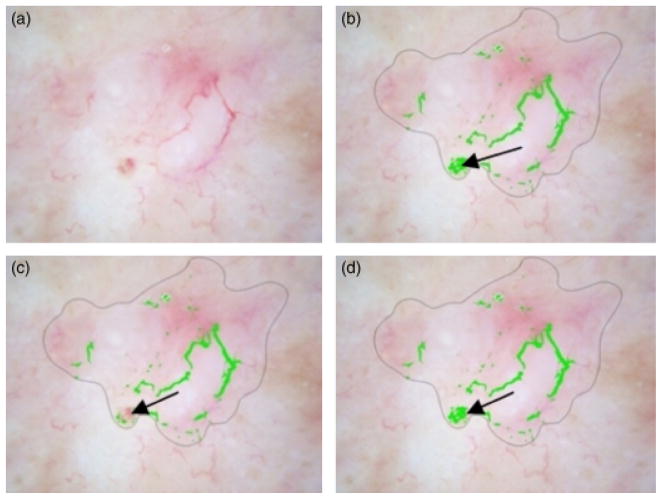
Some blobs such as the ulcer in Fig. 9 satisfy color drops and remain in the vessel mask. A 41 × 41 square mask centered on all mask pixels is used for a density screen. A density screen of 70% or more of the pixels inside this square is used, and all centered pixels with high density are correctly unmarked (arrow in Fig. 10(c)). Figure 10(d) shows the comparison image with setting the density 80%.
Fig. 9.
Blob density filtering. (a)Original image. (b)Big blob labeled as vessel. (c)Unmarked big blob. (d) Big blob unmarked with 80% density.
Fig. 10.
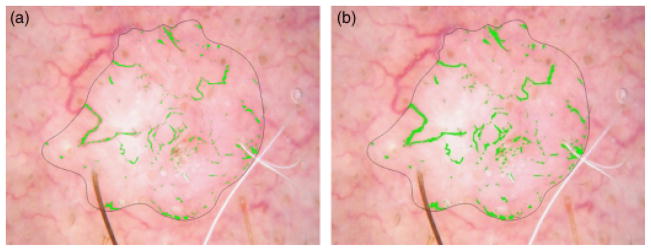
(a) Mask after noise filtering. (b) Mask after dilation, radius 3, and erosion, radius 2.
Post-processing: connecting vessel segments
Image dilation and erosion are used to connect vessel segments. After noise filtering, vessel segments become disconnected. The disconnected segments are joined by first dilating and then eroding with a circular structuring element. Connecting segments is accomplished using a dilating element of greater radius than the eroding element. The optimum radii are found to be 3 for dilation and 2 for erosion, as shown in Fig. 10.
Post-processing: length and area lower bounds
The vessel mask after performing all of the previous noise removal steps was still noisy. The vessel mask image is skeletonized using Matlab® function bwmorph (BW, ‘skel’) to remove short objects that are not long enough to be considered linear vessels (<30 pixels long) or very small (<40 pixels area). The result of the area lower bound is shown in Fig. 11.
Fig. 11.
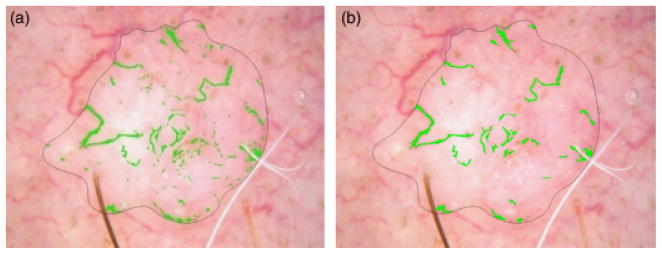
Lower area bound (a) Mask with noise. (b) Mask after area lower bound.
Post-processing: independent and principal component analysis, histogram pursuit
The final vessel masks on some images do not detect all the vessels and do not detect all segments of detected vessels. Fainter vessels and fainter vessels segments are least likely to be detected. Because the vessel masks at this stage were reliable, an attempt was made to expand the amount of vessel area found without finding many false vessels. Three techniques were tried. Although independent component analysis (13) proved better than principal component analysis (14), almost no new vessel areas were found with either method. Similar results were found with independent histogram pursuit (15).
Vessel feature generation
Vessel masks are computed on the skin lesion image dataset using the algorithm presented in sections ‘Telangiectasia detection overview’–‘Post-processing: independent and principal component analysis, histogram pursuit’ above. The final vessel masks on some benign images may have telangiectatic vessels. Table 1 presents the vessel-based features investigated in the different groups, outlined below, for discriminating BCC from benign skin lesions images. The first 10 features are general vessel descriptors (1–10). For this feature group, the first six features were selected to best represent the narrower, longer, and more numerous vessels in BCC. The seventh feature, standard deviation of object (vessel) width, represents the more uniform width of BCC vessels. The next three eccentricity features represent the straighter vessels in BCC (Fig. 1). The second feature set, denoted as object number descriptors, includes 10 features determined by morphologically eroding the final vessel mask with a circular structuring element of radius from 1 to 10 and record the remaining object number after each erosion. The third feature set, denoted as object area descriptors, includes 10 features computed by morphologically eroding the vessel mask with a circular structuring element of radius from 1 to 10 and finding the remaining total mask area after each erosion and dividing the remaining mask area by the lesion area. The object number and object area descriptors represent different approaches to quantify variations in vessel width. Although the classic dermoscopy feature for BCC is arborizing telangiectasia, with varying vessel widths, observation of numerous vessels in BCC and benign images shows a greater variation in benign vessel widths, as seen in Fig. 1. Upon computing the features for the entire dataset, multivariate analysis was performed using the SAS procedure logistic stepwise logistic procedure to determine for feature analysis and selection. The measures included in the final model are shown in Table 2 in the order selected using the feature labels from Table 1. The most significant measures in the final model measured the thinness and straightness of the vessels. The SAS stepwise selection by logistic procedure resulted in the following variables in the final model. Chi-square significance in the model, which tests against the null hypothesis that the predictors’ regression coefficient is not equal to zero in the model, is shown in the rightmost column of Table 2 (16).
TABLE 1.
Vessel-based features investigated with descriptions
| Feature type | Measure (all normalized except those marked*) | Description (measures marked # taken after skeletonizing) | Meaning |
|---|---|---|---|
| General descriptor 1 | Object number | Total number of vessels/lesion area | Basal cell carcinoma (BCC) have more vessels |
| 2 | Maximum object length | Maximum length for all vessels/square root lesion area# | BCC vessels are longer |
| 3 | Average object length | Average length for all vessels/square root lesion area# | BCC vessels are longer |
| 4 | Maximum object area | Maximum area for all vessels/lesion area | BCC vessels are larger |
| 5 | Average object area | Average area for all vessels/lesion area | BCC vessels are larger |
| 6 | Average object width | Average width for all vessels/square root lesion area | BCC vessels are narrower |
| 7 | Standard deviation object width* | Standard deviation for all vessel widths | BCC vessel widths are more uniform |
| 8 | Maximum eccentricity* | Maximum ratio of distance between the foci of the ellipse enclosing the vessels and its major axis length | BCC vessels are straighter |
| 9 | Average eccentricity* | Average ratio of the distance between the foci of the ellipse enclosing the vessels and its major axis length | BCC vessels are straighter |
| 10 | Minimum eccentricity* | Minimum ratio of the distance between the foci of the ellipse enclosing the vessels and its major axis length | BCC vessels are straighter |
| Object number descriptors (11–20) | Object number after 1–10 erosions* (10 features) | Erode the final vessel mask with circular structuring element of radius from 1 to 10 and record the remaining object number after each erosion | BCC object fewer after given number erosions |
| Object area descriptors (21–30) | Object area after 1–10 erosions (10 features) | Erode the vessel mask with circular structuring element of radius from 1 to 10 and record the remaining mask area for each erosion and divide by square root of the lesion area | BCC object areas smaller after given number erosions |
TABLE 2.
Feature measures generated from final vessel mask, included in final model, SAS procedure logistic
| Order of feature selection | Feature number | Chi-Square significance |
|---|---|---|
| 1 | 30 | <.0001 |
| 2 | 9 | <.0001 |
| 3 | 2 | 0.0210 |
| 4 | 8 | 0.1836 |
| 5 | 6 | 0.0602 |
| 6 | 7 | 0.0101 |
| 7 | 11 | 0.0816 |
| 8 | 12 | 0.0444 |
| 9 | 16 | 0.1274 |
| 10 | 29 | 0.1156 |
| 11 | 21 | 0.0576 |
| 12 | 22 | 0.0030 |
| 13 | 17 | 0.2492 |
Neural network methods for BCC discrimination
In order to evaluate the effectiveness of the vessel detection process, lesion discrimination is performed using the two classes of BCC and benign lesions. Standard backpropagation neural network architectures were explored for lesion discrimination. All neural network architectures were implemented in Matlab®, using sigmoid transfer functions in the input and hidden layers and a linear transfer function in the output layer.
Experiments Performed
For BCC discrimination from benign lesions over the experimental data set, four different combinations of features computed from the telangectasia masks were investigated for inputs to the different neural network architectures. First, all 30 features listed in Table 1 were examined, including the general, object number descriptors and object area descriptors. An architecture of 31 × 5 × 1 was used for the standard backpropagation neural network implementation, with 30 features and a bias in the input layer, five nodes in the hidden layer and one output. Second, 20 the general and object number descriptors from Table 1 were examined, providing 20 input features. An architecture of 21 × 5 × 1 was utilized for the neural network implementation. Third, the general and object area descriptors were explored, providing 20 features. An architecture of 21 × 5 × 1 were used for the neural network implementation. Fourth, descriptors selected from logistic procedure given in Table 2, providing 13 features. An architecture of 14 × 5 × 1 was utilized for the neural network implementation.
Because of the limited number of BCC cases, a leave-one-out training/test methodology is used for all neural network architectures. The neural networks are trained up to 15 epochs or until root-mean-square error was <0.001, using online (stochastic/delta) learning, with the weights adjusted after each pattern presentation. In this case, the next input pattern is selected randomly from the training set, to prevent any bias that may occur due to the sequences in which patterns occur in the training set. With the target value for the telangiectases data set set to 1 and the benign data set set to 0, network outputs after testing are between −1 and 1. ROC curves are generated for classification results based on the neural network outputs obtained for the leave-one-out cases. The ROC curve is a plot of the sensitivity for a binary classifier system as its discrimination threshold is varied. The ROC curve represents equivalently the fraction of true positives vs. the false negative rate.
Results
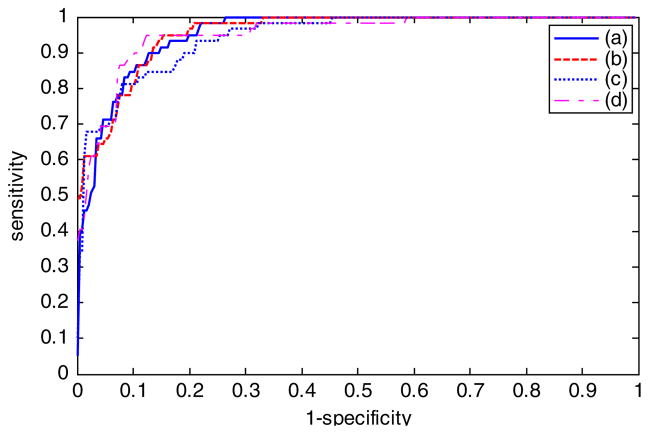
Figure 12 shows the plot of ROC curves and areas under the ROC curves, denoted as AUC, for the neural network results based on the four different feature combinations using online neural network training, leave-one-out training and testing. For the different ROC curves presented, the vertical axis shows the true-positive rate, and the horizontal axis gives the false-negative rate.
Fig. 12.
Receiver operating characteristic curve and area under curve (AUC) results for different feature combinations. (a) All 30 features from Table 1 with AUC = 0.9548. (b) General descriptors and object area descriptors with AUC = 0.9670. (c) General descriptors and the object number descriptors with AUC = 0.9482. (d) Reduced feature set selected using SAS Procedure logistic with AUC = 0.9547.
Discussion
Diagnostic accuracy
Based on AUC analysis from Fig. 12, all feature combinations achieved at least 94.8% diagnostic accuracy. The diagnostic results based on all 30 features are 95.5%. Using the general descriptors and object area descriptors adds approximately 1% to this diagnostic accuracy (96.7%), and using the general descriptors and object number descriptors subtracts approximately 1% from the diagnostic accuracy (94.8%). The reduced feature set based on SAS analysis yields AUC results (95.5%) similar to all 30 features but slightly <20 features consisting of the general descriptors and the object area descriptors.
Examples of errors
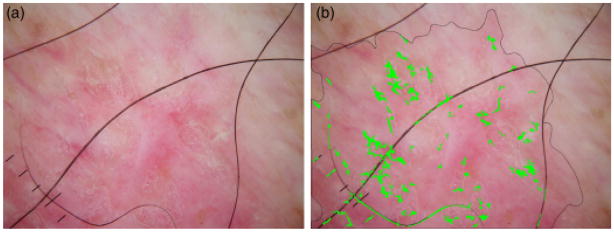
Figure 13(a) shows one of the BCC images, which is detected as a benign lesion falsely. The detected vessels are not long enough to be considered BCC telangiectasia. Figure 13(b) shows one of the benign lesion images, which is discriminated as BCC falsely. The noise around the bubbles and the noise around the hair could not be removed after applying the noise filters. Those areas are long and big enough to be considered as telangiectasia.
Fig. 13.
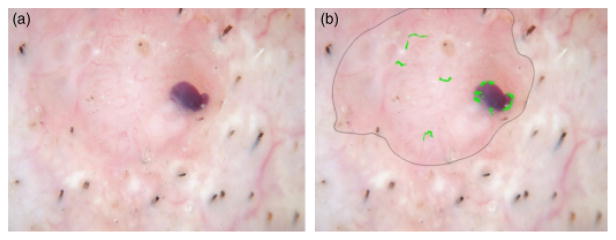
Basal cell carcinoma misdiagnosed. (a) Original image, (b) Telangiectasia mask.
Relation to clinical practice
Although textbooks describe telangiectasia visualized in BCC as arborizing, we found that arborizing telangiectasia are actually present in only a small number of BCCs. Our attempt to capture this feature by eroding the telangiectasia by variably sized structural elements and measuring areas left actually resulted in somewhat decreased classifier accuracy (Fig. 12). In current clinical practice, it is possible to find smaller BCCs by dermoscopy than by clinical inspection. These smaller BCCs in our experience (W. V. S. and D. C.) lack arborizing telangiectasia. Although almost all of these small BCCs have telangiectasia, they can be short and thin. Normalization of lengths and areas helps to detect these smaller BCCs.
Structure detection vs. diagnosis
We have chosen BCC detection rather than vessel detection as the endpoint. Although vessel detection is inherently easier, BCC detection has potential direct clinical application. Small BCC are detectable early by dermoscopy, and potentially detectable by the automated methods described here.
Limitations of study and scope of future research
Errors such as those shown in Figs 13 and 14 are due to: (1) the inability of image processing to always eliminate noise, in this bubbles and hair, which have sharp drops, which mimic telangiectasia, (2) incomplete manifestation of telangiectasia in early lesions, and (3) the presence of telangiectasia in many benign lesions. It is likely that the diagnostic accuracy can be improved by increased ability to find dim bubbles, such as those in Fig. 14.
Fig. 14.
Benign lesion misdiagnosed. (a) Original image, (b) Telangiectasia mask.
References
- 1.Stolz W, Braun-Falco O, Bilek P, Landthaler M, Burgdorf WHC, Cognetta A. Color atlas of dermatoscopy. 2. Berlin: Blackwell Science; 2002. p. 33. [Google Scholar]
- 2.Johr RH, Soyer P, Argenziano G, Hofman-Wellenhof R, Scalvenzi M. Dermoscopy the essentials. Edinburgh: Elsevier; 2004. p. 107. [Google Scholar]
- 3.Bolognia JL, Jorizzo JL, Rapini RP, editors. Dermatology. New York: Mosby; 2003. pp. 1653–1654.pp. 2406 [Google Scholar]
- 4.Thackray BD, Nelson AC. Semi-automatic segmentation of vascular network images using a rotating structuring element (ROSE) with mathematical morphology and dual feature thresholding. IEEE Trans Med Imaging. 1993;12:385–392. doi: 10.1109/42.241865. [DOI] [PubMed] [Google Scholar]
- 5.Stansfield SA. ANGY: a rule-based expert system for automatic segmentation of coronary vessels from digital subtracted angiograms. IEEE Trans Pattern Anal Mach Intell. 1986;8:188–199. doi: 10.1109/tpami.1986.4767772. [DOI] [PubMed] [Google Scholar]
- 6.Fei Y, Park JW. Automatic segmentation of liver blood vessels using level set method. Proceedings of international conference on audio, language and image processing; Shanghai, China. 2008. pp. 1718–172. [Google Scholar]
- 7.Matsopoulos GK, Asvestas PA, Delibasis KK, Mouravliansky NA, Zeyen TG. Detection of glaucomatous change based on vessel shape analysis. Comput Med Imaging Graph. 2008;32:183–192. doi: 10.1016/j.compmedimag.2007.11.003. [DOI] [PubMed] [Google Scholar]
- 8.Klingensmith JD, Vince DG. B-spline methods for interactive segmentation and modeling of lumen and bessel surfaces in three-dimensional intravascular ultrasound. Comput Med Imaging Graph. 2002;26:429–438. doi: 10.1016/s0895-6111(02)00025-3. [DOI] [PubMed] [Google Scholar]
- 9.Saad AA, Shapiro LG. Shape decomposition approach for ultrasound color Doppler image segmentation. Proceedings of the 18th international conference on pattern recognition; Hong Kong. 2006. pp. 691–694. [Google Scholar]
- 10.Staal J, Abramoff MD, Niemeijer M, Viergever MA, van Ginneken B. Ridge-based vessel segmentation in color images of the retina. IEEE Trans Med Imaging. 2004;23:501–509. doi: 10.1109/TMI.2004.825627. [DOI] [PubMed] [Google Scholar]
- 11.Bhuiyan A, Nath B, Chua J, Kotagiri R. Blood vessel segmentation from color retinal images using unsupervised texture classification. Proceedings of the IEEE international conference on image processing; San Antanio, TX. 200. pp. 521–52. [Google Scholar]
- 12.Celebi ME, Kingravi HA, Iyatomi H, Aslandogan YA, Stoecker WV, Moss RH, et al. Border detection in dermoscopy images using statistical region merging. Skin Res Technol. 2008;14:347–353. doi: 10.1111/j.1600-0846.2008.00301.x. [DOI] [PMC free article] [PubMed] [Google Scholar]
- 13.Stone JV. In: A brief introduction to independent component analysis in encyclopedia of statistics in behavioral science. Everitt BS, Howell DC, editors. Chichester: John Wiley & Sons; 2005. pp. 907–912. [Google Scholar]
- 14.Jolliffe IT. Principal component analysis, series: Springer series in statistics. 2. New York: Springer; 2002. [Google Scholar]
- 15.Gómez DD, Butakoff C, Ersbøll BK, Stoecker W. Independent histogram pursuit for segmentation of skin lesions. IEEE Trans Biomed Eng. 2008;55:157–161. doi: 10.1109/TBME.2007.910651. [DOI] [PMC free article] [PubMed] [Google Scholar]
- 16.Schervish MJ. P values: what they are and what they are not. The Am Stat. 1996;50:203–206. [Google Scholar]


