Abstract
Membranes with a high content of polyunsaturated phosphatidylethanolamines (PE) facilitate formation of metarhodopsin-II (MII), the photointermediate of bovine rhodopsin that activates the G protein transducin. We determined whether MII-formation is quantitatively linked to the elastic properties of PEs. Curvature elasticity of monolayers of the polyunsaturated lipids 18:0–22:6n-3PE, 18:0-22:5n-6PE and the model lipid 18:1n-9-18:1n-9PE were investigated in the inverse hexagonal phase. All three lipids form lipid monolayers with rather low spontaneous radii of curvature of 26–28 Å. In membranes, all three PEs generate high negative curvature elastic stress that shifts the equilibrium of MI/MII photointermediates of rhodopsin towards MII formation.
Introduction
Phosphoethanolamines (PE) comprise about 40% of retinal and synaptosomal membranes and, within these membranes, about 50% of hydrocarbon chains in PE are the six-fold unsaturated docosahexaenoic acid (22:6n-3, DHA)1, 2. It was reported earlier that increased levels of PE significantly boost formation of the photointermediate metarhodopsin-II (MII) that is capable of activating the G protein transducin3, 4. PE lipids have the tendency to form inverse hexagonal lipid phases (HII) composed of highly curved monolayers with small area per lipid at the PE headgroup and a larger area near the terminal methyl groups of hydrocarbon chains. When forced into a lamellar arrangement, those monolayers are under considerable negative curvature elastic stress.
Here we investigated the influence of hydrocarbon chain polyunsaturation on coefficients of monolayer curvature elasticity for the polyunsaturated lipids 18:0-22:6n-3PE and 18:0-22:5n-6PE and compared them to the model lipid 18:1n-9-18:1n-9PE (DOPE). Using a combination of 31P NMR, 2H NMR, magic angle spinning (MAS) 1H-NMR, and x-ray diffractometry, we determined the phase state of the lipid water dispersions, the order parameters of lipid hydrocarbon chains, the water content of inverse hexagonal phases, and the repeat spacing of inverse cylindrical micelles in the HII phase, respectively. The energetics of bending lipid monolayers were followed by dehydrating the HII phase under controlled osmotic pressure induced by polyethylene glycol (PEG)/water solutions5. The bending elastic modulus, Kcp, the spontaneous radius of monolayer curvature, Rop, and the area per lipid molecule at the pivotal plane, Ap, where area per lipid remains constant upon monolayer bending, were determined by fitting the experimental data to a model developed earlier by Rand, Gruner, and Parsegian6, 7.
Bovine rhodopsin was reconstituted into proteoliposomes composed of the PEs at concentrations from 0–75 mol% in 16:0-18:1n-9PC (POPC). After a flash of light, the equilibrium of the photointermediates metarhodopsin-I (MI) and metarhodopsin-II (MII) was measured spectrophotometrically following procedures developed by the Litman laboratory8. The predicted shift in the MI/MII equilibrium towards MII from negative curvature elastic stress in membranes is compared with experimentally measured MI/MII equilibria.
Materials and Methods
Sample preparation
The phospholipids were synthesized by Avanti Polar Lipids (Alabaster, AL).
Lipid Samples
Polyunsaturated PEs are particularly prone to oxidation. Therefore all sample handling was conducted in a model 855-AC controlled atmosphere chamber (PLAS LAB, Lansing, MI) filled with oxygen-free argon or nitrogen gas. The antioxidant butylated hydroxytoluene (BHT) was added to the lipids at a molar ratio of 1 BHT per 100 lipids. All solutions were carefully degassed before use. Oxidation of lipids was monitored by recording 1H high-resolution NMR spectra of small aliquots of the samples in deuterated chloroform before and after the experiments. The intensity of resonances of doubled bonds at 5.3 ppm and of the methylene groups between double bonds at 2.8 ppm were compared to intensity of phosphoethanolamine and glycerol resonances. Only data from samples with negligible oxidation (< 1 mol%) were used for data analysis.
For NMR and x-ray experiments, 10-mg samples of PE were dried under a stream of ultra-pure argon or nitrogen in a rapidly rotating 5mm glass tube. The sample was hydrated by the addition of 200 μl of deuterium depleted water and the tube was capped and rotated for 30 minutes and the sample collected at the bottom of the tube by centrifugation. The sample was then removed with a spatula and placed in an 8-mm long section of 4-mm wide dialysis tubing with a molecular weight cut-off of 8,000 (Spectra/Por, Spectrum Labs, Rancho Dominguez, CA). The tubing was closed with clips and equilibrated over a period of two hours in a solution of polyethylene glycol MW=20,000 (PEG20,000, Fluka) in water at 30°C using PEG concentrations of 3, 6, 10, 15, 20, 25, 30, 35, 40, 45, 50, and 55 wt%, respectively. Rapid equilibration of water content in PE samples with the PEG solutions was critical to prevent oxidation (<1%). This was achieved by continuously pumping the PEG solution past the dialysis tubing in a chamber using a Masterflex L/S peristaltic pump (Cole-Parmer, Court Vernon Hills, IL). This procedure eliminates water gradients that tend to form near the surface of the dialysis membrane in the viscous PEG solution and decreases the equilibration time to about one hour. Equilibrated samples were transferred into sealed glass containers for 31P NMR and 2H NMR analysis and into to a 4 mm rotor for magic-angle spinning (MAS) 1H NMR analysis of water content. A duplicate set of samples was prepared for measurement of the dimensions of the HII phase using x-ray diffraction analysis.
Rhodopsin samples
Rhodopsin was purified from bovine retinas using procedures that were developed by the Litman laboratory 9. Rhodopsin fractions in 3 wt % octylglucoside (OG) which gave a UV-vis absorption intensity ratio at 280 nm/500 nm of 1.8 were used. The rhodopsin-OG solution was added to lipid-OG mixed micelles for a final OG/lipid molar ratio of 10/1 and a rhodopsin/phospholipid molar ratio of 1/250. Samples were homogenized by vortexing and then equilibrated for 12 h under argon. Subsequently, this rhodopsin/lipid solution was added dropwise at a rate of 400 μL/min to deoxygenated PIPES buffer (10 mM PIPES, 100 mM NaCl, 50 μM DTPA, pH = 7.0) under rapid stirring, resulting in formation of unilamellar proteoliposomes. Typically, the final OG concentration was 7.2 mM, which is well below the critical micelle concentration. The proteoliposome dispersion (2.5–3 mL) was then dialyzed against 1 L of PIPES buffer (Slide-A-Lyzer membrane, 10 kDa cutoff; Pierce, Rockford, IL). The buffer was exchanged three times over 24 h. The final rhodopsin concentration in the samples was measured by light absorption at 500 nm assuming a molar extinction coefficient ε500=40,600 M−1 cm−1 10. The concentration of residual OG in the lipid bilayers was lower than 0.4 mol% of the lipid concentration as determined by high-resolution 1H NMR.
NMR
Solid-state 31P- and 2H NMR spectra were acquired on a DMX300 spectrometer equipped with a 1H-X probe with a solenoid coil (Bruker BioSpin, Billerica, MA). Experiments were conducted at a resonance frequency of 121.47 MHz and a spectral width of 125 kHz using a Hahn-echo, 90°-τ–180°-τ-acquire, pulse sequence and broad-band decoupling of protons. 2H NMR spectra were acquired at a resonance frequency of 46.1 MHz using a quadrupolar echo pulse sequence 90°-τ-9090-τ-acquire. 1H-MAS NMR spectra were acquired on an AV800 spectrometer equipped with a high resolution 1H/13C/2H 4-mm MAS NMR probe (Bruker BioSpin, Billerica, MA) at a resonance frequency of 800.18 MHz and a MAS spinning frequency of 10 kHz.
X-ray diffraction
After equilibration with PEG/water solutions, the PE was filled into cells made of aluminum with mylar windows. Extra PEG solution was also loaded in the cell to maintain lipid hydration. Sample temperature was controlled to 30 ±0.5°C by thermoelectric elements beneath the cell. X-ray diffraction patterns were acquired using an Elliot GX-13 rotating-anode x-ray generator equipped with two x-ray mirrors and a Frank-type camera. Kodak image plates were used for detection. They were scanned and digitized by a Fujifilm BAS-2500 plate reader at 50-μm pixel size resolution. The phase state of lipids was characterized by its lattice dimension. Hexagonal phases gave spacings in the ratios of 1, 1/√3, 1/√ 4,1 /√ 7, 1 /√ 9,1 /√12, etc. which were used to measure the lattice dimension dhex.
Lipid density
The mass density of lipids in the HII phase was determined by centrifugation in H2O/2H2O mixtures. The temperature dependent mass densities of H2O and 2H2O were derived from spline interpolation of tabulated density data11. Lipid dispersions were transferred to 3.2 mL ultra-clear centrifuge tubes which were loaded into a Beckman TLS-55 centrifuge rotor and spun at 50,000xg for one hour in a temperature controlled Beckman TLX-100 centrifuge. A series of H2O/2H2O ratios was prepared and lipid densities were judged from the crossover point of a floating pellet to a pellet forming at the bottom of the tube.
Rhodopsin MI/MII ratio
Proteoliposomes were diluted to a rhodopsin concentration of 0.2 0.25 mg/mL in pH 7.0 PIPES-buffered saline buffer and equilibrated at 37°C in a thermally regulated sample holder. The equilibrium constant Keq=[MII]/[MI] was determined from rapidly acquired UV-vis spectra of the MI/MII equilibrium after bleaching rhodopsin to 15 20% by a 520-nm flash. Individual MI and MII spectra were deconvolved from spectra of their equilibrium mixture as described previously8. The concentration of the photointermediates MI and MII were determined using extinction coefficients of 44,000 cm−1 and 38,000 cm−1 at their absorbance maxima of 478 nm and 365 nm, respectively.
Results
PE phase diagram
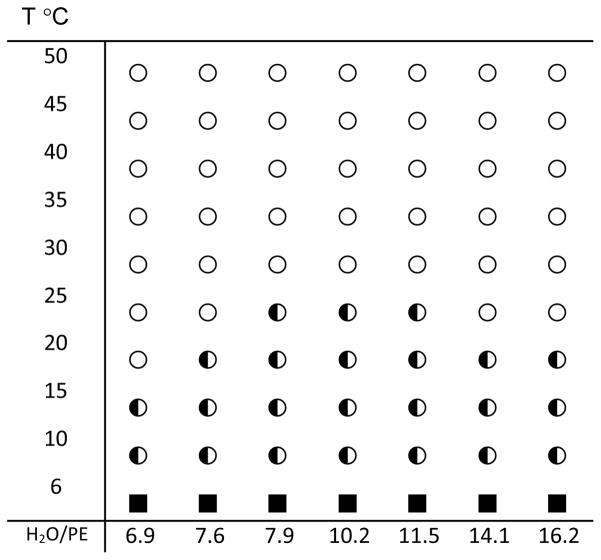
The phase state of the PE/water samples was determined by 31P NMR as a function of temperature over the range of 5–50°C (Fig. 2). The phase diagram shows that at temperatures above 25°C, 18:0d35-22:6n-3PE forms an HII phase at all water concentrations. The phase diagram of 18:0d35-22:5n-6PE and 18:1n-9-18:1n-9PE12 are very similar to the phase diagram shown in Fig. 3. Therefore, the properties of PE monolayers in the HII phase were studied at a temperature of 30°C.
Fig. 2.
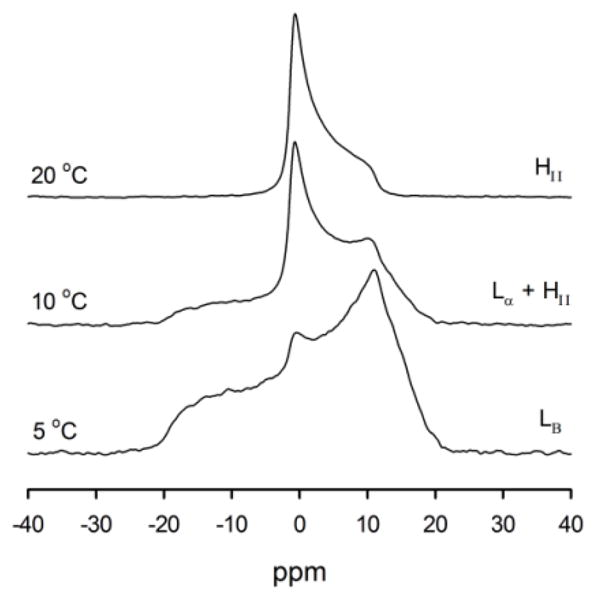
31P NMR spectra of a 18:0d35-22:6n-3PE sample containing 6.9 water molecules per lipid. With increasing temperature, the sample converted from a crystalline Lβ-phase to coexisting Lα- and HII phases and finally to a HII phase.
Fig. 3.
Phase diagram of 18:0d35-22:6n-3PE as a function of water content and temperature. ○ - inverse hexagonal phase, HII; ◐- mixture of hexagonal, HII, and liquid-crystalline lamellar, Lα, phases; ■ - crystalline lamellar, Lβ, phase
Chain order parameters
The order parameters of the saturated stearoyl hydrocarbon chains at position sn-1 of the polyunsaturated 18:0d35-22:6n-3PE and 18:0d35-22:5n-6PE were determined by measurement of the 2H-NMR quadrupolar splittings of methylene and methyl groups. The so-called de-Paked 2H spectra13, equivalent to spectra acquired on an oriented HII phase with the long axis of inverse hexagonal HII micelles parallel to the main magnetic field, B0, are shown in Fig. 4. The corresponding order parameters were calculated according to the equation14
Fig. 4.
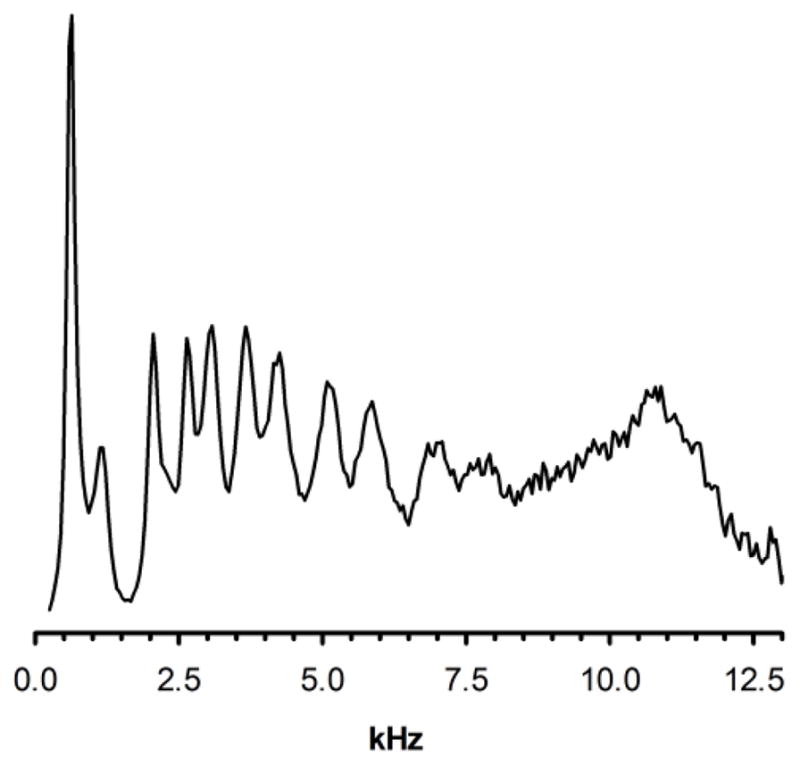
De-Paked 2H NMR spectrum of 18:0d35-22:6n-3PE acquired at a temperature of 30°C. Only the right half of the symmetrical spectrum is shown. The resolved peaks correspond to the quadrupolar splittingsof the aliphatic groups of stearic acid beginning with the terminal methyl group on the left and ending with methylene group, C2, at the carboxyl end.
| (1) |
where Δνq is the measured quadrupolar splitting, 3/2(e2qQ/h)=250 kHz for a C-2H bond and SC2H is the bond order parameter. Lipids in an inverse hexagonal phase reorient about an axis radial to the HII micelles at correlation times on the order of nanoseconds and reorient by diffusion about the circular micelles at correlation times in the microsecond range. It can be shown that the latter, slower motion reduces lipid order parameters by a factor of ½ compared to a fluid lamellar lipid phase15. The corresponding order parameter profile of the sn-1 hydrocarbon chains is shown in Fig. 5.
Fig. 5.
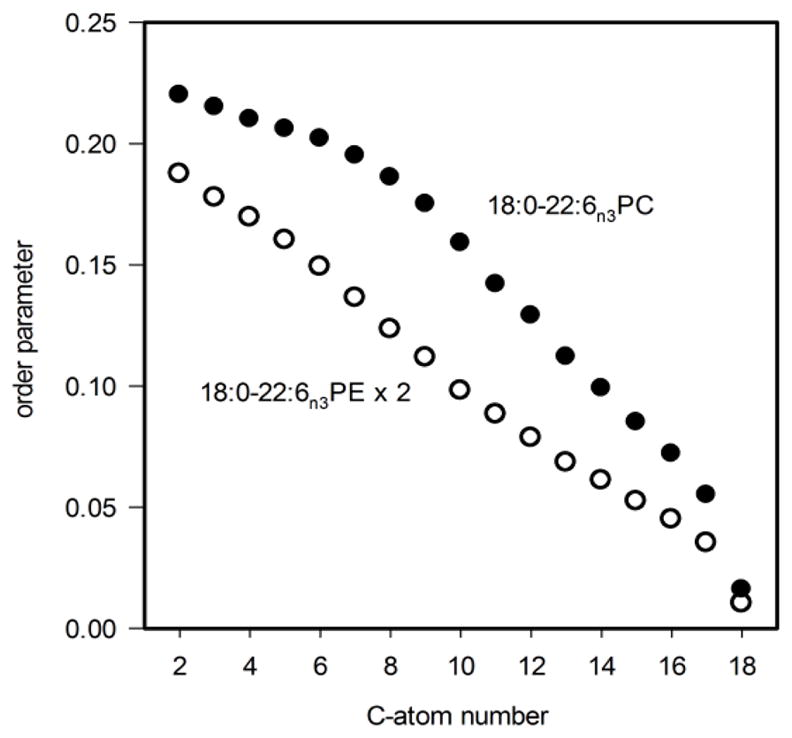
Order parameter profile of the sn-1 chain in 18:0d35-22:6n-3PE (open circles) in comparison to the order parameter profiles of 18:0d35-22:6n-3PC (filled circles)16. The order parameters of 18:0d35-22:6n-3PE are multiplied by a factor of two to eliminate order reduction from diffusion about the tubular HII phase micelles.
The lipid order of stearic acid in an HII phase decreases steadily from methylene group C2 towards the terminal methyl group. This is in contrast to order in lamellar lipid phases that has an order parameter plateau for chain segments C2–8 and declining order for C9–18. The difference reflects the different lipid geometry in fluid lamellar and HII phases. While lipids in a lamellar phase occupy the volume of a cylinder, in the HII phase they occupy the volume of a cone with small area at the headgroup and a larger area at the hydrocarbon chains (see Fig. 6). The larger area at the level of chains translates into larger amplitudes of orientational fluctuations of methylene segments which yields lower chain order parameters, in particular for methylene segments C9–18. Lower order near the carboxyl group of stearic acid could be related to systematic changes of chain tilt upon diffusion about hexagonal phase cylinders as discussed by Hamm and Kozlov17.
Fig. 6.
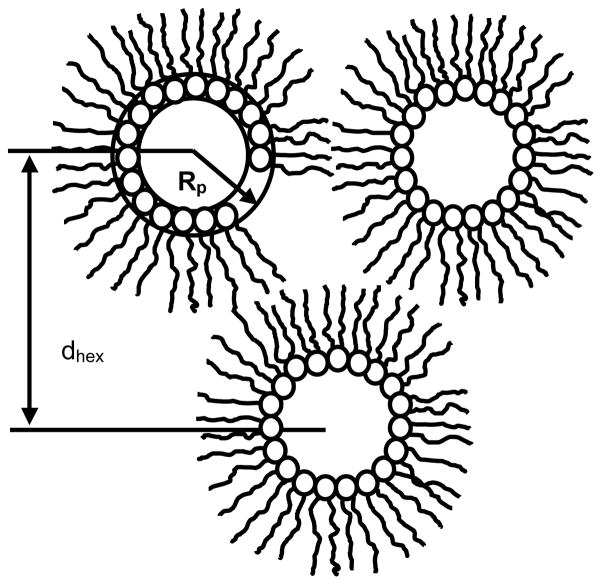
Arrangement of cylindrical micelles in an inverse hexagonal, H II phase. The core of the micelles is filled with water. The repeat spacing dhex is measured by x-ray diffraction. Dehydration of HII micelles by application of controlled osmotic stressfrom PEG/water solutions reduces the water volume and changes the radius of micelles, Rp, measured at the pivotal plane.
HII phase dimensions
The repeat spacing of the HII phases of all three PEs was determined by x-ray diffraction at a temperature of 30°C. The geometry of an HII phase is shown in Fig. 6. The lipids form inverted tubular micelles with a water-filled core. The tubular micelles are arranged in a hexagonal lattice with the repeat spacing dhex as shown in Fig. 6.
The repeat spacing dhex as a function of osmotic pressure, π, for the PEs is shown in Fig. 7.
Fig. 7.
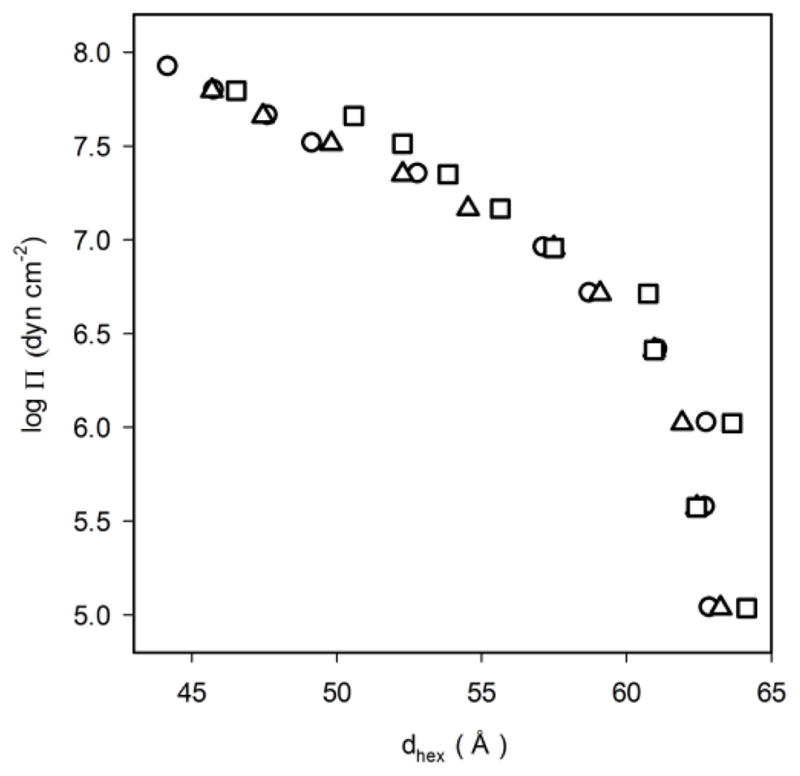
Repeat spacings dhex for 18:0d35-22:6n-3PE (squares), 18:0d35-22:5n-6 PE (triangles), and 18:1n-9-18:1n-9PE (circles) as a function of osmotic pressure of PEG20,000.
Monolayer elastic properties
With increasing osmotic pressure, the volume of the water core and the radius of curvature of the inverse micelles decrease which results in decreased repeat spacings dhex. The change of the radius of curvature of lipid monolayers in the inverse micelles under osmotic stress yields the energy of monolayer bending. The calculation requires knowledge of the number of water molecules per PE molecule in the water-filled core. Water content was determined by comparison of integral intensity of the 1H resonance of water to integral intensity of lipid resonances in the 1H-MAS NMR spectra of HII phases that were equilibrated against PEG20,000 water solutions. The water content as a function of PEG20,000 concentration is shown in Fig. 8.
Fig. 8.
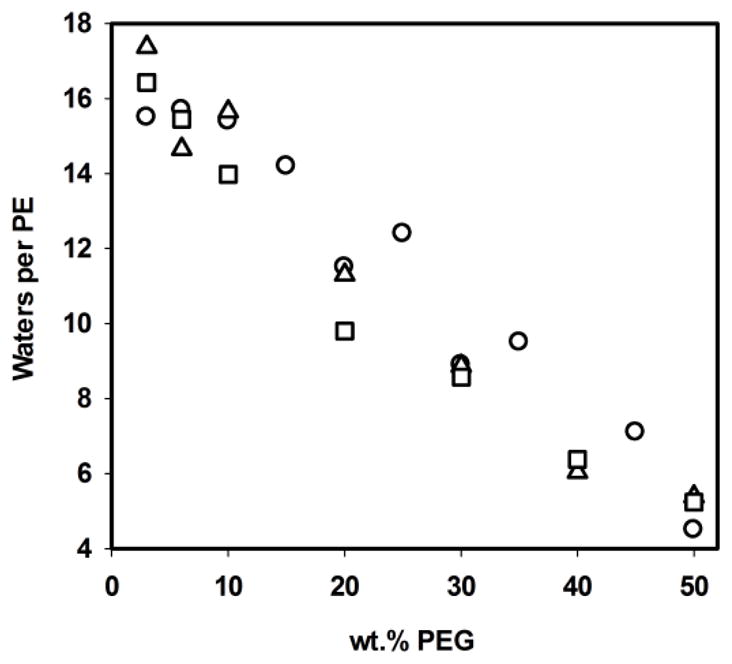
Number of water molecules per PE in HII phases of 18:0d35-22:6n-3PE (squares), 18:0d35-22:5n-6PE (triangles), and 18:1n-9-18:1n-9PE (circles) as a function of PEG20,000 concentration in wt.%.
The energy of bending of a lipid monolayer can be approximated by the equation18, 19
| (2) |
where Kcp is the elastic bending modulus, Ap, the area per lipid molecule at the radius Rp, and R0p the spontaneous radius of curvature. Following procedures reported by Rand, Gruner, and Parsegian7, 20, we relate the elastic energy given by eq. 2 tothe osmotic work done by applying osmotic stress π:
| (3) |
The density measurements at 30°C yield specific volumes per molecule of 18:0d35-22:6n-3PE and 18:1n-9-18:1n-9PE of 1,282 A and 1,218 Å3, respectively. The specific volume of 18:0d35-22:5n-6PE is 1,294 Å3, as calculated from the specific volume of 18:0d35-22:6n-3PE with a correction for the number of –CH2 and =CH groups per sn-2 chain with the specific volumes of 28.14 Å3 and 22.31 Å3, respectively21. The analysis yielded the elastic parameters of lipid monolayers in the HII phase as reported in Tab. 2.
Tab. 2.
Elastic Parameters of Lipid Monolayers
| Lipid | Ap (Å2)a | Kcp (kT/molec.) b | R0p (Å)c |
|---|---|---|---|
| 18:0-22:6n-3PE | 65.5 | 11.7 | 27.5 |
| 18:0-22:5n-6PE | 58.9 | 9.3 | 26.0 |
| 18:1n-9-18:1n-9PE | 61.2 | 9.9 | 26.9 |
±2 Å2;
±1 kT/molec.;
±2 Å
MI/MII equilibrium of rhodopsin
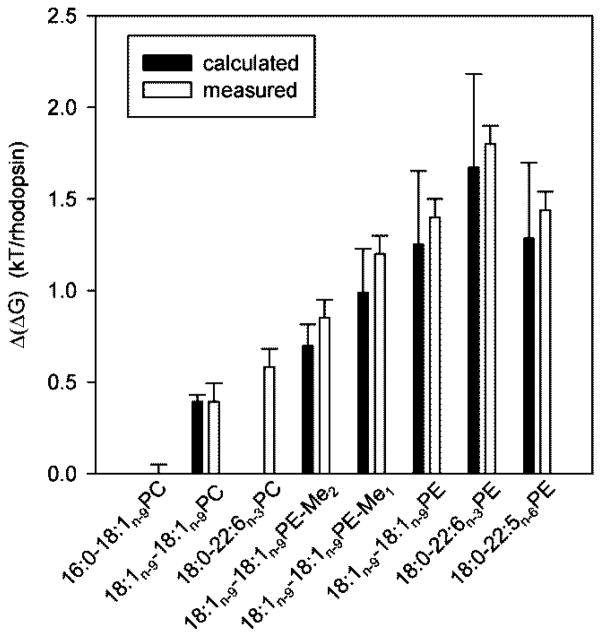
Dark adapted bovine rhodopsin was reconstituted into 16:0-18:1n-9PC bilayers containing 0–75 mol% of 18:0-22:6n-3PE, 18:0-22:5n-6PE, or 18:1n-9-18:1n-9PE, respectively. Up to PE concentrations of 75 mol%, the reconstituted proteoliposomes remained in a lamellar phase. With increasing PE concentration, the MI/MII equilibrium shifted towards MII as reported earlier3,4. Experimental results shown in Fig. 10 are extrapolated to 100% PE in the membrane.
Fig. 10.
Measured and calculated energetic differences Δ(ΔG) between photointermediates MI and MII in membranes composed of lipids with increasing negative curvature elastic stress (see eq. 4,5). Experiments were conducted at a rhodopsin/lipid ratio of 1/250. Data are reported relative to 16:0-18:1n-9PC, a lipid with negligible curvature elastic stress. Experimental data for PEs could be obtained up to a concentration of 75 mol% PE in membranes only. Results shown in this figure are linearly extrapolated to 100% PE.
Let’s assume that the difference in free energy between the MI and MII photointermediates of rhodopsin in lipid bilayers is due to differences in curvature elastic stress of lipid monolayers. Following the flexible surface model of Brown3, it can be shown that the change in free energy of rhodopsin is
| (4) |
and
| (5) |
where k is the Boltzmann constant, T the absolute temperature, Keq=[MII]/[MI] the ratio of concentrations of photointermediates MII and MI, nL the number of lipids per protein molecule, and are the bending elastic coefficients of lipids 1 and 2, and are the areas at the pivotal plane of lipids 1 and 2, and are the radii of spontaneous monolayer curvature at the pivotal plane for lipids 1 and 2, and RMI and RMII are the radii of lipid monolayer curvature near the photointermediates MI and MII, respectively. For derivation of equ. 5 it was assumed that the protein-induced monolayer curvatures RMI and RMII are constant throughout the membrane and independent of lipid composition4. The value of the factor (1/RMII-1/RMI) was adjusted to fit the span of experimentally measured values of Δ(ΔG) (see Fig. 10) which yielded (1/RMII-1/RMI)=2.36x10−4 AǺ−1. The spontaneous monolayer curvature of 16:0-18:1n-9PC was assumed to be ∞. In Fig. 10, the Δ(ΔG) energies relative to 16:0-18:1n-9PC bilayers for a series of lipids are shown. Results for lipids that are not reported in this paper were taken from our previous publication4.
Discussion
It was determined that the polyunsaturated lipids 18:0-22:6n-3PE and 18:0-22:5n-6PE and the model lipid 18:1n-9-18:1n-9PE form lipid monolayers in a HII phase with very small spontaneous radii of curvature. While the model lipid 18:1n-9-18:1n-9PE (DOPE) is uncommon, PE with the polyunsaturated docosahexaenoic acid (22:6n-3, DHA) is found at high concentrations in the brain, retina, and sperm of mammals2. It was observed that high DHA concentrations are critical for proper brain development and function22. In animal and human infant studies it was shown that deficiency in ω-3 fatty acids is associated with visual and cognitive deficits23, 24. In cases of an insufficient supply of ω-3 fatty acids, DHA is replaced by docosapentaenoic acid (22:5n-6, DPAn-6), an ω-6 fatty acid with one less double bond at the methyl terminal end of the chain. Such replacement may not be lethal, but has been related to some loss in function2, 25, 26.
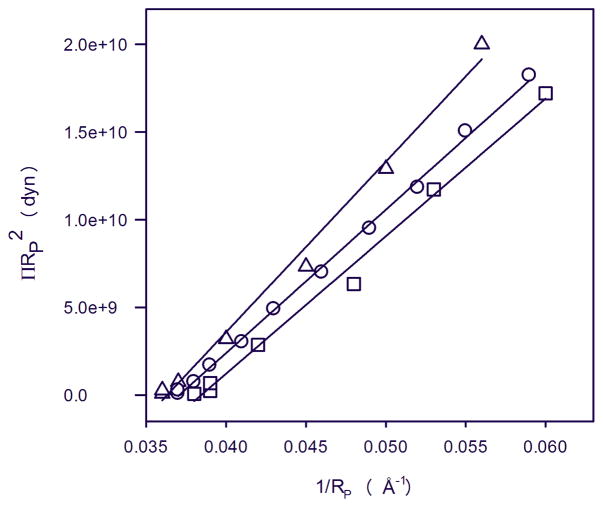
Our results show convincingly that membranes with high content of polyunsaturated PEs have monolayers that are under severe negative curvature elastic stress. The series of lipids in Fig. 9 shows that such increasing curvature stress favors formation of the photointermediate MII that is capable of activating the G protein transducin.
Fig. 9.
Plot relating the osmotic work to dehydrate the hexagonal phase to the change in monolayer curvature, 1/Rp, for 18:0d35-22:6n-3PE (squares), 18:0d35-22:5n-6PE (triangles), and 18:1n-9-18:1n-9PE (circles). The fit to the data points yields the bending elastic modulus, Kcp, and the spontaneous radius of monolayer curvature, R0p.
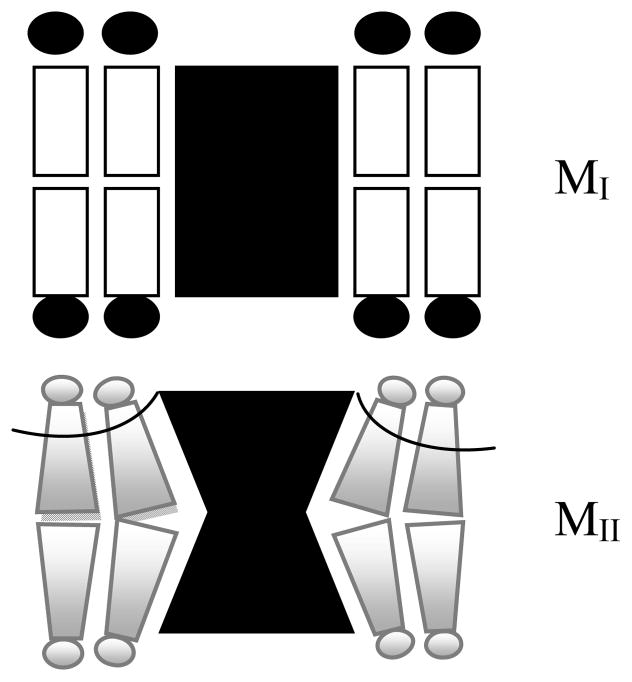
Recent observations on the mechanism of photoactivation of rhodopsin provide a plausible cause for the shift of the MI/MII equilibrium towards MII under negative curvature elastic stress. The transition from MI to MII is associated with an outward tilt of transmembrane helix VI of rhodopsin27, 28. The photointermediate MII tends to be more hourglass-shaped as shown in Fig. 11. This induces negative curvature in lipid monolayers near the protein and releases curvature stress in the MII-lipid domain and, therefore, favours formation of the photointermediate MII. Since there is a steady increase in the amount of MII with increasing negative curvature elastic stress (see Fig. 10), curvature stress appears to be the most important mechanism that shifts the MI-MII equilibrium.
Fig. 11.
Cartoon highlighting the structural differences between the rhodopsin photointermediates MI and MII. Structural data on MI and MII suggest that MII tends to be more hourglass-shaped. This generates negative curvature in lipid monolayers near the protein. Please note that structural differences are exaggerated for clarity.
The replacement of the ω-3 polyunsaturated 18:0-22:6n-3PE by the ω-6 polyunsaturated 18:0-22:5n-6PE with just one fewer double bond results experimentally in a somewhat lower formation of MII, similar to values observed for the model lipid 18:1n-9-18:1n-9PE. The differences in calculated curvature elastic stress for monolayers of all three lipids are not statistically significant. According to predictions from measurements on HII phases, all three lipids form monolayers that are under high curvature elastic stress in membranes. Therefore one could argue that 18:0-22:5n-6PE that is formed under conditions of dietary deficiencies of ω-3 fatty acids is the next best substitute for 18:0-22:6n-3PE, although, experimentally it seems to be somewhat inferior.
Regarding the quantitative comparison between monolayer elastic properties in a HII phase probed by application of osmotic stress and shifts in rhodopsin function a word of caution is advisable. The coefficients of curvature elasticity have been fitted to data obtained over a limited range of curvatures, most of them rather small. When extrapolating results to curvature near rhodopsin, a wider range of curvatures is probed, from smaller radii near the protein to flat monolayers further away from the protein where Rp approaches infinity. The latter case is well outside the range for which elastic properties have been determined. Furthermore, the assumptions used to derive eq. 5 are rather crude (see Soubias et al.4) leaving room for improvement. A more detailed analysis of decay of perturbations in the lipid matrix with increasing distance from the protein that also takes into consideration that lipids have a tilt degree of freedom, not just bending, is required17. Furthermore, the lipid-protein interface is inhomogeneous in terms of lipid-protein interaction about the protein circumference29–31.
It was shown that the elastic response of the protein to the frustrated spontaneous curvature of the component lipid monolayer leaflets is equivalent to the response of the protein to a membrane lateral pressure profile32. The curvature elastic data for the lipids 18:1n-9-18:1n-9PC and 18:1n-9-18:1n-9PE were used for evaluation of possible differences in rhodopsin geometry between MI and MII32.
Recently, a series of crystal structures of rhodopsin-like GPCR have been published, among them the important dopaminergic33 and adrenergic receptors34–36. The data show convincingly that class A GPCR have a lot of common functional motives, although similarities in amino acid sequences are rather limited. Therefore we propose that bovine rhodopsin may serve as convenient representative of class A GPCR to study the influence of lipid matrix properties on function. The ligand 11-cis-retinal is a powerful inverse agonist that provides great stability to dark adapted rhodopsin37. However, all-trans-retinal that is formed by photoactivation seems to be a weak agonist which generates variable amounts of MII depending on environmental conditions. It has been widely discussed that GPCR activation is under heavy influence of allosteric modulators38. The data on the influence of the lipid matrix on rhodopsin function suggest that the properties of the lipid matrix are, perhaps, the most important allosteric modulator of GPCR function.
There is an important difference between rhodopsin and other GPCR. While rhodopsin has no constitutive activity without photoactivation, most other GPCR have substantial constitutive activity in the absence of a ligand39. Such constitutive activity is likely to be most dependent on composition of the lipid matrix.
Conclusions
Negative curvature elastic stress in membranes containing high concentrations of polyunsaturated PEs is very high. Release of even a small fraction of this stress from the layer of lipids surrounding the receptor is sufficient to shift the MI/MII equilibrium towards MII, the state that activates G protein. Furthermore, polyunsaturated bilayers have a hydrophobic thickness of about 27 Å which has been determined to match the length of the hydrophobic transmembrane helices of rhodopsin40. The data show that polyunsaturated lipids are important for class A GPCR activation, and we speculate that the rhodopsin model is particularly relevant for constitutive activity of GPCR and activation by weak agonists.
Fig. 1.
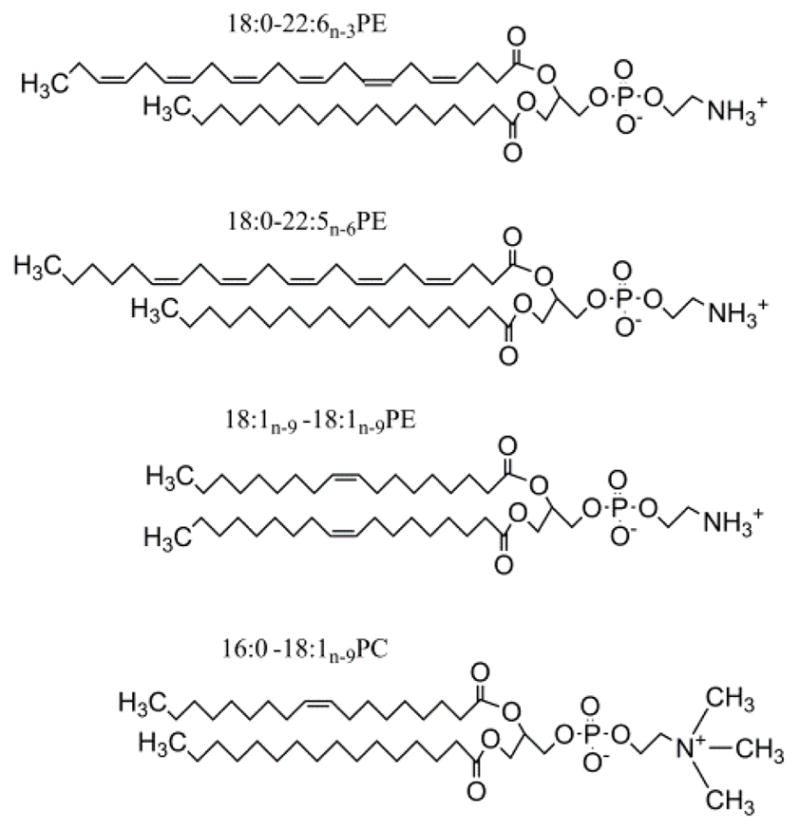
The lipids 1-perdeuterio-stearyl-2-docosahexaenoyl-sn-glycero-3-phosphoethanolamine (18:0d35-22:6n-3PE), 1-perdeuterio-stearyl-2-docosapentaenoyl-sn-glycero-3-phosphoethanolamine (18:0d35-22:5n-6PE), 1,2-dioleoyl-sn-glycero-3-phosphoethanolamine (18:1n-9-18:1n-9PE), and 1-palmitoyl-2-oleoyl-sn-glycero-3-phosphocholine (16:0-18:1n-9PC).
Acknowledgments
This work was supported by the Intramural Research Program of the National Institute on Alcohol Abuse and Alcoholism, National Institutes of Health.
Contributor Information
Horia Petrache, Email: hpetrach@iupui.edu.
R. Peter Rand, Email: rrand@brocku.ca.
Klaus Gawrisch, Email: gawrisch@helix.nih.gov.
Notes and references
- 1.Boesze-Battaglia K, Albert AD. Exp Eye Res. 1992;54:821–823. doi: 10.1016/0014-4835(92)90040-y. [DOI] [PubMed] [Google Scholar]
- 2.Salem N, Spiller GA, Scala A. New Protective Roles for Selected Nutrients. Alan R. Liss, Inc; New York: 1989. pp. 109–228. [Google Scholar]
- 3.Botelho AV, Gibson NJ, Thurmond RL, Wang Y, Brown MF. Biochemistry. 2002;41:6354–6368. doi: 10.1021/bi011995g. [DOI] [PubMed] [Google Scholar]
- 4.Soubias O, Teague WE, Jr, Hines KG, Mitchell DC, Gawrisch K. Biophys J. 2010;98:817–824. doi: 10.1016/j.bpj.2010.04.068. [DOI] [PMC free article] [PubMed] [Google Scholar]
- 5.Parsegian VA, Rand RP, Fuller NL, Rau DC. Methods Enzymol. 1986;127:400–416. doi: 10.1016/0076-6879(86)27032-9. [DOI] [PubMed] [Google Scholar]
- 6.Rand RP, Parsegian VA. Current Topics in Membranes. 1997;44:167–189. [Google Scholar]
- 7.Gruner SM, Parsegian VA, Rand RP. Faraday Discuss Chem Soc. 1986;81:29–37. doi: 10.1039/dc9868100029. [DOI] [PubMed] [Google Scholar]
- 8.Straume M, Mitchell DC, Miller JL, Litman BJ. Biochemistry. 1990;29:9135–9142. doi: 10.1021/bi00491a006. [DOI] [PubMed] [Google Scholar]
- 9.Litman BJ, Lester P. Methods Enzymol. 1982;81:150–153. doi: 10.1016/s0076-6879(82)81025-2. [DOI] [PubMed] [Google Scholar]
- 10.Wald G, Brown PK. J Gen Physiol. 1953;37:189–200. doi: 10.1085/jgp.37.2.189. [DOI] [PMC free article] [PubMed] [Google Scholar]
- 11.Lide DR. Handbook of Chemistry and Physics. CRC Press; Boca Raton: 2004. [Google Scholar]
- 12.Gawrisch K, Parsegian VA, Hajduk DA, Tate MW, Graner SM, Fuller NL, Rand RP. Biochemistry. 1992;31:2856–2864. doi: 10.1021/bi00126a003. [DOI] [PubMed] [Google Scholar]
- 13.Sternin E, Bloom M, MacKay AL. J Magn Reson. 1983;55:274–282. [Google Scholar]
- 14.Davis JH, Jeffrey KR, Bloom M, Valic MI, Higgs TP. Chem Phys Lett. 1976;42:390–394. [Google Scholar]
- 15.Seelig J. Biochim Biophys Acta. 1978;515:105–140. doi: 10.1016/0304-4157(78)90001-1. [DOI] [PubMed] [Google Scholar]
- 16.Holte LL, Peter SA, Sinnwell TM, Gawrisch K. Biophys J. 1995;68:2396–2403. doi: 10.1016/S0006-3495(95)80422-4. [DOI] [PMC free article] [PubMed] [Google Scholar]
- 17.Hamm M, Kozlov MM. Europ Phys J B. 1998;6:519–528. [Google Scholar]
- 18.Helfrich W. Z Naturforsch. 1973;28c:693–703. doi: 10.1515/znc-1973-11-1209. [DOI] [PubMed] [Google Scholar]
- 19.Kirk GL, Gruner SM, Stein DL. Biochemistry. 1984;23:1093–1102. [Google Scholar]
- 20.Rand RP, Fuller NL, Gruner SM, Parsegian VA. Biochemistry. 1990;29:76–87. doi: 10.1021/bi00453a010. [DOI] [PubMed] [Google Scholar]
- 21.Koenig BW, Gawrisch K. Biochim Biophys Acta. 2005;1715:65–70. doi: 10.1016/j.bbamem.2005.07.006. [DOI] [PubMed] [Google Scholar]
- 22.Salem N, Litman B, Kim HY, Gawrisch K. Lipids. 2001;36:945–959. doi: 10.1007/s11745-001-0805-6. [DOI] [PubMed] [Google Scholar]
- 23.Neuringer M, Connor WE, Lin DS, Barstad L, Luck S. Proc Natl Acad Sci USA. 1986;83:4021–4025. doi: 10.1073/pnas.83.11.4021. [DOI] [PMC free article] [PubMed] [Google Scholar]
- 24.O’Connor DL, Hall R, Adamkin D, Auestad N, Castillo M, Connor WE, Connor SL, Fitzgerald K, Groh-Wargo S, Hartmann EE, Jacobs J, Janowsky J, Lucas A, Margeson D, Mena P, Neuringer M, Nesin M, Singer L, Stephenson T, Szabo J, Zemon V, Ross S. Preterm Lipid. Pediatrics. 2001;108:359–371. doi: 10.1542/peds.108.2.359. [DOI] [PubMed] [Google Scholar]
- 25.Salem N, Jr, Kim HY, Yergey JA. In: Health Effects of Polyunsaturated fatty Acids in Seafoods. Simopoulos AP, Kifer RR, Martin RE, editors. Academic Press; New York: 1986. pp. 319–351. [Google Scholar]
- 26.Moriguchi T, Greiner RS, Salem N. J Neurochem. 2000;75:2563–2573. doi: 10.1046/j.1471-4159.2000.0752563.x. [DOI] [PubMed] [Google Scholar]
- 27.Altenbach C, Kusnetzow AK, Ernst OP, Hofmann KP, Hubbell WL. Proc Natl Acad Sci USA. 2008;105:7439–7444. doi: 10.1073/pnas.0802515105. [DOI] [PMC free article] [PubMed] [Google Scholar]
- 28.Choe HW, Kim YJ, Park JH, Morizumi T, Pai EF, Krauss N, Hofmann KP, Scheerer P, Ernst OP. Nature. 2011;471:651–U137. doi: 10.1038/nature09789. [DOI] [PubMed] [Google Scholar]
- 29.Soubias O, Teague WE, Gawrisch K. J Biol Chem. 2006;281:33233–33241. doi: 10.1074/jbc.M603059200. [DOI] [PubMed] [Google Scholar]
- 30.Periole X, Huber T, Marrink SJ, Sakmar TP. J Am Chem Soc. 2007;129:10126–10132. doi: 10.1021/ja0706246. [DOI] [PubMed] [Google Scholar]
- 31.Mondal S, Khelashvili G, Shan J, Andersen OS, Weinstein H. Biophys J. 2011;101:2092–2101. doi: 10.1016/j.bpj.2011.09.037. [DOI] [PMC free article] [PubMed] [Google Scholar]
- 32.Marsh D. Biophys J. 2007;93:3884–3899. doi: 10.1529/biophysj.107.107938. [DOI] [PMC free article] [PubMed] [Google Scholar]
- 33.Chien EYT, Liu W, Zhao Q, Katritch V, Han GW, Hanson MA, Shi L, Newman AH, Javitch JA, Cherezov V, Stevens RC. Science. 2010;330:1091–1095. doi: 10.1126/science.1197410. [DOI] [PMC free article] [PubMed] [Google Scholar]
- 34.Rosenbaum DM, Zhang C, Lyons JA, Holl R, Aragao D, Arlow DH, Rasmussen SGF, Choi HJ, DeVree BT, Sunahara RK, Chae PS, Gellman SH, Dror RO, Shaw DE, Weis WI, Caffrey M, Gmeiner P, Kobilka BK. Nature. 2011;469:236–240. doi: 10.1038/nature09665. [DOI] [PMC free article] [PubMed] [Google Scholar]
- 35.Rasmussen SGF, Choi HJ, Fung JJ, Pardon E, Casarosa P, Chae PS, DeVree BT, Rosenbaum DM, Thian FS, Kobilka TS, Schnapp A, Konetzki I, Sunahara RK, Gellman SH, Pautsch A, Steyaert J, Weis WI, Kobilka BK. Nature. 2011;469:175–180. doi: 10.1038/nature09648. [DOI] [PMC free article] [PubMed] [Google Scholar]
- 36.Warne T, Moukhametzianov R, Baker JG, Nehme R, Edwards PC, Leslie AGW, Schertler GFX, Tate CG. Nature. 2011;469:241–244. doi: 10.1038/nature09746. [DOI] [PMC free article] [PubMed] [Google Scholar]
- 37.Bennett MP, Mitchell DC. Biophys J. 2008;95:1206–1216. doi: 10.1529/biophysj.107.122788. [DOI] [PMC free article] [PubMed] [Google Scholar]
- 38.Melancon BJ, Hopkins CR, Wood MR, Emmitte KA, Niswender CM, Christopoulos A, Conn PJ, Lindsley CW. J Med Chem. 2012;55:1445–1464. doi: 10.1021/jm201139r. [DOI] [PMC free article] [PubMed] [Google Scholar]
- 39.Seifert R, Wenzel-Seifert K. Naunyn-Schmiedebergs Arch Pharmacol. 2002;366:381–416. doi: 10.1007/s00210-002-0588-0. [DOI] [PubMed] [Google Scholar]
- 40.Soubias O, Gawrisch K. Biochim Biophys Acta. 2012;1818:234–240. doi: 10.1016/j.bbamem.2011.08.034. [DOI] [PMC free article] [PubMed] [Google Scholar]


