

Abstract
Individual chromatin molecules contain valuable genetic and epigenetic information. To date, there have not been reliable techniques available for the controlled stretching and manipulation of individual chromatin fragments for high-resolution imaging and analysis of these molecules. We report the controlled stretching of single chromatin fragments extracted from two different cancerous cell types (M091 and HeLa) characterized through fluorescence microscopy and atomic force microscopy (AFM). Our method combines soft-lithography with molecular stretching to form ordered arrays of more than 250,000 individual chromatin fragments immobilized into a beads-on-a-string structure on a solid transparent support. Using fluorescence microscopy and AFM, we verified the presence of histone proteins after the stretching and transfer process.
Keywords: Mammalian chromatin, single molecule, soft-lithography, molecular stretching, fluorescence imaging, AFM
Chromatin consists of repeating nucleosome units that contain two pairs of four types of histone proteins (H2A, H2B, H3 and H4) forming an octamer or eight-unit histone core, that is wrapped 1.65 turns by a 147-base length of DNA controlling access to the underlying sequence. The composition, modification and structure of chromatin play a crucial role in gene expression. In mammalian organisms, epigenetic gene regulation functions through methylation of CpG dinucleotides and remodeling of chromatin structure through post-translational histone modifications such as acetylation, methylation, ubiquitylation, poly(ADP)ribosylation, and phosphorylation that can affect the biophysical properties and signaling of regulatory factors within the chromatin template. In the study of a variety of diseases, there is an active effort to map genome-wide genetic and epigenetic patterns across cell types, the latter in response to various environmental influences1,2 for the understanding of gene regulation and for medical diagnostics. Interrogation of chromatin modifications could serve as a tool for diagnosis and monitoring the effectiveness of treatment. In non-mammalian organisms such as drosophila, chromatin profiling would provide a means of identifying transcriptional target genes and cofactor recruitment during development.3
High resolution imaging methods, facilitated by stretching and immobilization of chromatin, may provide a direct approach to identifying epigenetic modifications throughout the genome. While the majority of current studies investigate large cell populations through chromatin immunoprecipitation protocols (ChIP) coupled with either hybridization arrays or sequencing4 or through Fluorescence In Situ Hybridization (FISH)-like visualization at the gross levels of chromosomal superstructure,5 few studies are aimed towards studying chromatin at the fine scale. The concept of stretching nucleic acids for analysis has been largely exploited in the case of bare DNA. Current techniques for DNA stretching comprise end-tethering, in combination with optical or magnetic tweezers,6–7 stretching on polydimethylsiloxane (PDMS) stamps,8–13 adsorption onto a modified surface under flow,14–15 shear flow,16–19 and nanoconfinement.20–21 While these techniques should be transposable to chromatin, we note that chromatin stretching is less studied, except for end-tethered stretching22–27 and a few recent nanoconfinement studies.28–29 The most popular stretching technique for FISH-like genetic or epigenetic analysis relies on cell shearing after fixation, the latter leading to poor molecule to molecule repeatability.5,30 As an example, chromatin fibers from drosophila and human cells have been spread by direct lysis onto charged microscope slides to show the organization of covalently modified histones in silent chromatin sequences,31 DNA replication timing in centromeric regions,32–34 and to study distribution of GINS complex.35 Other studies involve stretching chromatin fibers to establish a mapping between spatial location and genomic location5,14 or for morphological studies using transmission electron microscopy and atomic force microscopy.36 In recent years, progress has been made in employing new technologies with the potential to bridge the gap between static structural features and dynamic physiological processes in the study of biomolecules, while increasing spatial resolution.37–39 Yet, to our knowledge, no method has been demonstrated that allows the controllable stretching and isolation of canonical and native chromatin molecules for high-throughput analyses while being compatible with high-resolution imaging techniques.
We present a method for the stretching of chromatin molecules into ordered arrays on solid platforms compatible with scanning probe and optical imaging techniques. The controlled stretching of chromatin enables high-throughput location-resolved optical investigation of DNA and nucleoproteic material with a resolution set by signal averaging and the imaging technique employed. We believe that this level of single-molecule analysis is necessary to identify spatial relationships among chromatin features which provide insights into regulatory processes controlling normal chromatin states and how they are disrupted in disease, for studying epigenetic variability in mammalian heterogeneous samples, but also for fundamental understanding of biological processes in non-mammalian organisms such as drosophila.
RESULTS AND DISCUSSION
The experimental procedure is depicted in Figure 1. Our methodology is a combination of soft-lithography and molecular stretching that allows controlling the number, positioning and stretching of the chromatin molecules by capillarity during the assembly process. The resulting array is then transferred onto the analysis support by simple contact between the elastomeric stamp and the support.
Figure 1.

Schematic representation of the experimental methodology to generate stretched and oriented chromatin arrays on a solid support. (1), and (2) represent the assembly and stretching process by capillarity. (1) The microstructured PDMS stamp is placed on a translation stage controlled in speed. A droplet of extracted chromatin in solution is deposited on the stamp. (2) The liquid meniscus of the solution containing the extracted chromatin is dragged over the microstructured PDMS stamp at controlled speed. The evaporation phenomenon is represented in red. The molecules are physically trapped and stretched as the meniscus is displaced across the substrate. (3) represents the transfer-printing of the obtained chromatin array on an APTES-coated cover slip by contacting the PDMS stamp with the APTES-coated surface for two minutes and then peeling it away.
We first focused our study on chromatin extracted from M091 cells. As a control experiment and to allow visualization of chromatin, DNA was stained with YOYO-1. Figure 2 shows the results obtained from directed capillary assembly of YOYO-1-stained M091 chromatin on a structured PDMS stamp and its subsequent transfer printing onto an APTES-coated cover slip through electrostatic interaction. The fluorescence images show that we obtain, after transfer, ordered and high density arrays of stretched and isolated fragments following a Poisson distribution and over large areas (Supporting Information S1). The size distribution of the chromatin fragments ranges from about 5 kbp to 70 kbp, which corresponds to the expected lengths from the electrophoresis gel (see Supporting Information S2).
Figure 2.
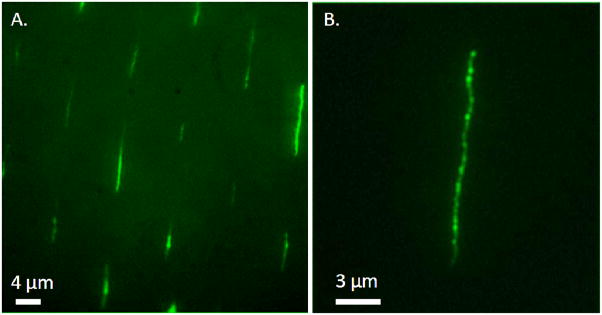
Fluorescence images of an array of stretched and oriented M091 chromatin molecules transferred onto an APTES-coated cover slip (excitation at 475 nm). The molecules are YOYO-1 stained. (B) corresponds to a 1.5X zoom of image (A).
The morphology of the stretched fragments appears to be different from the morphology of naked DNA.8,40 In some cases, we observe the presence of bright blobs along the molecules. We suggest these inhomogeneities could be caused by wrapping of stained DNA inducing a local increase of fluorescence, uneven staining of DNA, a nod of nucleosomes, bent chromatin, or the presence of more than one fragment of chromatin. We used AFM imaging to confirm the chromatin structure and Figure 3 shows the obtained AFM images of the sample shown in Figure 2. We observe that the chromatin molecules we see in fluorescence, Figure 2, are decorated with complexes regularly spaced and evenly distributed along the entire fragments’ length. The cross-section measurements indicate the average height of each complex to be 10.4 ± 1.8 nm with 136.9 ± 45.0 nm interdistance between adjacent ones. In between complexes, the height of linker DNA was measured at 1.76 ± 0.38 nm. These values are consistent with the theoretical size of nucleosomes in mammalian chromatin which measure 10 nm in diameter in average41 and are generally well organized despite cell heterogeneity. This suggests we are in the presence of individual nucleosomes across the fragments, further implying that the technique allows the stretching of the chromatin fragments to a beads-on-a-string configuration. Note no cross-linking of chromatin molecules was required to fix the histones to the DNA in our process. As such, the forces exerted on the chromatin molecules during capillary assembly are difficult to compare with previous simulations that have been reported. On the one hand we find simulations of molecular combing on bare DNA molecules onto flat silanized or chemically functionalized surfaces,42 but no simulations involving chromatin molecules to our knowledge. On the other hand, we find simulations on the pulling of chromatin molecules using optical traps or magnetic tweezers, where one end of the molecule is chemically modified so it attaches to the support and the other one is attached to a dielectric or paramagnetic bead through a biotin/streptavidin linkage and subjected to a traction or torsion force.25,27 In both approaches, DNA is chemically attached from one end while leaving the other end loose and receptive to the stretching force. However, neither of these techniques directly applies to our situation where the molecule is not tethered at one end and neither involves the use of topographical structures of any sort. In our case, we believe there is no chemical attachment but rather that the force elastically stretches the molecule in the immediate vicinity of the meniscus, temporarily “gluing” it to the surface as the meniscus recedes. As such, the pattern geometry plays here an important role as the direction and magnitude of the capillary forces induced by the contact line pinning depend strongly on it.43 From literature, we know that on a hydrophobic substrate, the force exerted by flow combing is on the order of ~160 pN,42 and that overstretching and denaturation of naked DNA is observed beyond 150 – 300 pN depending on sequence.44 But are the elastic properties of chromatin comparable to the elastic properties of bare DNA? Optical trapping is one of the few techniques that have been able to provide insights into nucleosome dynamics. We know that trapping forces typically range between 0.1 and 100 pN, making this technique suited for investigation in the range of 0.01 and 10 pN.44 Based on the work of Wang et al.,25 we also know that the pulling force required to strip off nucleosomes from chromatin is on the order of tens of pN. Our method differs from molecular combing, and some key variants make the overall stretching force difficult to evaluate. In our experiment, the forces involved are an overall combination of various contributions (Van der Waals forces, hydrodynamic forces, substrate displacement, capillary force, convective flow, hydrophobic interactions). What we observe, however, is that the pinning of the molecules provides them with same alignment and orientation, that the resulting lengths are comparable to the lengths expected from the electrophoresis gels, and finally, that the nucleosomes are preserved during the process with interdistances kept constant and consistent with theory. These observations suggest that the forces exerted upon the fragments during the capillary assembly process are low enough to prevent the stripping of histones but at the same time high enough to allow the stretching of the fragments into the beads-on-a-string conformation necessary for high-resolution analysis. Thus, we can infer that with our substrate design and experimental parameters with a stage displacement speed of 20 μm/sec, the overall force is somewhat comprised between a few pN to a 100 pN. This ability to isolate individual chromatin fragments from an initial compacted higher-order form in solution refined into a beads-on-a-string conformation without the need for cross-linking is a characteristic of our technique which is essential for subsequent analysis. It gives access and insights into the entire library of information contained within individual chromatin fragments while preserving their native structure.
Figure 3.

AFM imaging of stretched and isolated chromatin molecule arrays. (A) represents a large scan view where we notice the positioning of two chromatin molecules as indicated by the red arrows. (B) represents an enlargement of the area outlined in (A). The insert corresponds to the cross-section measurements performed across the chromatin segment. (C) depicts a 3D representation of the chromatin molecule shown in (B). (D) is a high-resolution image of the chromatin molecule showing nucleosome distribution and positioning along one section of the stretched chromatin molecule.
To confirm the preservation of native chromatin fragments, we interrogated the extracted chromatin fragments from M091 cells with histone H3 labels. For histone labeling, we used immunolabeling through specific recognition between a histone primary antibody and its corresponding fluorescently labeled secondary antibody. To validate the specificity of our labels, we first conducted several control experiments where only fluorescent secondary antibodies were incubated against chromatin, without any primary histone antibody intermediate (Supporting Information S3). The results showed a very low rate of non-specific binding compared to the specific binding of histone antibodies of interest. In fact, since the process takes place on a hydrophobic substrate (PDMS) and since the assembly only acts on the long-chain polymer strands, this method inherently washes away unbound or free-dyes and other contaminants. Consequently, no prior purification or washing steps are required. The specificity of the antibodies being validated, we repeated the experiments but this time using the specific probes of interest. The results from our chromatin immunolabeling are shown in Figure 4. The density of molecules in the arrays allows for histone distribution to be statistically compared across each sample and in-between different samples. We observe in Fig. 4b that, as expected from our AFM imaging, Alexa647-labeled H3 histone antibodies (shown in false-red color) are colocalized with the molecules and densely distributed across the entire length of the molecules. We notice that some fluorescent spots are brighter than others. These inhomogeneities that were already observed in Figure 2 could also be caused here by the presence of antibody aggregates at some locations across the stretched molecules. This experimental protocol was repeated with chromatin extracted from HeLa cells. As shown by the electrophoresis gel (Supporting Information S2), the chromatin extraction from HeLa cells required lower micrococcal nuclease concentration and shorter digestion times to provide us with equivalent fragment sizes. Conversely, the experimental parameters used for stretching and generation of the HeLa chromatin arrays were kept identical, and similar results were obtained (see Supporting Informations S4, S5 and S6).
Figure 4.

Fluorescence micrograph of M091 chromatin fragments labeled with Alexa647-labeled histone H3 probes. DNA is stained with YOYO-1. (A). Fluorescence micrograph taken at 475 nm excitation. (B). Fluorescence micrograph from the same area taken at 620 nm. Histones H3 (shown in false red Figure 4B) are colocalized with DNA (shown in false green Figure 4A).
Considering the number of chromatin fragments per chip and the average length of the fragments, a simple calculation allows us to roughly estimate we could have about a human genome amount of DNA per chip. This suggests our technique would allow the imaging of an entire genome in a single experiment through a fast optical readout.
For data to be biologically relevant, the precision has to be at least one gene, or about 10,000 basepairs (bp). This implies that given the diffraction limit of optical microscopy of about 300 nm, chromatin has to be stretched to at least 30 bp/nm. If we analyze the panel of fluorescent images in Figure 4, the signals, even from the two closest probes of a 1 kbp separation distance are clearly discernible (Fig. 4 the mean space measured between the two signals is 320 nm), from which we can conclude the resolution of our technique to be at least within 320 nm in fluorescence. However, this resolution can be easily increased by coupling fluorescence analysis with a nanometer-resolution technique such as AFM. Furthermore, as this methodology can be applied to various hydrophilic supports, this resolution could be further improved by using high-resolution fluorescence microscopy techniques such as Total Internal Reflection Fluorescence (TIRF), Photoactivated Localization Microscopy (PALM), or Stochastic Optical Reconstruction Microscopy (STORM).45 It is not unreasonable to extrapolate that the fundamental principles outlined in our technique may permit molecular mapping and analysis with sufficient spatial resolution to identify multiple epigenetic marks on a single nucleosome or to distinguish marks on adjacent nucleosomes in native chromatin. Additionally, we could also envision coupling this chromatin array chip with optical tweezers for high-throughput native chromatin assays.
CONCLUSIONS
In summary, we have demonstrated a methodology to stretch and immobilize single native chromatin fragments derived from a mammalian genome, into a beads-on-a-string conformation. Our technique allows controlling the stretching factor of chromatin molecules to prevent stripping of histones from the molecules. We proved the applicability of this method by employing it in the case of two different cancerous cell types (M091 and HeLa). Thus, this procedure could be transposed, by extension, to other mammalian or non mammalian cells of interest (embryonic stem cells, drosophila for example). This ability to controllably pattern large numbers of chromatin molecules over mm2 areas offers the opportunity for parallelized and high-throughput screening with high-resolution capabilities. Therefore, chromatin mapping represents a powerful technique with the potential to serve as the basis of a FISH-like technique providing single molecule maps of multiple epigenetic features and their relation to a specific gene for single cell diagnostics. This technique could be extended to the use of microfluidics for dealing with material extracted from a single cell.19
In addition to research studies, this affordable and fast technique may prove to be especially well-tailored for clinical settings as the procedure is straightforward and does not require complex fabrication or preparation protocols. In the imminent future, the need will arise to investigate the relationships between genetic and epigenetic marks not only within localized regions on the genome, but also among different cell types. This may grant new insight into the relation between chromatin structure and mechanisms of gene regulation during cellular differentiation and development as a means of bringing hope to tomorrow’s medical treatment options and diagnostics.
METHODS
Preparation of biological materials
Chromatin extraction
Acute myelogenous leukemia-derived cells (M091)46 were cultured as a suspension in Dulbecco’s modified Eagle’s medium (DMEM) supplemented with 5% fetal calf serum at a density of 105 cells/ml. HeLa cells were cultured as monolayers in DMEM supplemented with 5% fetal calf serum. HeLa cells were plated at a density of 105 cells per plate. When the cells reached 80–90% confluence, native chromatin fragments were extracted as described.29,47 Micrococcal nuclease (NEB M0247S) digestion times were set to 30 min (2000 gel units) and 5 min (200 gel units) for M091 and HeLa chromatin respectively. Extracted chromatin was resuspended in a final buffer of 10 mM EDTA and 0.5 M NaCl. The resulting fragment size distribution of extracted chromatin was evaluated through an electrophoresis gel (see Supplementary Information, Figure S2).
Extracted chromatin was stained with YOYO-1 (Invitrogen, 100 μM) at a 1:5 dye/base ratio for control experiments.
Antibody labels
Histone H3 monoclonal antibodies (39763) were purchased from Active Motif. Alexa 647 goat anti-mouse secondary antibodies were purchased from Invitrogen. Both primary and secondary antibodies were used at 1:200 dilution.
Histone labeling
2 μg of M091 or HeLa chromatin were separately incubated against histone primary antibodies for 1 hour at room temperature. Secondary antibodies were then added to the solution in equal proportion as primary antibodies and incubated for an additional 30 min at room temperature. The entire solution was then counter-stained with YOYO-1 intercalating dye (Invitrogen) for a minimum of 30 min in the dark at room temperature. Finally, 15 μl of 1X PBS with 0.3% Triton X-100 v/v were added to adjust the contact angle of the solution with respect to the PDMS surface (measured contact angle of 45° in water). The total volume was used for each directed assembly experiment.
Operational procedure
To direct the capillary assembly of digested chromatin, we used PDMS stamps with topographical cavities obtained from the replication of a positive silicon master. Conventional photolithographic techniques (proximity UV lithography) and reactive ion etching (RIE) were used to fabricate a silicon master with the negative of the final desired micropatterns. The design consists in arrays of 5 μm and 8 μm in diameter, 5 μm high protruding features, with different periodicities (15 μm, 20 μm). The PDMS prepolymer solution containing a mixture of 10:1 mass ratio of PDMS oligomers and reticular agent from Sylgard 184 Kit (Dow Corning, Wilmington, DE) was then moulded against the silicon master. An anti-adhesive treatment of the master was priorly carried out using silanization in liquid phase with octadecyltricholorosilane (OTS) in order to enable easy demoulding of the polymer replica after thermal curing. PDMS was cured at a temperature of 80°C for 2 hours. Once demoulded, the PDMS substrate was carefully cut into 1.8 cm × 1.4 cm stamps. Next, to conduct the directed capillary assembly, we use a dedicated setup. The resulting PDMS stamp where we want the chromatin fragments to be assembled is placed on a motorized translation stage below a fixed glass spreader at a distance of about 1 mm. The experiment is conducted at ambient temperature. The chromatin solution is injected between the glass and the substrate, and the liquid contact line is then moved over the substrate at a finely adjusted and constant velocity of 20 μm/sec for the trapped chromatin fragments to be carefully trapped and stretched. The main parameters governing this process are the molecular concentration, the velocity of the translation stage, the contact angle at the liquid/substrate/vapor interface, and the evaporation rate of the solvent. In this physical process, the microwell acts as a wetting defect that temporarily pins the moving contact line. During this pinning time, the convective flux of molecules in solution nourishes the interface, the contact angle of the liquid front line locally decreases, and the assembly takes place selectively by capillarity at each well. Under stretching of the meniscus due to the motion of the stage, some elastic energy is stored. When this energy exceeds the pinning energy, the front line abruptly disrupts, simultaneously stretching the trapped molecules and fixing them in that position. The assembly is performed throughout the entire surface of the PDMS stamp of an approximate 1 cm2 area (see Supplementary Information sections S1 and S4). To transfer the formed chromatin arrays onto the analysis support, the PDMS stamp with assembled chromatin fragments is brought into contact with a (3-Aminopropyl)triethoxysilane (APTES)-coated cover slip for 2 min and then peeled away (Figure 1). The chromatin array transfers were characterized under an inverted epifluorescence microscope (x100 oil immersion objective) from Olympus coupled to a 512 × 512 CCD camera (Photometrics). The samples were imaged under illumination at 475 nm (em. 535 nm), nm and 620 nm (em. 700 nm) accordingly with no detectable cross-excitation at any of the emission wavelengths. Images were combined using ImageJ software.
AFM Imaging
AFM images of chromatin arrays on APTES-coated glass slides were obtained on a NanoScope IIIa (Digital Instruments) in tapping mode operated in air.
Supplementary Material
Acknowledgments
The work described was supported, in part, by the Cornell Center on the Microenvironment & Metastasis, a Physical Science Oncology Center supported by Award Number CA143876 from the National Cancer Institute and supported in part by National Institutes of Health grant DA025722. We thank Prof. P. Soloway and his research group, in particular P. J. Murphy, for their help in performing the chromatin extraction. We thank Prof. J. Scandura for providing the M091 cells.
Footnotes
Supporting Information Available: Electrophoresis gels and control experiments were included as supporting information, along with videos taken from samples, and fluorescence and AFM images obtained with chromatin extracted from HeLa cells. This material is available free of charge via the Internet at http://pubs.acs.org.
References
- 1.Barski A, Cuddapah S, Cui K, Roh TY, Schones DE, Wang Z, Wei G, Chepelev I, Zhao K. High-Resolution Profiling of Histone Methylations in the Human Genome. Cell. 2007;129:823–837. doi: 10.1016/j.cell.2007.05.009. [DOI] [PubMed] [Google Scholar]
- 2.Bernstein BE, Meissner A, Lander ES. The Mammalian Epigenome. Cell. 2007;128:669–681. doi: 10.1016/j.cell.2007.01.033. [DOI] [PubMed] [Google Scholar]
- 3.Bianchi-Frias D, Orian A, Delrow JJ, Vazquez J, Rosales-Nieves AE, Parkhurst SM. Hairy Transcriptional Repression Targets and Cofactor Recruitment in Drosophila. PLoS Biology. 2004;2:975–990. doi: 10.1371/journal.pbio.0020178. [DOI] [PMC free article] [PubMed] [Google Scholar]
- 4.Buck MJ, Lieb JD. ChIP-chip: Considerations for the Design, Analysis, and Application of Genome-Wide Chromatin Immunoprecipitation Experiments. Genomics. 2004;83:349–360. doi: 10.1016/j.ygeno.2003.11.004. [DOI] [PubMed] [Google Scholar]
- 5.Heng HHQ, Squire J, Tsui LC. High-Resolution Mapping of Mammalian Genes by In Situ Hybridization to Free Chromatin. PNAS. 1992;89:9509–9513. doi: 10.1073/pnas.89.20.9509. [DOI] [PMC free article] [PubMed] [Google Scholar]
- 6.Smith SB, Finzi L, Bustamante C. Direct Mechanical Measurements of the Elasticity of Single DNA Molecules by Using Magnetic Beads. Science. 1992;258:1122–1126. doi: 10.1126/science.1439819. [DOI] [PubMed] [Google Scholar]
- 7.Smith SB, Cui YJ, Bustamante C. Overstretching B-DNA: the Elastic Response of Individual Double-Stranded and Single-Stranded DNA Molecules. Science. 1996;271:795–799. doi: 10.1126/science.271.5250.795. [DOI] [PubMed] [Google Scholar]
- 8.Cerf A, Cipriany BR, Benítez JJ, Craighead HG. Single Molecule Patterning for High-Throughput Epigenetic Mapping. Anal Chem. 2011;83:8073–8077. doi: 10.1021/ac202506j. [DOI] [PMC free article] [PubMed] [Google Scholar]
- 9.Gad M, Sugiyama S, Ohtani T. Method for Patterning Stretched DNA Molecules on Mica Surfaces by Soft Lithography. J Biomol Struct Dyn. 2003;2:387–393. doi: 10.1080/07391102.2003.10506934. [DOI] [PubMed] [Google Scholar]
- 10.Björk P, Holmström S, Inganäs O. Soft Lithographic Printing of Patterns of Stretched DNA and DNA/Electronic Polymer Wires by Surface-Energy Modification and Transfer. Small. 2006;8–9:1068–1074. doi: 10.1002/smll.200600126. [DOI] [PubMed] [Google Scholar]
- 11.Nakao H, Shiigi H, Yamamoto Y, Tokonami S, Nagaoka T, Sugiyama S, Ohtani T. Highly Ordered Assemblies of Au Nanoparticles Organized on DNA. Nano Lett. 2003;3:1391–1394. [Google Scholar]
- 12.Nakao H, Gad M, Sugiyama S, Otobe K, Ohtani T. Transfer-Printing of Highly Aligned DNA Nanowires. JACS. 2003;125:7162–7163. doi: 10.1021/ja034185w. [DOI] [PubMed] [Google Scholar]
- 13.Guan J, Lee LJ. Generating Highly Ordered DNA Nanostrand Arrays. PNAS. 2005;102:18321–18325. doi: 10.1073/pnas.0506902102. [DOI] [PMC free article] [PubMed] [Google Scholar]
- 14.Bensimon A, Simon A, Chiffaudel A, Croquette V, Heslot F, Bensimon D. Alignment and Sensitive Detection of DNA by a Moving Interface. Science. 1994;265:2096–2098. doi: 10.1126/science.7522347. [DOI] [PubMed] [Google Scholar]
- 15.Greene EC, Wind S, Fazio T, Gorman J, Visnapuu ML. DNA Curtains for High-Throughput Single-Molecule Optical Imaging. Methods Enzymol. 2010;472:293–315. doi: 10.1016/S0076-6879(10)72006-1. [DOI] [PMC free article] [PubMed] [Google Scholar]
- 16.Perkins TT, Smith DE, Larson RG, Chu S. Stretching of a Single Tethered Polymer in a Uniform Flow. Science. 1995;268:83–87. doi: 10.1126/science.7701345. [DOI] [PubMed] [Google Scholar]
- 17.Tegenfeldt JO, Bakajin O, Chou CF, Chan SS, Austin RH, Fann W, Liou L, Chan E, Duke T, Cox EC. Near-Field Scanner for Moving Molecules. Phys Rev Lett. 2001;86:1378–1381. doi: 10.1103/PhysRevLett.86.1378. [DOI] [PubMed] [Google Scholar]
- 18.Smith DE, Babcock HP, Chu S. Single-Polymer Dynamics in Steady Shear Flow. Science. 1999;283:1724–1727. doi: 10.1126/science.283.5408.1724. [DOI] [PubMed] [Google Scholar]
- 19.Wang X, Takebayashi S, Bernardin E, Gilbert DM, Chella R, Guan J. Microfluidic Extraction and Stretching of Chromosomal DNA from Single Cell Nuclei for DNA Fluorescence In Situ Hybridization. Biomed Microdevices. 2012 doi: 10.1007/s10544-011-9621-8. in press. [DOI] [PMC free article] [PubMed] [Google Scholar]
- 20.Tegenfeldt JO, Prinz C, Cao H, Chou S, Reisner WW, Riehn R, Wang YM, Cox EC, Sturm JC, Silberzan P, et al. The Dynamics of Genomic-Length DNA Molecules in 100-nm Channels. PNAS. 2004;101:10979–10983. doi: 10.1073/pnas.0403849101. [DOI] [PMC free article] [PubMed] [Google Scholar]
- 21.Reccius CH, Stavis SM, Mannion JT, Walker LP, Craighead HG. Conformation, Length, and Speed Measurements of Electrodynamically Stretched DNA in Nanochannels. Biophys J. 2008;95:273–286. doi: 10.1529/biophysj.107.121020. [DOI] [PMC free article] [PubMed] [Google Scholar]
- 22.Cui Y, Bustamante C. Pulling a Single Chromatin Fiber Reveals the Forces that Maintain its Higher-Order Structure. PNAS. 2000;97:127–132. doi: 10.1073/pnas.97.1.127. [DOI] [PMC free article] [PubMed] [Google Scholar]
- 23.Bennink ML, Leuba SH, Leno GH, Zlatanova J, de Grooth BG, Greve J. Unfolding Individual Nucleosomes by Stretching Single Chromatin Fibers with Optical Tweezers. Nat Struct Biol. 2001;8:606–610. doi: 10.1038/89646. [DOI] [PubMed] [Google Scholar]
- 24.Leuba SH, Karymov MA, Tomschik M, Ramjit R, Smith P, Zlatanova J. Assembly of Single Chromatin Fibers Depends on the Tension in the DNA Molecule: Magnetic Tweezers Study. PNAS. 2003;100:495–500. doi: 10.1073/pnas.0136890100. [DOI] [PMC free article] [PubMed] [Google Scholar]
- 25.Brower-Toland BD, Smith CL, Yeh RC, Lis JT, Peterson CL, Wang MD. Mechanical Disruption of Individual Nucleosomes Reveals a Reversible Multistage Release of DNA. PNAS. 2002;99:1960–1965. doi: 10.1073/pnas.022638399. [DOI] [PMC free article] [PubMed] [Google Scholar]
- 26.Gorman J, Plys AJ, Visnapuu ML, Alani E, Greene EC. Visualizing One-Dimensional Diffusion of Eukaryotic DNA Repair Factors Along a Chromatin Lattice. Nat Struct Mol Biol. 2010;17:932–938. doi: 10.1038/nsmb.1858. [DOI] [PMC free article] [PubMed] [Google Scholar]
- 27.Bancaud A, Conde e Silva N, Barbi M, Wagner G, Allemand JF, Mozziconacci J, Lavelle C, Croquette V, Victor JM, Prunell A, et al. Structural Plasticity of Single Chromatin Fibers Revealed by Torsional Manipulation. Nat Struct Mol Biol. 2006;13:444–450. doi: 10.1038/nsmb1087. [DOI] [PubMed] [Google Scholar]
- 28.Streng DE, Lim SF, Pan J, Karpusenka A, Riehn R. Stretching Chromatin Through Confinement. Lab on a Chip. 2009;9:2772–2774. doi: 10.1039/b909217j. [DOI] [PMC free article] [PubMed] [Google Scholar]
- 29.Cipriany BR, Zhao R, Murphy PJ, Levy SL, Tan CP, Craighead HG, Soloway PD. Single Molecule Epigenetic Analysis in a Nanofluidic Channel. Anal Chem. 2010;82:2480–2487. doi: 10.1021/ac9028642. [DOI] [PMC free article] [PubMed] [Google Scholar]
- 30.Ersfeld K. Fiber-FISH: Fluorescence In Situ Hybridization on Stretched DNA. Meth in Mol Biol. 2004;270:395–402. doi: 10.1385/1-59259-793-9:395. [DOI] [PubMed] [Google Scholar]
- 31.Sims JK, Houston SI, Magazinnik T, Rice JC. A Trans-Tail Histone Code Defined by Monomethylated H4 Lys-20 and H3 Lys-9 Demarcates Distinct Regions of Silent Chromatin. J Biol Chem. 2006;281:12760–12766. doi: 10.1074/jbc.M513462200. [DOI] [PubMed] [Google Scholar]
- 32.Blower MD, Sullivan BA, Karpen GH. Conserved Organization of Centromeric Chromatin in Flies and Humans. Dev Cell. 2002;2:319–330. doi: 10.1016/s1534-5807(02)00135-1. [DOI] [PMC free article] [PubMed] [Google Scholar]
- 33.Lam AL, Boivin CD, Bonney CF, Rudd MK, Sullivan BA. Human Centromeric Chromatin is a Dynamic Chromosomal Domain that Can Spread Over Noncentromeric DNA. PNAS. 2006;103:4186–4191. doi: 10.1073/pnas.0507947103. [DOI] [PMC free article] [PubMed] [Google Scholar]
- 34.Sullivan BA, Karpen GH. Centromeric Chromatin Exhibits a Histone Modification Pattern that is Distinct from Both Euchromatin and Heterochromatin. Nat Struct Mol Biol. 2004;11:1076–1083. doi: 10.1038/nsmb845. [DOI] [PMC free article] [PubMed] [Google Scholar]
- 35.Cohen SM, Chastain PD, II, Cordeiro-Stone M, Kaufman DG. DNA Replication and the GINS Complex: Localization on Extended Chromatin Fibers. Epigenetics & Chromatin. 2009;2:6. doi: 10.1186/1756-8935-2-6. [DOI] [PMC free article] [PubMed] [Google Scholar]
- 36.Daban JR. Electron Microscopy and Atomic Force Microscopy Studies of Chromatin and Metaphase Chromosome Structure. Micron. 2011;42:733–750. doi: 10.1016/j.micron.2011.05.002. [DOI] [PubMed] [Google Scholar]
- 37.Lyubchenko YL, Shlyakhtenko LS. AFM for Analysis of Structure and Dynamics of DNA and Protein-DNA Complexes. Methods. 2009;47:206–213. doi: 10.1016/j.ymeth.2008.09.002. [DOI] [PMC free article] [PubMed] [Google Scholar]
- 38.Kobayashi M, Sumitomo K, Torimitsu K. Real-Time Imaging of DNA-Streptavidin Complex Formation in Solution Using a High-Speed Atomic Force Microscope. Ultramicroscopy. 2007;107:184–190. doi: 10.1016/j.ultramic.2006.07.008. [DOI] [PubMed] [Google Scholar]
- 39.Ando T, Uchihashi T, Kodera N, Yamamoto D, Miyagi A, Taniguchi M, Yamashita H. High-Speed AFM and Nano-Visualization of Biomolecular Processes. Pflugers Arch. 2008;456:211–225. doi: 10.1007/s00424-007-0406-0. [DOI] [PubMed] [Google Scholar]
- 40.Cerf A, Dollat X, Chalmeau J, Coutable A, Vieu C. A Versatile Method for Generating Single DNA Molecule Patterns: Through the Combination of Directed Capillary Assembly and (Micro/Nano) Contact Printing. J Mater Res. 2010;26:336–346. [Google Scholar]
- 41.Luger K, Mader AW, Richmond RK, Sargent DF, Richmond TJ. Crystal Structure of the Nuclesome Core Particle at 2.8 A Resolution. Nature. 1997;389:251–260. doi: 10.1038/38444. [DOI] [PubMed] [Google Scholar]
- 42.Bensimon D, Simon AJ, Croquette V, Bensimon A. Stretching DNA with a Receding Meniscus: Experiments and Models. Phys Rev Lett. 1995;74:4754–4757. doi: 10.1103/PhysRevLett.74.4754. [DOI] [PubMed] [Google Scholar]
- 43.Malaquin L, Kraus T, Schmid H, Delamarche E, Wolf H. Controlled Particle Placement Through Convective and Capillary Assembly. Langmuir. 2007;23:11513–11521. doi: 10.1021/la700852c. [DOI] [PubMed] [Google Scholar]
- 44.Bustamante C, Smith SB, Liphardt J, Smith D. Single-Molecule Studies of DNA Mechanics. Curr Op Struct Biol. 2000;10:279–285. doi: 10.1016/s0959-440x(00)00085-3. [DOI] [PubMed] [Google Scholar]
- 45.Flors C, Earnshaw WC. Super-Resolution Fluorescence Microscopy As a Tool to Study the Nanoscale Organization of Chromosomes. Current Op Chem Biol. 2011;15:1–7. doi: 10.1016/j.cbpa.2011.10.004. [DOI] [PubMed] [Google Scholar]
- 46.Scandura JM, Boccuni P, Massagué J, Nimer SD. Transforming Growth Factor β-Induced Cell Cycle Arrest of Human Hematopoietic Cells Requires p57KIP2 Up-Regulation. PNAS. 2004;101:15231–15236. doi: 10.1073/pnas.0406771101. [DOI] [PMC free article] [PubMed] [Google Scholar]
- 47.Kornberg RD, Lapointe JW, Lorch Y. Preparation of Nucleosomes and Chromatin. Meth in Enzymol. 1989;170:3–14. doi: 10.1016/0076-6879(89)70039-2. [DOI] [PubMed] [Google Scholar]
Associated Data
This section collects any data citations, data availability statements, or supplementary materials included in this article.