

Abstract
Background
The characteristics of blood recipients including diagnoses associated with transfusion and post-transfusion survival are unreported in Brazil. The goals of this analysis were: 1) to describe blood utilization according to clinical diagnoses and patient characteristics at a large public hospital, Hospital das Clinicas (HC), a tertiary teaching hospital and trauma center in the city of Sao Paulo; 2) to determine the factors associated with survival of blood recipients.
Methods
A retrospective cross-sectional analysis was conducted on all inpatients in 2004. Data came from three sources were merged: HC electronic admission files, blood issue files, and the national death registry. The first two files consist of data about patient characteristics, clinical diagnosis, and transfusion information. Analyses comparing transfused and non-transfused patients were conducted. The third file was used to determine survival status of recipients up to three years after last transfusion. Logistic regression was conducted among transfused patients to examine survival curves and characteristics associated with follow up patient survival.
Results
In 2004, 30,779 patients were admitted to HC, with 3,835 (12.4%) transfused. These patients had 10,479 transfusions episodes, consisting of 39,561 transfused components; 16,748 (42%) red cells, 15,828 (40%) platelets and 6,190 (16%) plasma. The median number of components transfused was 3 (range 1 – 656) per patient admission. Mortality during hospitalization was dramatically different for patients whose admissions included transfusion or not (24% vs. 4%). After 1 year, 56% of transfusion recipients were alive. The multivariable model of factors associated with mortality following transfusion showed that the most significant factors in descending order were hospital ward, increasing age, increasing number of components transfused, and type of components received.
Conclusion
Ward and transfusion are markers of underlying medical conditions and are associated with the probability of survival. Platelet transfusions are common and likely reflect the types of patients treated at HC. This comprehensive blood utilization study, first of its kind in Brazil can help in developing transfusion policy analyses in South America.
Introduction
The use of blood transfusion therapies may vary according to medical practice traditions within and between countries and over time, particularly as blood availability, component therapy, and transfusion management practices evolve. Data on the adequacy of the supply, reasons for transfusion, and recipient epidemiology and outcomes are important for blood banks worldwide. Utilization comparisons can help identify differences between countries and perhaps inform assessments of best practices based on recipient outcomes in defined patient categories. Efforts to better understand blood utilization through descriptive epidemiology studies in different countries have been reported1–10 but there is a paucity of comprehensive data regarding blood utilization in South America. A study of transfusion triggers based on hemoglobin level and blood component use in cardiac patients has been reported from the Heart Institute in São Paulo11 and another study of liver transplantation described survival rates for patients requiring massive intraoperative transfusion12 in Campinas, São Paulo State. Brazil has a population of about 190 million.14 The annual allogeneic blood collection total is 4,002,417 units15 or 21 blood donations per 1000 inhabitants.14 To improve transfusion practice and security, in 2000 the Brazilian government released specific regulations requiring traceability of blood from donor to recipient.16, 17 In Brazil, it is mandatory that a formal allogeneic transfusion request be made by a physician and submitted to the blood center. Federal Regulation also requires processes to identify blood recipients and to monitor blood and blood component use in all health care institutions in the country.17 These regulations also include a hemovigilance system that requires notification of unexpected adverse effects of blood transfusion and measures to protect recipients16, 17. Although these regulations exist, there are few published data describing the use of blood in Brazil.18–20 Our goals in this study are to describe the blood utilization patterns and recipient survival at the Central Institute at Hospital das Clinicas in São Paulo.
Materials and Methods
Setting
The São Paulo metropolitan area has a population of 17 million.21 The main tertiary care public and teaching facility is located in a hospital complex called Hospital das Clinicas (HC). It is also a major hospital for trauma care in the western region of the greater City of São Paulo. All blood used at this institution is provided by Fundação Pró-Sangue/Hemocentro de São Paulo (FPS/HSP). Forty-six percent of blood collected by FPS/HSP is used within Hospital das Clinicas. The overall complex includes the following institutes: Central Institute, Heart Institute, Trauma and Orthopedics Institute, and Children’s Hospital. For this study, we analyzed the blood utilization at the Central Institute which is the primary hospital for the majority of medical specialties: Surgery (General, Digestive System, Liver, Head and Neck, Thoracic, Vascular), Medicine (Hematology [including oncology-hematology], Endocrinology, Pulmonology, Nephrology, Allergy and Immunology, Rheumatology, Gastroenterology and Geriatrics), Clinical and Surgical Neurology, Urology, Gynecology, Obstetrics, Dermatology, Plastic Surgery and Burns, Endoscopy, Infectious and Parasitic Diseases. The Central Institute also includes a general Emergency Room, an Adult Intensive Care Unit (ICU) and a Neonatal Intensive Care Unit (NICU). Subjects included in this study represent the patient population of Sao Paulo, Brazil. The blood recipient population includes both transfusion naïve and those who have had previous allogeneic and or autologous blood transfusion before 2004.
Sources of data for this study
To create the analytical dataset, data from three sources were merged for this retrospective cross-sectional study. The first source was electronic hospital records for all patients, whether transfused or not, who were admitted to HC in 2004. Each patient receives a unique hospital identification (ID) number at first admission that is then used for all future medical care at HC. From the HC Central Institute medical records database, the following data elements were captured: patient name, mother’s name, patient’s date of birth, hospital ID number, age, gender, diagnosis codes, clinic or ward, date of death, and date patient was last seen in the hospital alive (discharge date). The second source was transfusion information from FPS/HSP for all patients who received allogeneic transfusion at HC in 2004. All transfusion services in Brazil must have computerized information systems (CIS), where blood and components are registered.13 From the FPS/HSP CIS we captured the following data: blood or component type (red cells, platelets, plasma, fresh frozen plasma), number of components, transfusion date(s), clinic or ward name, recipient name, hospital ID number, gender, date of birth. Since the total number of transfused whole blood units was very low (n = 5, < 0.1%), we excluded them from the analysis. FPS/HSP collects platelets by single donor aphaeresis and from whole blood donations (pool of 5 to 7 donations). The majority of platelets transfused in 2004 were from pooled donations. For the purpose of this study we have counted each preparation transfused as a single unit whether it consisted of whole blood derived platelets or aphaeresis platelets and also in the case where multiple donations are pooled to form one unit of cryoprecipitate. Third, death certificate/registry data obtained from a computerized information system equivalent to the US National Death Index, (SIM Version April 19th 2007) was provided by the Brazil Ministry of Health. This database contained information on all deaths and causes of deaths in the country during the years 2004 through 2006. A post-discharge survival status dataset was developed using death certificate data in 2004 through 2006 for all persons transfused in 2004. This search was performed using Soundex for Portuguese phonetics (Record Linkage III – Version 3.0.4 4005). Patient’s name, mother’s name and patient’s date of birth were used to identify deaths that occurred after discharge. Based on a validation study, the sensitivity and specificity of the method used to determine cause of death are 93.9% (CI 95% 89.6 - 96.8%) and 91% (CI 95% 86.2 – 94.6%), respectively24. A mortality file was constructed that included the date and cause of death and the patient’s hospital ID number. The mortality file was subsequently merged with HC and FPS/HSP data using hospital ID, and date of birth.
Statistical analysis
The initial analysis compared the characteristics of transfused and non-transfused patients at HC to establish similarities and differences between these two patient populations. Descriptive analyses were conducted for demographic and clinical variables, transfusion status, the type and number of components transfused, as well as survival status at 24 hours after transfusion, and at hospital discharge for each admission, and at 1 year following discharge. A transfusion episode was defined as any blood component transfused on a specific calendar day. Patients were categorized into one of 21 (I-XXI) International Classification of Diseases-ICD-10 chapters according to the main discharge diagnosis ICD-10 code (www.who.int).22, 23 Wards at HC were grouped into six broadly encompassing areas: Emergency Room (ER), General Admission (GA); Intensive Care Unit (ICU), Operation Room (OR), Nursery, and Nursery Intensive Care Unit (NICU). We defined the following age groups: 0–14; 15–34; 35–44; 45–54; 55–74 and > 75 years old. Of note, the pediatric population was not further stratified due to the limitation in the number of patients captured in our database because the Central Institute does not include the Children’s Hospital where the majority of pediatric transfusions occur.
For transfused patients three levels of analyses were conducted – admission level, patient level, and component level. We report analysis results at admission level unless otherwise noted. Since a patient might have multiple admissions and multiple transfusions for different principal diagnoses, Kaplan-Meier analysis was conducted on survival time in days after patients’ last transfusion by age, gender, and ward separately to generate the survival curves by each variable. The number and type of blood components transfused during each admission were tabulated by ward, age, and gender. Finally, logistic regression analyses were conducted to identify factors associated with in-hospital mortality. Predictors included in the logistic regression analysis were age, gender, ward, total number of components transfused and type of transfused components during the last transfusion. Results are reported as adjusted odds ratios (AORs) and 95% confidence intervals (95% CIs). A p-value less than 0.05 was considered statistically significant. All analyses were conducted using SAS Windows Version 9.1.3 (SAS Institute, Cary, NC). Ethical Committee and IRB approvals to conduct this study were obtained in both Brazil and the USA.
Results
During 2004, there were 38,831 admissions of 30,779 unique patients to the Central Institute at HC, of which 3,835 patients (12.5%) were transfused. The patients with and without (n = 26,944) transfusion episodes had 4,330 (11.1%) and 34,501 (88.9%) of hospital admissions, respectively (Figure 1). The average number of admissions per patient was similar between the transfused (n = 1.13) and non-transfused patients (n = 1.12), but the length of stay was much longer for transfused patients (median: 13 vs. 3 days) (Table 1). More females than males (55% vs. 45%) were admitted, yet more males than females (13.2% vs. 9.4%) were transfused during admission.
Figure 1.
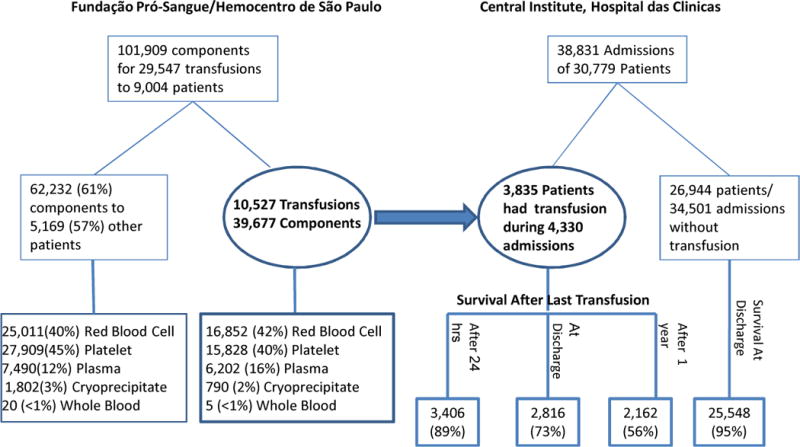
Summary of Patients/Admissions at Central Institute, Hospital das Clinicas in Sao Paulo and Transfused Components Issued by Fundação Pró-Sangue/Hemocentro de São Paulo in 2004
Table 1.
Demographic characteristics, ward, principal diagnoses, and survival status of transfused and non-transfused patients for all admissions at Central Institute in Hospital das Clinicas, Sao Paulo, Brazil, 2004 (n = 38,831).
| Variable | Transfused n = 4,330 (11%) |
Non Transfused n = 34,501 (89%) |
|---|---|---|
|
| ||
| Gender | ||
| Male | 2,329 (54) | 15,284 (44) |
| Female | 2,001 (46) | 19,180 (56) |
|
| ||
| Age | ||
| 0–14 | 247 (5.7) | 3,736 (11) |
| 15–34 | 822 (19) | 9,214 (27) |
| 35–44 | 552 (13) | 4,861 (14) |
| 45–54 | 769 (18) | 5,109 (15) |
| 55–74 | 1,394 (32) | 8,017 (23) |
| > 75 | 483 (11) | 2,519 (7) |
|
| ||
| Ward | ||
| Emergency room | 1,422 (33) | 8,588 (25) |
| General Admission | 1,455 (34) | 19,701 (57) |
| Adult Intensive Care Unit | 722 (17) | 572 (2) |
| Operation Room | 596 (14) | 3,447 (10) |
| Nursery | 104 (2) | 2,069 (6) |
| Neonatal Intensive Care Unit | 31 (< 1) | 46 (< 1) |
|
| ||
| Principal Diagnoses (ICD-10) | ||
| Neoplasm | 1,188 (28) | 4,770 (14) |
| Diseases of the digestive system | 623 (15) | 3,751 (11) |
| Diseases of the circulatory system | 441 (10) | 2,034 (6) |
| Injury, poisoning and other external causes | 411 (10) | 2,089 (6) |
| Diseases of the genitourinary system | 277 (7) | 2,871 (8) |
| Infectious and parasitic diseases | 272 (6) | 1,121 (3) |
| Diseases of the respiratory system | 249 (6) | 2,312 (7) |
| Diseases of the blood, organs and immune | 188 (4) | 287 (1) |
| Conditions originating in the perinatal period | 113 (3) | 1,855 (5) |
| Pregnancy, childbirth and the puerperium | 77 (2) | 3,354 (10) |
| Symptoms/signs/abnormal findings, not elsewhere classified | 96 (2) | 818 (2) |
| Disease of the eye and adnexa | 2 (< 1) | 2,148 (6) |
| Other | 294 (7) | 6,621 (2) |
|
| ||
| Survival Status at Discharge | ||
| Alive | 3,311 (76) | 33,004 (96) |
| Deceased | 1,019 (24) | 1,497 (4) |
|
| ||
| Length of Stay in Days | ||
| Median (Range) | 13 (0–278) | 3 (0–280) |
One patient might have multiple admissions during which a transfusion occurred.
Totals do not always add up to 100% due to missing data.
Distributions of primary diagnoses were different between transfused and non-transfused patients. The most prevalent diagnoses for transfused patients were neoplasm (28%), followed by diseases of the digestive system (15%), diseases of the circulatory system (10%), and then injury, poisoning and other external causes (10%). Among admissions of patients without transfusions, the most prevalent diagnoses were neoplasm (14%), diseases of the digestive system (11%), and pregnancy, childbirth and the puerperium (10%). Mortality rates during hospitalization were dramatically different between transfused and non-transfused patients (24% vs. 4%, respectively).
In 2004, FPS/HSP issued 101,909 blood components for 29,547 transfusions for all hospitals FPS/HSP serves. The transfused patients at the Central Institute comprised 42.6% of all patients (n = 9,004) who received blood from FPS/HSP (Figure 1). Patients included in this study received 39,677 components during 10,527 transfusion episodes in which 16,852 (42%) red cells, 15,828 (40%) platelets, 6,202 (16%) plasma, and 790 (2%) cryoprecipitate units were transfused. Regarding the frequency of transfusion, 54% of the transfused patients had one transfusion episode, 20% had 2 episodes, and 22.5% had 3 to 10 transfusion episodes in the year. The median number of components transfused was 3 (range 1 – 656) per patient admission. The mean age at transfusion was 49 years. Overall, 56% of the transfused patients were under the age of 55 years. About 11% of transfused patients were > 75 years old, while 5.7% patients were under the age of 15 years.
The proportion of all patients transfused varied according to ward, patients were more likely to be transfused in GA wards (34%) or ER (33%), followed by ICU (17%), OR (14%), Nursery (2%), and NICU (< 1%). The proportion of all non-transfused patients in HC was 57% GA, 25% ER, 10% OR, 6% Nursery, 2% ICU and < 1% NICU (Table 1), showing that patients in ICU or OR were more likely to be transfused.
Component Use by Gender, Age, and Ward
Blood transfusion varied significantly by gender, age, and ward (Table 2). Males received 62% of all blood components. The proportions of red cells, platelets and plasma transfused by gender were similar to the overall summary. However, females received more cryoprecipitate than males (68% vs. 32%). Patients under the age of 45 years received 69% of all components, including 59% of red cells, 81% of platelets, 65% of plasma, and 90% of cryoprecipitate.
Table 2.
Number (%) of transfused blood components by blood component type, gender, ward, and age during all admissions with transfusion at Central Institute, Sao Paulo, Brazil, 2004.
| Red cells | Platelets | Plasma | Cryoprecipitate | Total | |
|---|---|---|---|---|---|
| Gender | |||||
| Female | 6,939 (41) | 5,070 (32) | 2,338 (38) | 538 (68) | 14,885 (38) |
| Male | 9,913 (59) | 10,758(68) | 3,864 (62) | 252 (32) | 24,787(62) |
| Age category | |||||
| 0–14 | 831 (5) | 1,213 (8) | 345 (6) | 32 (4) | 2,421 (6) |
| 15–34 | 3,890 (23) | 7,124 (45) | 1,617 (26) | 573 (73) | 13,204 (33) |
| 35–44 | 2,169 (13) | 2,043 (13) | 863 (14) | 42 (5) | 5,117 (13) |
| 45–54 | 3,055 (18) | 2,401 (15) | 1,186 (19) | 61 (8) | 6,703 (17) |
| 55–74 | 5,177 (31) | 2,717 (17) | 1,701 (27) | 82 (10) | 9,677 (25) |
| 75 and above | 1,626 (10) | 330 (2) | 478 (8) | 0 (0) | 2,434 (6) |
| Ward | |||||
| Emergency Room | 4,536 (27) | 1,170 (7) | 1,491 (24) | 17 (2) | 7,214 (18) |
| General Admission | 4,846 (29) | 4,935 (31) | 1,237 (20) | 535 (68) | 11,553 (29) |
| Intensive Care Unit | 5,034 (30) | 9,113 (58) | 2,975 (48) | 208 (26) | 17,330 (44) |
| Operating Room | 2,131 (13) | 425 (3) | 471 (8) | 29 (4) | 3,056 (8) |
| Nursery | 214 (1) | 107 (< 1) | 20 (< 1) | 1 (< 1) | 342 (1) |
| Neonatal Intensive Care Unit | 91 (< 1) | 78 (< 1) | 8 (< 1) | 0 (0) | 177 (< 1) |
| Total | 16,852 (42) | 15,828 (40) | 6,202 (16) | 790 (2) | 39,672 (100) |
Not all totals add up to 100% due to missing data.
Blood component use varied according to ward. ICU patients received 44% of all transfused components, followed by 29% in the GA wards, 18% in the ER, and relatively fewer components, 8%, in the OR. ICU, GA, and ER had the highest use of red cell transfusion (30%, 29%, and 27% of all admissions, respectively). Fifty-eight percent of 15,828 platelets were transfused in the ICU and 31% in the GA wards, whereas 48% of plasma components were transfused in the ICU, 24% in the ER, and 20% in the GA wards. Sixty-eight percent of cryoprecipitate was used in GA wards and 26% in the ICU.
Principal Diagnoses and Component Use
Transfusion of platelets was most common for Neoplasms with 31% of patients with Neoplasms receiving them. The second reason was blood diseases (14%), followed by respiratory diseases (13.4%). The fourth reason was infectious and parasitic infections, accounting for 13% of platelets consumption. (Appendix Table 1 provides additional information on blood component use by ICD-10 code). Neoplasms were also ranked as the primary diagnosis associated with red cell transfusion (25%) followed by digestive diseases (14%); injury, poisoning and other external causes (12%), and infectious and parasitic diseases (10%). Plasma was transfused most frequently to patients with digestive diseases (25%), followed by infectious and parasitic diseases (15%) and neoplasms (13%).
Appendix Table 1.
Blood component consumption (%) by ICD-10 and gender at Central Institute-HC, Sao Paulo, Brazil-2004.
| ICD-10 | Red Cells % | Platelets | Plasma | Cryoprecipitate | ||||||||
|---|---|---|---|---|---|---|---|---|---|---|---|---|
| Female | Male | Total | Female | Male | Total | Female | Male | Total | Female | Male | Total | |
| Neoplasm | 25.6 | 24.4 | 24.9 | 27.9 | 32 | 30.7 | 14.9 | 12.2 | 13.2 | 1.7 | 31 | 11 |
| Disease of Digestive System | 12.5 | 15.4 | 14.2 | 8.4 | 8 | 8.1 | 15.1 | 30.2 | 24.5 | 4.3 | 11.9 | 6.7 |
| Infectious and Parasitic Diseases | 9.8 | 9.2 | 9.5 | 16.2 | 11.4 | 13 | 15.7 | 14 | 14.6 | 7.3 | 2.4 | 5.7 |
| Disease of Circulatory System | 9.1 | 7.8 | 8.4 | 2.2 | 1.9 | 2 | 7.6 | 7.9 | 7.8 | 0 | 7.9 | 2.5 |
| Injury, Poisoning and External Causes | 8.1 | 14.3 | 11.8 | 0.9 | 6.2 | 4.5 | 5.8 | 7 | 6.5 | – | – | – |
| Disease of the Genitourinary System | 6.9 | 5.1 | 5.8 | 2.4 | 1.2 | 1.5 | 6.9 | 4.5 | 5.4 | 4.8 | 13.1 | 7.5 |
| Disease Of Respiratory System | 6.9 | 6.7 | 6.8 | 11.9 | 14.2 | 13.4 | 6.8 | 11.8 | 9.9 | 0 | 9.5 | 3 |
| Disease of the Blood, Organs | 5.8 | 4.2 | 4.8 | 17.3 | 12.6 | 14.1 | 3.4 | 4.2 | 3.9 | 2.8 | 19.8 | 8.2 |
| Pregnancy and Puerperium | 2.8 | 0 | 1.1 | 0.9 | 0 | 0.3 | 0.9 | 0 | 0.3 | 0.6 | 0 | 0.4 |
| Symptoms/Signs Not Elsewhere classified | 2.4 | 2.1 | 2.2 | 4.6 | 1.0 | 2.2 | 3.2 | 3.3 | 3.3 | – | – | – |
| Condition in the Perinatal Period | 2.0 | 1.2 | 1.5 | 1.7 | 0.7 | 1 | 0.3 | 0.3 | 0.3 | – | – | – |
| Disease of the Musculoskeletal Systems | 1.8 | 0.5 | 1.0 | 1.1 | 0.04 | 0.4 | 5.9 | 0.4 | 2.5 | 1.9 | 0 | 1.3 |
| Factors Influencing Health Status | 0.6 | 0.5 | 0.6 | 1.5 | 4.3 | 3.4 | 1.7 | 0.2 | 0.8 | – | – | – |
| Unknown | 2.6 | 4.3 | 3.6 | 0.7 | 4.6 | 3.3 | 8.6 | 1.2 | 4 | 74.2 | 4.4 | 51.9 |
ICD-10 for Principal diagnoses with very small proportions are not reported in this table.
Excluding 5 units of Whole Blood.
Patient survival
Among transfused patients, the overall survival rate 24 hours after last transfusion was 89%. There was a gender and ward but no age difference in survival rates after 24 hours. Transfused patients in adult ICU and NICU had lower 24-hour survival (62% and 68%) than in other wards (97–99%). Seventy three percent of patients were discharged alive after their last transfusion. The majority of patients transfused in the OR (95%), GA wards (93%), Nursery (84%), and ER (80%) were alive, whereas only a small proportion of patients transfused in the ICU (13%) and NICU (16%) survived (Table 3). Survival rates at discharge were negatively associated with age. About 80% of patients younger than 45 years, 75% between 45–54 years, 70% of 55–74 years, and only 58% of those above 74 years of age were discharged alive. The main causes of death at discharge were diseases of respiratory system (15.8%), followed by Infectious and Parasitic diseases (15.4%), Disease of Digestive system (14.9%), Neoplasm (12.2%), and Disease of Circulatory system (11.2%). (Appendix Table 2 provides additional information on survival according to principal ICD-10 diagnosis).
Table 3.
Number (%) of patients survival by gender, ward, and age after last transfusion at Hospital das Clinicas, Sao Paulo, Brazil, 2004
| Alive after 24 hours | Discharged alive | Survival after 1 year | |
|---|---|---|---|
| Total (3835) | 3,406 (89) | 2,816 (73) | 2162 (56) |
| Gender | |||
| Female (1,782) | 1,615 (91) | 1,340 (75) | 1053 (59) |
| Male (2,053) | 1,805 (88) | 1,476 (72) | 1109 (54) |
| Ward | |||
| Emergency Room (1,229) | 1,118 (91) | 978 (80) | 662 (54) |
| General Admission (1,239) | 1,226 (99) | 1,155 (93) | 957 (77) |
| Intensive Care Unit (706) | 439 (62) | 90 (13) | 65 (9) |
| Operating Room (527) | 521 (99) | 501 (95) | 386 (73) |
| Nursery (103) | 95 (92) | 87 (84) | 87 (84) |
| Neonatal Intensive Care Unit (31) | 21 (68) | 5 (16) | 5 (16) |
| Age* | |||
| 0–14 (271) | 249 (92) | 220 (81) | 209 (77) |
| 15–34 (715) | 634 (89) | 572 (80) | 502 (70) |
| 35–44 (486) | 440 (91) | 391 (80) | 321 (66) |
| 45–54 (672) | 599 (89) | 501 (75) | 386 (57) |
| 55–74 (1,228) | 1,094 (89) | 859 (70) | 573 (47) |
| 75 and above (448) | 390 (87) | 262 (58) | 160 (36) |
15 patients with missing age at admission; 11 of them were alive after 1 year.
P = 0.477 for age by survival at 24 hours. For all others, p < .01.
Appendix Table 2.
Survival Status (% of Admissions) at Hospital Discharge by ICD-10 and Transfusion Status
| ICD-10 | Transfused (N = 4330) | Non-Transfused (N = 34501) | ||
|---|---|---|---|---|
| Alive | Deceased | Alive | Deceased | |
| Neoplasma | 32.1 | 12.2 | 13.7 | 16.8 |
| Disease of Digestive System | 14.2 | 14.9 | 11 | 8.0 |
| Infectious and Parasitic Diseases | 3.5 | 15.4 | 3.1 | 7.2 |
| Disease of Circulatory System | 9.9 | 11.2 | 5.2 | 21.2 |
| Injury, Poisoning and External Causes | 9.7 | 8.9 | 5.8 | 12.4 |
| Disease of the Genitourinary System | 7.2 | 3.9 | 8.6 | 2.8 |
| Disease Of Respiratory System | 2.7 | 15.8 | 6.2 | 17.9 |
| Disease of the Blood, Organs | 4.7 | 3.2 | 0.8 | 0.7 |
| Pregnancy and Puerperium | 2.3 | 0.1 | 10.2 | 0 |
| Symptoms/Signs Not Elsewhere Classified | 1.7 | 3.9 | 2.4 | 2.3 |
| Condition in the Perinatal Period | 2.3 | 3.5 | 5.5 | 2.2 |
| Disease of the Musculoskeletal Systems | 1.4 | 0.7 | 2.2 | 0.3 |
| Endocrine, Nutritional, and Metabolic Disease | 1.5 | 0.8 | 3.7 | 1.1 |
| Diseases of the Nervous System | 1.2 | 1.1 | 3.4 | 2.7 |
| Diseases of the Eye and Adnexa | 0.06 | 0 | 6.5 | 0 |
| Diseases of the Ear and Mastoid Process | 0.09 | 0 | 2.2 | 0.1 |
| Diseases of the Skin and Subcutaneous Tissue | 0.9 | 1.2 | 2.1 | 0.8 |
| Congenital Malformation, Deform | 1.7 | 0.3 | 3 | 0.8 |
| Mental and Behavioral Disorders | 0.2 | 0.1 | 0.8 | 0.3 |
| External Causes of Morbidity and Mortality | 0 | 0 | 0.01 | 0.2 |
| Factors Influencing Health Status | 0.5 | 0.3 | 2.4 | 0.1 |
| Unknown | 2.2 | 2.5 | 1.3 | 2.2 |
| 100% | 100% | 100% | 100% | |
The unadjusted Kaplan Meier curves indicate survival up to 800 days following transfusion by ward and age, with only a smaller difference evident by gender (Figure 2). Survival by ward and age were dramatically different. Fifty-six percent of patients (59% of females and 54% of males) survived at least one year after their last transfusion. Only 9% of transfused ICU patients survived to one year after discharge.
Figure 2.
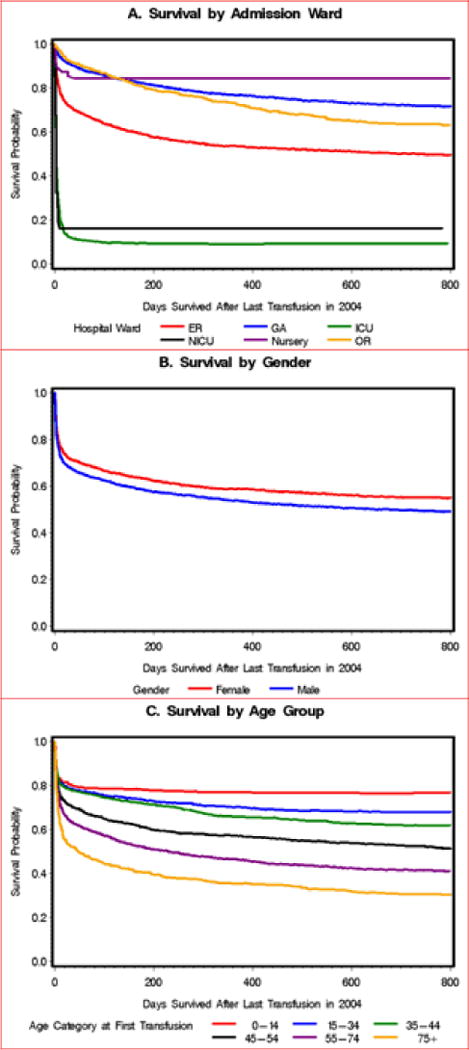
Survival curves of patients after their last transfusion in Hospital Das Clinicas, Sao Paulo, 2004. A. Survival Curve by Admission Ward. B. Survival Curve by Gender. C. Survival Curve by Age Group.
The multivariable model of factors associated with mortality following transfusion shows that the most important factor is the ward the patient was in (Table 4). Relative to GA, patients in the ICU were far more likely die (Adjusted OR 73.2, 95% CI 52.5 – 101.9). Similarly, transfusion to neonates is strongly associated with high odds of mortality whether in the NICU or nursery. Increasing age and the number of components transfused were associated with increased odds of mortality. We also observed that the types of components transfused were associated with significantly different odds of mortality. However the magnitudes of these differences were small in comparison to the effect of ward.
Table 4.
Results of logistic regression analyses predicting patient survival at discharge after last transfusion by gender, ward, and age at Hospital das Clinicas, Sao Paulo, Brazil, 2004
| p-value | Odds Ratio … 95% CI | |
|---|---|---|
| Gender | 0.92 | |
| Female | 1.01 (0.82–1.25) | |
| Male | 1 | |
| Ward | < 0.0001 | |
| General Admission | 1 | |
| Emergency Room | 3.08 (2.34–4.05) | |
| Intensive Care Unit | 73.2 (52.5–101.9) | |
| Operating Room | 0.56 (0.35–0.89) | |
| NICU* | 542.2 (132.2–2223.7) | |
| Nursery* | 19.2 (6.0–61.6) | |
| Age in years | < 0.0001 | |
| 0–14 | 0.33 (0.13–0.85) | |
| 15–34 | 1 | |
| 35–44 | 1.13 (0.74–1.73) | |
| 45–54 | 2.56 (1.77–3.70) | |
| 55–74 | 2.92 (2.10–4.06) | |
| 75 and above | 5.08 (3.44–7.51) | |
| # of Components during admission with last Transfusion | 0.0003 | |
| 1–2 | 1 | |
| 3–5 | 1.33 (1.02–1.73) | |
| 6–10 | 1.54 (1.09–2.18) | |
| 11 and above | 2.71 (1.72–4.28) | |
| Type of Components | 0.002 | |
| Red blood cell vs. not | 0.78 (0.51–1.19) | |
| Platelet vs. not | 1.61 (1.07–2.41) | |
| Plasmas vs. not | 1.40 (1.05–1.89) | |
| Cryoprecipitate vs. not | 1.06 (0.31–3.62) |
For Nursery and NICU patients, the other covariates (gender, age, # components, and type of components) are not categorized.
Discussion
This study characterized the epidemiology of blood transfusions at the Central Institute of Hospital das Clinicas, the main public hospital and tertiary care and trauma center in Sao Paulo, Brazil. To our knowledge, this is the first comprehensive analysis that correlates blood utilization and patient survival in a general population of transfused patients in Sao Paulo, or any other city in South America. Overall the prevalence of blood transfusion at the Central Institute of HC was 12.5% of admitted patients. That prevalence of transfusion is higher than reported in Denmark (7%)25, Germany (6 to 6.6%)26, and France8, but lower than in Korea (17% to 18.7%)1. These differences highlight the fact that rates of blood transfusion vary across countries based on specific clinical conditions and diagnostic and therapeutic procedures, and perhaps also on cultural perspectives of blood, especially in East Asia where blood has been endowed with critical healing power or ‘health booster’.27
The mean age at the time of transfusion in Sao Paulo was 49 years, a younger age than in developed countries where the mean age varies from 60 to 69 years old.9, 10, 25, 28–30 While in developed countries 60 to 70% of the blood recipients are over 60 years old,7, 9, 28 at the HC in Sao Paulo, 70% of the transfused patients were less than 65 years old, with 47% being less than 45 years of age. This finding might be partially explained by the lower average life expectancy in Brazil31 than in developed countries, but it might also be due to the higher proportion of external injury, such as car accidents and urban violence, within the younger age group (18 to 35 years old).32, 33
In our study only 42% of patients received red cells, which is lower than in Sweden (74%)10, Denmark (56–96%)10, 25, and France (90%)8. At the Central Institute, age and gender were also related to component use, with males under the age of 45 years receiving more red cells transfusions than older patients (75 or older). This finding contrasts with data from England and Finland where RBC use increased beginning around age 5034, 35 and where patients 70–80 years old had an eight-fold higher RBC use than 20–40 years old patients34. In Spain, the majority of RBCs were transfused in patients 65 years or older7, 29 and the median age for the RBC recipients in England and North Wales was 69.28 These differences likely reflect the epidemiological blood recipient profile across different countries and may also highlight the fact that the Central Institute is a tertiary care hospital and trauma center.
The prevalence of plasma use (16%) was similar to that in Denmark (12.6–19%)25, 36 and Sweden (18.3 %)10 but higher than in Spain (6.9%).29 Likewise, the prevalence of platelet use was also higher in Sao Paulo than in Denmark and Sweden10, 25(40% vs. 5.6% and 7.1% respectively). The highest platelet use occurred in the ICU (58%) followed by the GA wards (31%).
Among the main diagnoses resulting in transfusion at the HC Central Institute are neoplasm, diseases of the digestive and circulatory systems, and injury, poisoning, and other external causes. Although there is a paucity of comprehensive published data on blood usage by ICD-10 codes, our results are consistent with those reported by other authors. A Danish study 5 found injury to be the 2nd and 5th most common causes of transfusion in female and male patients, respectively, however these blood transfusions affected elderly males and females compared to Brazilian recipients with injury, poisoning, and other external causes at central Institute. Moreover a Korean study1 also found injury as the 2nd most common cause for being transfused and similar to our findings, individuals with injury, poisoning, and other external causes were more likely to be transfused with red cells, platelets and fresh frozen plasma.
The overall survival rate (56%) of the transfused patients at one year after their last blood transfusion is much lower than those reported in the U.S (68–73%)37, Sweden (76%), Denmark (69%)36, and Netherlands (65%).38 This low survival rate might be explained in part because the Central Institute receives the most severely injured and complex cases in Sao Paulo.
Our study has limitations. First, despite the high degree of completeness in the available data, we surveyed only the wards at the Central Institute. It is likely that if procedures associated with high component use, such as extracorporeal cardiac pumps, for some types of massive hemorrhage for which transfusions would be given to patients at the Heart Institute, Trauma and Orthopedics Institute, and Children’s Institute, if available for inclusion in this analysis, might have provided different results. However it is important to note that a substantial proportion of trauma-related care is included in our analysis. Initial intake of trauma patients occurs at the HC ER. Patients with poly-trauma will be treated at HC, whereas patients with relatively uncomplicated trauma for which specific orthopedic surgery may be required will be transferred to the Trauma and Orthopedics Institute. Given available data we are unable to determine the proportion of trauma patients treated at HC versus those treated at to the Trauma and Orthopedics Institute. A second limitation is that our data do not permit an evaluation of some clinical parameters, such as the hemoglobin level, ABO type and the overall patient aspect according to specific instruments such as the Simplified Acute Physiology Score II, or the APACHE II (Acute Physiology and Chronic Health Evaluation II), and the Sequential Organ Failure Assessment score, which are used in settings such as the ICU. Third, we used the ICD-10 codes in the computer records to identify the primary diagnoses. However, we were not able to identify within each ICD-10 disease which specific condition likely triggered transfusion, or which one was the primary cause of death in hospital. We assumed that the principal diagnosis was the trigger and the death cause. While in each case this may not be completely correct, the principal diagnosis is the appropriate indicator of the reason for initial admission. To establish the relationship between specific clinical and surgical procedures or triggers for transfusion and the blood utilization, more comprehensive retrospective or prospective data would be needed. The national death information database (SIM) provides multiple causes of death for this linkage, however, only the field with primary cause of death was used for analysis. As a result, we may have missed secondary causes that contributed to the death. Fourth, the results have shown that the median number of transfused components was 3 units per patient admission, similar to reports from the U.S. (2.9 units)2 and France (3 units)8. The majority of the patients had only one transfusion episode, which is also consistent with the literature2, 8, 10. However transfusion episode is a constructed variable and there is no unambiguous way to define a transfusion episode. We defined each episode as receiving any components in each 24-hour period. For that reason a single patient admission could contribute information to multiple transfusion episodes during the same admission in our analysis, and this was the situation for approximately 40% of admissions.
In Brazil, the descriptive epidemiology of blood recipients and the causes for transfusion are understudied. Although this study presents data on a small proportion of patients that received transfusion in Brazil, it highlights the epidemiological information that can be obtained. This information catalogues the use of specific types of blood products and can help in planning blood supply needs. From this perspective, we believe that this study is a first but important step in understanding the epidemiology of blood transfusion and correlates of post-transfusion survival in Brazil.
Footnotes
Conflict of interest: none
References
- 1.Lim YA, Lee WG, Cho SR, Hyun BH, Sc D. A study of blood usage by diagnoses in a Korean university hospital. Vox Sang. 2004 Jan;86(1):54–61. doi: 10.1111/j.0042-9007.2004.00385.x. [DOI] [PubMed] [Google Scholar]
- 2.Sullivan MT, Cotten R, Read EJ, Wallace EL. Blood collection and transfusion in the United States in 2001. Transfusion. 2007 Mar;47(3):385–394. doi: 10.1111/j.1537-2995.2007.01128.x. [DOI] [PubMed] [Google Scholar]
- 3.Cobain TJ, Vamvakas EC, Wells A, Titlestad K. A survey of the demographics of blood use. Transfus Med. 2007 Feb;17(1):1–15. doi: 10.1111/j.1365-3148.2006.00709.x. [DOI] [PubMed] [Google Scholar]
- 4.Syrjala MT, Kytoniemi I, Mikkolainen K, Ranimo J, Lauharanta J. Transfusion practice in Helsinki University Central Hospital: an analysis of diagnosis-related groups (DRG) Transfus Med. 2001 Dec;11(6):423–431. doi: 10.1046/j.1365-3148.2001.00338.x. [DOI] [PubMed] [Google Scholar]
- 5.Madsen JT, Kimper-Karl ML, Sprogoe U, Georgsen J, Titlestad K. One year period prevalence of blood transfusion. Transfus Med. 2009 Nov 11; doi: 10.1111/j.1365-3148.2009.00977.x. [DOI] [PubMed] [Google Scholar]
- 6.Chiavetta JA, Herst R, Freedman J, Axcell TJ, Wall AJ, van Rooy SC. A survey of red cell use in 45 hospitals in central Ontario, Canada. Transfusion. 1996 Aug;36(8):699–706. doi: 10.1046/j.1537-2995.1996.36896374373.x. [DOI] [PubMed] [Google Scholar]
- 7.Garcia-Erce JA, Campos A, Munoz M. Blood donation and blood transfusion in Spain (1997 - 2007): the effects of demographic changes and universal leucoreduction. Blood Transfus. 2010 Apr;8(2):100–106. doi: 10.2450/2009.0079-09. [DOI] [PMC free article] [PubMed] [Google Scholar]
- 8.Mathoulin-Pelissier S, Vicariot M, Gross S, et al. Pilot study of the characteristics of transfused patients and utilized labile blood products. Transfus Clin Biol. 1997 Dec;4(6):533–540. doi: 10.1016/s1246-7820(97)80078-x. [DOI] [PubMed] [Google Scholar]
- 9.Quaranta JF, Berthier F, Courbil R, et al. Who are the recipients of labile blood products? A multicenter nation-wide study--a [donation day.] Blood banks, health facilities. Transfus Clin Biol. 2009 Mar;16(1):21–29. doi: 10.1016/j.tracli.2009.02.002. [DOI] [PubMed] [Google Scholar]
- 10.Kamper-Jorgensen M, Edgren G, Rostgaard K, et al. Blood transfusion exposure in Denmark and Sweden. Transfusion. 2009 May;49(5):888–894. doi: 10.1111/j.1537-2995.2008.02081.x. [DOI] [PubMed] [Google Scholar]
- 11.Hajjar LA, Vincent JL, Galas FR, et al. Transfusion requirements after cardiac surgery: the TRACS randomized controlled trial. Jama. 2010 Oct 13;304(14):1559–1567. doi: 10.1001/jama.2010.1446. [DOI] [PubMed] [Google Scholar]
- 12.Boin IF, Leonardi MI, Luzo AC, Cardoso AR, Caruy CA, Leonardi LS. Intraoperative massive transfusion decreases survival after liver transplantation. Transplant Proc. 2008 Apr;40(3):789–791. doi: 10.1016/j.transproceed.2008.02.058. [DOI] [PubMed] [Google Scholar]
- 13.WHO. Universal access to safe blood. http://www.who.int/bloodsafety/en/. Accessed September,25 2009.
- 14.IBGE. Censo 2010. 2011 http://www.ibge.gov.br/censo2010/resultados_do_censo2010.php. Available at. Accessed 19 January 2011.
- 15.ANVISA ANDVS- Boletim de Hemovigilância. Boletim de Hemovigilância nº 2. 2009;2:13. [Google Scholar]
- 16.Sanitaria. BNHVA-ANdV, editor. ANVISA. Manual de Hemovigilância. Vol. 3. Brazilian National Health Vigilance Agency- Agencia Nacional de Vigilancia; Sanitaria: 2003. pp. 1–29. [Google Scholar]
- 17.Brazil. Resolução RDC nº 153, de 14 de junho de 2004: Determina o Regulamento Técnico para os procedimentos hemoterápicos, incluindo a coleta, o processamento, a testagem, o armazenamento, o transporte, o controle de qualidade e o uso humano de sangue, e seus componentes, obtidos do sangue venoso, do cordão umbilical, da placenta e da medula óssea. Diário Oficial da União; Poder Executivo, de 24 de junho de 2004: ANVISA - Agência Nacional de Vigilância Sanitária. 2004.
- 18.dos Santos AM, Guinsburg R, Procianoy RS, et al. Variability on red blood cell transfusion practices among Brazilian neonatal intensive care units. Transfusion. 2009 Jan;50(1):150–159. doi: 10.1111/j.1537-2995.2009.02373.x. [DOI] [PubMed] [Google Scholar]
- 19.Fraga GP, Bansal V, Coimbra R. Transfusion of Blood Products in Trauma: An Update. J Emerg Med. 2009 Apr 1;39(2):253–260. doi: 10.1016/j.jemermed.2009.02.034. [DOI] [PubMed] [Google Scholar]
- 20.Hajjar LA, Auler Junior JO, Santos L, Galas F. Blood tranfusion in critically ill patients: state of the art. Clinics (Sao Paulo) 2007 Aug;62(4):507–524. doi: 10.1590/s1807-59322007000400019. [DOI] [PubMed] [Google Scholar]
- 21.IBGE. Populacão da cidade de São Paulo. In: Brasilia DF, editor. Brazilian Institute of National Statistics and Geography-IBGE 2004. Brazilian Governament; 2000. Brasil. [Google Scholar]
- 22.WHO. International Classification of Diseases (ICD) http://www.who.int/classifications/icd/en/[Accessed 28 november 2010.
- 23.Beguin C, Lambermont M, Dupont E, et al. Blood transfusion practice in Belgium. As assessed by a national survey. Acta Anaesthesiol Belg. 1998;49(2):141–152. [PubMed] [Google Scholar]
- 24.Capuani LCB, Goncalez TT, Jing EL, Silva PP, Ferreira JE, Chamone DF, Murphy E, Busch MP, Sabino EC. Survival rate among recipients of blood in a main Public Hospital in Sao Paulo, Brazil. Vox Sanguinis. 2010;99(Suppl. 1):18. 2010. [Google Scholar]
- 25.Titlestad K, Georgsen J, Jorgensen J, Kristensen T. Monitoring transfusion practices at two university hospitals. Vox Sang. 2001 Jan;80(1):40–47. doi: 10.1046/j.1423-0410.2001.00001.x. [DOI] [PubMed] [Google Scholar]
- 26.Zimmermann R, Buscher M, Linhardt C, et al. A survey of blood component use in a German university hospital. Transfusion. 1997 Oct;37(10):1075–1083. doi: 10.1046/j.1537-2995.1997.371098016449.x. [DOI] [PubMed] [Google Scholar]
- 27.Shan H, Wang JX, Ren FR, et al. Blood banking in China. Lancet. 2002 Nov 30;360(9347):1770–1775. doi: 10.1016/S0140-6736(02)11669-2. [DOI] [PubMed] [Google Scholar]
- 28.Wells AW, Llewelyn CA, Casbard A, et al. The EASTR Study: indications for transfusion and estimates of transfusion recipient numbers in hospitals supplied by the National Blood Service. Transfus Med. 2009 Dec;19(6):315–328. doi: 10.1111/j.1365-3148.2009.00933.x. [DOI] [PubMed] [Google Scholar]
- 29.Bosch MA, Contreras E, Madoz P, Ortiz P, Pereira A, Pujol MM. The epidemiology of blood component transfusion in Catalonia, Northeastern Spain. Transfusion. 2010 Jul 16; doi: 10.1111/j.1537-2995.2010.02785.x. [DOI] [PubMed] [Google Scholar]
- 30.Wallis JP, Wells AW, Matthews JN, Chapman CE. Long-term survival after blood transfusion: a population based study in the North of England. Transfusion. 2004 Jul;44(7):1025–1032. doi: 10.1111/j.1537-2995.2004.03400.x. [DOI] [PubMed] [Google Scholar]
- 31.IBGE. Web site statistiscs. 2010. 2004, Brazilians' life expectancy reached 71.7 years. [December, 01, 2005. Accessed October, 26, 2010. [Google Scholar]
- 32.Gawryszewski VP, Koizumi MS, Mello-Jorge MH. Morbidity and mortality from external causes in Brazil, 2000. Cad Saude Publica. 2004 Jul-Aug;20(4):995–1003. doi: 10.1590/s0102-311x2004000400014. [DOI] [PubMed] [Google Scholar]
- 33.Santos Modelli ME, Pratesi R, Tauil PL. [Blood alcohol concentration in fatal traffic accidents in the Federal District, Brazil] Rev Saude Publica. 2008 Apr;42(2):350–352. doi: 10.1590/s0034-89102008000200022. [DOI] [PubMed] [Google Scholar]
- 34.Wells AW, Mounter PJ, Chapman CE, Stainsby D, Wallis JP. Where does blood go? Prospective observational study of red cell transfusion in north England. Bmj. 2002 Oct 12;325(7368):803. doi: 10.1136/bmj.325.7368.803. [DOI] [PMC free article] [PubMed] [Google Scholar]
- 35.Ali A, Auvinen MK, Rautonen J. The aging population poses a global challenge for blood services. Transfusion. 50(3):584–588. doi: 10.1111/j.1537-2995.2009.02490.x. Mar. [DOI] [PubMed] [Google Scholar]
- 36.Kamper-Jorgensen M, Ahlgren M, Rostgaard K, et al. Survival after blood transfusion. Transfusion. 2008 Dec;48(12):2577–2584. doi: 10.1111/j.1537-2995.2008.01881.x. [DOI] [PubMed] [Google Scholar]
- 37.Kleinman S, Marshall D, AuBuchon J, Patton M. Survival after transfusion as assessed in a large multistate US cohort. Transfusion. 2004 Mar;44(3):386–390. doi: 10.1111/j.1537-2995.2003.00660.x. [DOI] [PubMed] [Google Scholar]
- 38.Borkent-Raven BA, Janssen MP, van der Poel CL, Schaasberg WP, Bonsel GJ, van Hout BA. Survival after transfusion in the Netherlands. Vox Sang. 2010 Aug 18; doi: 10.1111/j.1423-0410.2010.01378.x. [DOI] [PubMed] [Google Scholar]