

Abstract
Bacteria use the replication origin-to-terminus polarity of their circular chromosomes to control DNA transactions during the cell cycle. Segregation starts by active migration of the region of origin followed by progressive movement of the rest of the chromosomes. The last steps of segregation have been studied extensively in the case of dimeric sister chromosomes and when chromosome organization is impaired by mutations. In these special cases, the divisome-associated DNA translocase FtsK is required. FtsK pumps chromosomes toward the dif chromosome dimer resolution site using polarity of the FtsK-orienting polar sequence (KOPS) DNA motifs. Assays based on monitoring dif recombination have suggested that FtsK acts only in these special cases and does not act on monomeric chromosomes. Using a two-color system to visualize pairs of chromosome loci in living cells, we show that the spatial resolution of sister loci is accurately ordered from the point of origin to the dif site. Furthermore, ordered segregation in a region ∼200 kb long surrounding dif depended on the oriented translocation activity of FtsK but not on the formation of dimers or their resolution. FtsK-mediated segregation required the MatP protein, which delays segregation of the dif-surrounding region until cell division. We conclude that FtsK segregates the terminus region of sister chromosomes whether they are monomeric or dimeric and does so in an accurate and ordered manner. Our data are consistent with a model in which FtsK acts to release the MatP-mediated cohesion and/or interaction with the division apparatus of the terminus region in a KOPS-oriented manner.
The faithful transmission of bacterial genomes to daughter cells is a progressive process. Both replication and segregation of circular chromosomes proceed from a single origin of replication to the opposite terminus (1–3). This process defines two origin to terminus (ori-ter) replichores of opposite polarity, also characterized by sequence composition and biases in DNA motifs (4). Segregation of the Escherichia coli chromosome has been investigated using FISH and fluorescent DNA-binding proteins (5–8). In slowly growing newborn cells, the ori region localizes at midcell and the ter region close to the new cell pole. Replicated ori regions migrate to the quarter positions (the center of the future daughter cells) by an uncharacterized active mechanism and are followed by the rest of the chromosome in the ori-to-ter order. Ter loci migrate to midcell where they are replicated. This movement occurs near the cell periphery (9) and during ter replication (10), suggesting that replication may pull ter to midcell. Replication of ter is concomitant with the recruitment at midcell of the early components of the cell division apparatus [the divisome (6)]. The ter region then is maintained at midcell during the postreplicative period. This localization depends on the MatP protein that binds matS sites scattered in a 780-kb region referred to as the “Ter macrodomain” (11). MatP binding to matS compacts this region and delays its segregation. This latter effect depends on the interaction of MatP with ZapB, an early component of the divisome (10).
Segregation of the ter region has been studied extensively in the special case of dimeric sister chromosomes that arise by recombination during replication (12). In this case, XerCD-mediated recombination at the dif site, located in the ter region, is required to resolve chromosome dimers. FtsK, a DNA translocase associated with the divisome, is also required (13, 14). FtsK acts in a region about 400 kb long (15) and translocates DNA toward dif. Translocation is oriented by recognition of the FtsK-orienting polar sequences (KOPS) DNA motifs that are preferentially oriented toward dif, particularly in the ter region (4, 16–18). Upon reaching the dif site, FtsK activates XerCD-mediated recombination that resolves chromosome dimers. The oriented translocation activity of FtsK also is strictly required when chromosome organization is impaired by mutations, for instance by inactivation of the MukBEF complex (19, 20) or in strains carrying important asymmetry of the replichores (21).
Although it is generally agreed that there is an active mechanism for segregation of the ori region, active segregation of other chromosome regions has not been reported. Indeed, models inferred from genetics analyses posit that FtsK acts only during special segregation events (19, 20, 22). Here, we show that FtsK segregates the ter region in most, if not all, cells. We analyzed the relative segregation times of sister chromosome loci using fluorescence microscopy and showed that it follows a precisely ordered pattern ending at the dif site. Ordered segregation of a large region (at least 200 kb) surrounding the dif site did not depend on the presence of chromosome dimers but depended on both FtsK and the MatP protein.
Results
Improving Loci Visualization Systems.
To visualize chromosome loci, we used previously described systems (6, 23). We inserted parS sites from plasmids P1 and pST1 (parSP1 and parSpMT1, respectively) or an array of tet operators (tetO) at a set of chromosome loci (Tables S1–S3). Strains carrying these constructs were observed in slow-growing conditions to facilitate the observation of segregation events at nearby loci (Material and Methods). In these conditions, our reference strain grew with a 210-min doubling time with no overlapping replication cycle and an extended postreplicative period (Fig. S1).
ParBP1 and TetR-derived fluorescent protein were produced from constructs inserted at the lac and ara chromosome loci, respectively, and the ParBpMT1-derived protein from the low copy number plasmid pMS11 (Fig. 1A and Tables S1–S3). Fluorescent foci were readily detected without inducer using pMS11, but a moderate concentration of reducers was required using the chromosome-borne constructs (Fig. 1B). Most interestingly, the two ParB-derived systems yielded equivalent numbers of foci per cell, slightly more than the TetR-derived system (Fig. 1C). This result contrasted with previously described systems for the production of ParB derivatives (23, 24). In our strains, XFP-ParBP1 proteins produced from previously described plasmids provoked a significant delay in loci segregation, even when no inducer was added (Fig. S2B). This effect was significantly enhanced in faster-growing cells (Fig. S2C).
Fig. 1.

Systems used for visualization of chromosome loci. (A) Relevant map of constructs for fluorescent protein production. Plasmid pMS11 is a pSC101 derivative carrying a lacZp-mCherry-Δ30ParBP1 construct. GFP-Δ23ParBpMT1 and TetR-GFP were produced from chromosome-borne constructs at the lac and ara loci, respectively. (B) Examples of micrographs showing foci of the indicated fluorescent proteins in strains containing loci tagged with the relevant binding sites (ydgJ::tetO or parSP1; ydcB::parSP1, and ydeU::parSpMT1). (C) The percentage of cells with a single focus or two foci of the ydgJ (ter) or ydhJ (right) loci when visualized using fluorescent proteins produced from constructs shown in A.
We next observed the effects of localization systems on the cell cycle by measuring the number of replication origins per cell using flow cytometry (Fig. S3). The ParBpMT1 system using plasmid pMS11 did not modify this ratio compared with the wild-type strain. The two other systems provoked the appearance of cells with four replication origins, indicating that cell division was delayed in some cells, undoubtedly because of replication and/or segregation defects. These effects were most pronounced with the TerR system, whereas the ParBP1 system provoked less than 10% four-foci cells at any locus. We thus used the two ParB-derived systems for the simultaneous localization of two loci.
The Chromosome Segregation Pattern Is Highly Accurate.
Although the ori-to-ter segregation pattern is well established, it is unclear whether this pattern pertains to all cells or if it is subject to important cell-to-cell variation. To measure cell-to-cell variation, we compared the segregation of a locus close to the dif site (ydeU, 2 kb clockwise from dif) with that of other loci. To minimize the risk of artificial segregation delay at the ydeU locus, we used the ParBpMT1 system to localize it and the ParBP1 system to localize the other loci: an oriC-proximal locus (ilvA); two midreplichore loci (yffS and ybhJ), and a ter locus (ycgY, 345 kb from dif). When the two systems were used in the same cells, both loci were readily detected without the addition of an inducer because of the titration of the LacI repressor by pMS11-borne lacZp (Fig. 1B). Less than 1.5% cells lacked foci of either visualization system. Cells were classed into categories according to their number of foci at each locus. In cells with two foci, the ratio of the interfocal distance to cell size did not increase with the cell size (Fig. S4). The spatial resolution of sister foci thus is followed quickly by their rapid displacement to opposite halves of the cell so that this movement is not detected in snapshot analysis. This result indicates that the time when sister loci lose their colocalization reflects the kinetics of the whole segregation process in our analysis. As expected, the ratio of cells with one focus for each locus increased with decreasing distance from ydeU (Fig. 2, open bars), and the ratio of cells with two foci at each locus was constant because it depended on ydeU segregation (gray bars). Loci thus segregated in their order of replication. The mean times of postreplicative colocalization, calculated from the inferred replication and measured segregation mean times (see Fig. S1 and legend), ranged from 35 min for ybhJ and ycgY to 50 min for ilvA.
Fig. 2.

The ori-to-ter segregation of the chromosome. The ydeU locus was tagged using the ParBpMT1 system (red arrowhead),and other loci, indicated inside the chromosome maps, were tagged with the ParBP1 system (green arrowheads). Positions of loci on the chromosome are indicated by lines representing ori (top) and dif (bottom). The number of cells analyzed is given (n). Cells were classified by the number of foci of each locus (shown in cartoons on the x-axis; the empty cell indicates cells that fall in none of the first four categories). Bars show the mean percentage of each category in the population (y-axis) with individual measured ranges. Data reflect at least two independent experiments.
Cells with three foci (two foci at one locus and one focus at the other) would fall in two classes depending on which focus was duplicated (Fig. 2). The proportion of cells with two ParBP1 foci and one ParBpMT1 focus decreased with the distance from ydeU (green bars), consistent with decreasing time between the segregation of the two loci. Strikingly, less than 1% of cells with three foci had duplicated ydeU foci (red bars). Thus the ydeU locus is almost always segregated later than the other loci, including the ycgY locus located in the ter region. The segregation pattern of the chromosome thus is highly accurate, the ter region being the last segregated in almost all cells. These data also pointed out that segregation of the ter region occurs in an ordered sequence, the ydeU locus, closest to dif, being segregated later than ycgY, which is more remote from dif. This result prompted us to analyze ter segregation in more detail.
Chromosome Segregation Ends at dif.
To obtain a detailed view of ter segregation, we constructed insertions of parS sites and tetO arrays at additional ter loci (Fig. 3A). We first analyzed the positioning of single loci depending on cell size (Fig. 3B and Fig. S4). All loci tended to localize close to a cell pole in smaller cells and then migrate to midcell before foci duplication (Fig. 3C). Loci closer to the dif site tended to segregate later, as shown by their lower foci number per cell. We also noticed that loci closer to the dif site tended to stay closer to each other after segregation, as shown by the lower average interfocal distance in cells with two foci (Fig. 3C). We then compared the ycgY and ydgJ loci (342 and 114 kb from dif, respectively) in more detail. We introduced an ssb-mCherry fusion gene in strains tagged at these loci. Cells longer than 3 μm and harboring no SSB-mCherry focus were considered to be in their D period (see also Fig. S1). These cells were categorized into two classes, depending on whether or not they harbored a midcell constriction (38 and 62%, respectively). Segregation of ydgJ was clearly delayed compared with that of ycgY in all cell categories (Fig. 3D). From these data, we inferred that the mean segregation time of ydgJ is 35 min before cell separation, concomitant with the onset of constriction, whereas ycgY segregates about 10 min earlier (see Fig. S1 for calculations).
Fig. 3.
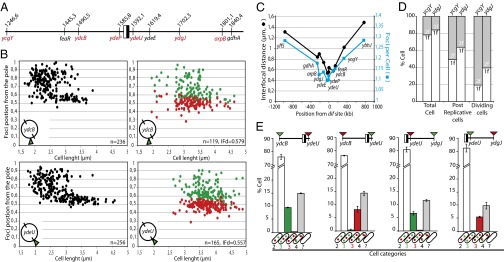
ter segregation is sequential and ends at dif. (A) Map of the loci used, with coordinates indicated. The black and white box represents the dif site. Red loci were tagged with both ParB-derived systems, black loci were tagged with the TetR-derived system, and the ydgJ and ycgY loci were tagged with all three systems. (B) Intracellular position of foci tagged with parSP1 from their farthest pole (x-axis) as a function of cell length (y-axis). (Left) Cells with a single focus (black dots). (Right) Cells with two foci (red and green dots). Loci are indicated, as well as the number of cells analyzed and the mean interfocal distance (IFd). (C) Plot of the interfocal distance in cells with two foci (black curve and dots, left axis) and the mean number of foci per cell (blue curve and squares, right axis) as a function of the distance from dif (kb, x-axis). (D) Number of foci of the indicated loci in different cell categories. Strains carried an SSB-mCherry fusion. Postreplicative cells are >3 μm long and harbor no SSB focus and no constricting septum. Dividing cells have a constricting septum. (E) Tagged loci are indicated with their position relative to dif. Red arrowheads indicate a parSpMT1 tag, and green arrowheads indicate a parSP1 tag. Cells were classified by the number of foci of each locus (shown in cartoons on the x-axis; the empty cell indicate cells that fall in none of the first four categories). Bars show the mean percentage of each category in the population (y-axis) with individual measured ranges. Data reflect at least two independent experiments and more than 600 cells.
We next constructed strains with chosen pairs of loci tagged with parSP1 and parSpMT1 sites. The localization systems were swapped between loci to detect any system-induced artifact. Fig. 3D shows the segregation of the ydeU locus compared with ydcB and ydgJ (100 kb counterclockwise and 100 kb clockwise from dif, respectively). As expected, all three loci segregated late; hence most cells had one focus at each locus. Between 7 and 10% of the cells had three foci. Among these, less than 6% had duplicated ydeU foci, whereas more than 94% had duplicated ydcB or ydgJ foci. We concluded that the ydeU locus segregates later than the ydcB and ydgJ loci in the vast majority of cells. Equivalent results were obtained when comparing segregation of the ydeP locus (3 kb counterclockwise from dif) with that of ydcB and ydgJ (Fig. S5 A–D): ydeP segregated later than the two other loci in most cells. In all cases, swapping the localization systems between loci modified neither their timing nor their order of segregation (Fig. 3D and Fig. S5 A–D).
Consistent with an ori-to-dif pattern of segregation, the arpB locus (214 kb from dif) segregated earlier than the dif site (ydeU) and than the ydgJ locus, located closer to dif on the same side (Fig. S5 E and F). However, no segregation order was observed between loci located on opposite sides of dif (Fig. S5 G and H). These data show that the whole chromosome, including the dif-proximal part of the ter region, segregates in an accurately ordered manner, the dif site being the very last to be segregated in the great majority of cells.
Monomeric Chromosomes Are Segregated Orderly.
The orderly segregation of the dif region is unlikely to be restricted to dimeric chromosomes; otherwise the loci in this region would have to segregate simultaneously in monomeric chromosomes, thus minimizing the number of three-foci cells with two foci of dif-proximal loci. To reject this hypothesis unambiguously, we inactivated RecA in cells carrying pairs of tagged loci, thereby preventing dimer formation (25, 26). RecA inactivation resulted in the appearance of about 3% dead cells (blue bars in Fig. 4 and Fig. S6H). Most living cells were of normal size and had two to four foci. The order of segregation between dif-proximal loci (ydeU and ydeP) and loci located about 100 kb (ydbC and ydgJ) or further away from dif (ycgY) was conserved compared with wild-type strains (green and red bars in Fig. 4; compare Fig. 4 with Figs. 2 and 3D and Fig. S5B). This result shows that ordered segregation is not restricted to chromosome dimers.
Fig. 4.

Segregation of ter in recA− strains. (A–C) Tagged loci are indicated in their position relative to dif (the black and white box). Red arrowheads indicate a parSpMT1 tag, and green arrowheads indicate a parSP1 tag. Cells were classified by the number of foci of each locus (shown in cartoons on the x-axis; the empty cell indicate cells that fall in none of the first four categories; blue bars indicate dead cells, see also Fig. S6). Bars show the mean percentage of each category in the population (y-axis) with individual measured ranges. Data reflect at least two independent experiments and 600 cells.
We then asked if the XerCD/dif complex is required for ordered segregation. As expected, inactivation of XerC resulted in the appearance of 10–15% dead cells and cells of abnormal shape (blue bars in Fig. S6 C and D). We then inactivated RecA in xerC− strains, thereby lowering the number of abnormal cells to few percent of the population (Fig. S6 E and F). In both xerC− and xerC−recA− strains, the order of segregation of the dif region was conserved in normal cells as compared with wild-type strains (Fig. S6 C–F). We conclude that the XerCD/dif system is not required for orderly segregation of the dif region.
FtsK Segregates the dif-Surrounding Region.
FtsK is an obvious candidate to play a direct role in an ordered segregation process ending at the dif site because it translocates chromosomal DNA toward dif using polarization of the KOPS motifs. We thus attempted to analyze ter segregation in ftsK mutants. We first inactivated translocation using the ftsKATP and Δ(ftsKC) alleles. Both mutations resulted in the appearance of 15–20% dead cells reflecting inactivation of chromosome dimer resolution (Fig. 5 A and B and Fig. S6 A and B). In addition, 50–60% of living cells were classified as abnormal (salmon bars in Fig. 5 and Fig. S6). These include cells of abnormal shape or length or that showed no fluorescent signal or an abnormal number of foci. These effects may be partially linked to a role of the translocase domain of FtsK in the control of cell division (21). It renders the analysis of foci number per cell in normal cells hazardous, because we cannot determine if it impoverished some cell categories more than others. Nevertheless, we noticed that ordered segregation of the dif region seemed to be lost because of the inactivation of translocation (red and blue bars in Fig. 5 A and B and Fig. S6 A and B). We then used the ftsKKOPSblind mutant, which shows a milder phenotype than translocation-deficient mutants and supports resolution of the largest part of chromosome dimers (20). The FtsKKOPSblind protein activates XerCD/dif recombination but translocates in a nonoriented manner in vivo and in vitro because of its defect in KOPS recognition (20, 27). As expected, ftsKKOPSblind strains showed very few abnormal or dead cells. The ratio of cells with duplicated foci of ter loci tended to decrease, suggesting that they segregated later because of the ftsKKOPSblind mutation (compare Fig. 5 and Fig. 3E). Strikingly, the order of the segregation of the ydcB and ydgJ loci compared with the dif site (ydeU and ydeP) was lost or was significantly altered as compared with wild-type strains (red and green bars in Fig. 5 A–D; compare with Fig. 3E and Fig. S5). However, the order of segregation between ycgY, which is outside the region of high FtsK activity (15), and the dif site (ydeU) was unaffected by the ftsKKOPSblind mutation (Fig. 5E). We conclude that the KOPS-oriented translocation activity of FtsK is required for the ordered segregation of a large (at least 210 kb) but restricted region around dif.
Fig. 5.

Segregation of ter in ftsK mutant strains. Tagged loci are indicated in their position relative to dif (the black and white box). Red arrowheads indicate a parSpMT1 tag, and green arrowheads indicate a parSP1 tag. (A) ftsKATP- strain. (B–F) ftsKKOPSblind strains. Cells were classified by the number of foci of each locus (shown in cartoons on the x-axis; the empty cell indicates cells that fall in none of the first four categories; blue bars indicate dead cells; see also Fig. S6). Bars show the mean percentage of each category in the population (y-axis) with individual measured ranges. Data reflect at least two independent experiments and 600 cells.
MatP Controls ter Segregation.
Because MatP delays ter segregation, we reasoned that its activity might be required for FtsK-dependent ordered segregation of ter. We inactivated MatP in cells carrying pairs of tagged loci and monitored their number of foci per cell. A small number of cells longer than wild-type cells and harboring more than four foci appeared in matP− strains, consistent with a mild defect in cell division caused by MatP inactivation (11). Among cells of normal size, the ratio of cells with four foci (i.e., with both loci segregated) increased in matP− strains compared with wild type (compare gray bars in Fig. 5 A and B with Fig. 3D), consistent with earlier segregation of ter loci as previously observed (11). Cells with three foci (red and green bars in Fig. 5 A and B) were underrepresented because of matP inactivation, indicating that the mean time separating segregation of the two loci (i.e., ydcB and ydeU) was shorter. Among these cells, no consistent order of segregation was detected between the ydcB and ydgJ foci and the dif site (ydeU and ydeP) (Fig. 5 A and B). The order of segregation in the dif-surrounding region thus was lost with MatP inactivation, showing that MatP is required for the ordered segregation of this region. Interestingly, a preferred order of segregation still was apparent between the ycgY locus and dif, although it was less pronounced than in wild-type cells (compare Fig. 5C and Fig. 2). The ycgY locus lies in the region covered by matS sites but not in the region processed by FtsK (see above). This result strongly suggests that MatP is required for ordered segregation only in the region processed by FtsK.
Discussion
We have established the pattern of the loss of colocalization of sister loci, a crucial step of segregation, of the ter chromosomal region in slow-growing E. coli cells. This investigation relied on an improved version of previously described loci visualization systems derived from the Par systems of plasmids P1 and pMT1. We produced the ParBP1-derived protein from a chromosome-borne construct and the ParBpMT1-derived protein from a low copy number plasmid, reasoning that this derivation should minimize both their background production and cell-to-cell variation. Indeed, the two ParB-derived systems and a TetR-derived system gave equivalent results when used to visualize the same loci, rendering these systems suitable for direct comparison of loci segregation patterns. In contrast, the use of previously described plasmids for production of ParBP1-derived proteins provoked delays in the segregation of the tagged loci. This effect varied with both growth conditions and the positions of the tagged loci on the chromosome and was significant in conditions used in previous studies, including ours (5, 8, 10, 11, 21, 24, 28). Previous reports of chromosome loci segregation using ParB-derived systems thus should be considered with care.
The ori-to-ter segregation pattern of the chromosome is highly accurate. Less than 1% cells segregated a ter locus before loci located outside ter (Fig. 2). Most interestingly, segregation of the dif-surrounding region also is precisely ordered. Indeed, the dif site is segregated later than loci 100 kb apart in more than 94% of the cells (Fig. 3); thus the whole chromosome segregates from the ori region to the dif site. This strict order of segregation strongly suggests that it occurs in most, if not all, cells and is not restricted to chromosome dimers. Indeed, if the order of segregation were restricted to chromosome dimers, then the loci in the ter region would have to segregate simultaneously in monomeric chromosomes, thus minimizing the number of-three foci cells with two foci of dif-proximal loci, an effect that seems most unlikely. In addition, neither the XerCD/dif system, which resolves dimers, nor RecA, which is strictly required for dimers, is required for ordered segregation of the dif region (Fig. 4 and Fig. S6), showing unambiguously that monomers are segregated in an ordered manner.
Segregation of the dif-surrounding region occurs during the late stages of the cell cycle. For instance, loci from ydgJ to ydbL have a mean number of foci per cell less than 1.15, indicating that they segregate in the last 40 min of the cell cycle (Fig. 3 and Fig. S1). At this stage, cells have terminated replication and are about to divide or are dividing. Divisome components, including FtsK, thus are assembled at midcell, (6). A role for FtsK in the ordered segregation of this region thus is consistent with the timing of its segregation. We verified this hypothesis using different FtsK mutants, including an allele deficient for KOPS recognition, and showing that the order of segregation of the dif-surrounding region is lost with these mutations (Fig. 5). This effect is observed in a region covering at least 210 kb (from ydcB to ydgJ) but does not affect the ycgY locus, 344 kb from dif. This result is fully consistent with the length of the region preferentially processed by FtsK, i.e., the region of high FtsK activity [338–468 kb centered on dif (15)]. We previously reported that ftsKKOPSblind cells are longer than wild-type cells, suggesting that this mutation delays cell division (20). This delay may modify the timing of the segregation of chromosome loci with respect to cell division and so might indirectly affect the accuracy of their segregation order. Our data argue against such an indirect effect because the ftsKKOPSblind mutation does not change the mean number of foci per cell of dif-proximal loci (compare gray bars in Figs. 3 and 5). In addition, the FtsKKOPSblind protein interacts with the same region and at comparable frequencies as FtsKwt when assayed by the frequency of XerCD/dif recombination (15). These data indicate that segregation of the dif-surrounding region remains temporally linked to cell division in the ftsKKOPSblind strain, suggesting that the FtsKKOPSblind protein still segregates this region although in a nonordered manner.
So far, FtsK has been shown to support chromosome segregation only in special conditions, the most frequent and best understood being the formation of chromosome dimers (19–21). Our results reveal that FtsK segregates the dif-surrounding region of monomeric chromosomes, although this activity is essential only in the case of dimers. This conclusion may appear contradictory, given the RecA-dependency of XerCD recombination between dif sites inserted at the dif locus (22). We currently have no explanation for this discrepancy. A specific processing of the dif locus on dimers remains possible. Alternatively, RecA may control the XerCD/dif recombination independently of the dimeric state of the chromosome. This latter hypothesis is supported by the RecA-dependency of recombination between plasmid-borne dif sites (29). A role for FtsK in the segregation of monomers also may contrast with the growth defect of translocation-deficient FtsK mutants, mainly because of their inability to resolve dimers (30). However, these mutations provoke many more cells of abnormal size or shape than seen with Xer inactivation (i.e., see Fig. S6), suggesting that most ftsKC− cells harboring chromosome monomers divide abnormally although they have viable progeny. This notion is consistent with FtsK having a role in coupling ter segregation with cell division even when chromosomes are monomeric.
Because FtsK is active only shortly before and during septum constriction (31, 32), FtsK-dependent ordered segregation requires that the dif-surrounding region be kept in the vicinity of the septum until FtsK is activated. This appears to be the role of MatP. Inactivation of MatP leads to earlier segregation of ter loci and loss of the ordered segregation in the dif-surrounding region (Fig. 6). MatP thus certainly allows FtsK to process the dif-surrounding region either by its intrinsic cohesin activity or by interacting with ZapB (10, 33). Interestingly, the region of high FtsK activity is shorter than the MatP-binding region. We have no explanation for this difference at present. However, we noticed that the density of matS sites is most important in a restricted region around dif (Fig. S7). This region, which corresponds to region of high FtsK activity in E. coli, may be processed by FtsK in most cells because of the density of its matS sites, whereas the adjacent regions may show important cell-to-cell variations in FtsK activity.
Fig. 6.

Segregation of ter in matP− strains. (A–C) Tagged loci are indicated in their position relative to dif (the black and white box). Red arrowheads indicate a parSpMT1 tag, and green arrowheads indicate a parSP1 tag. Cells were classified by the number of foci of each locus (shown in cartoons on the x-axis; the empty cell indicates cells that fall in none of the first four categories). Bars show the mean percentage of each category in the population (y-axis) with individual measured ranges. Data reflect at least two independent experiments and 600 cells.
FtsK has been shown to remove MatP from the DNA during translocation but stops at XerCD/dif complexes in vitro (34, 35). We thus assume that FtsK counteracts the effect of MatP by removing it from matS sites. In this case, FtsK would act to unzip sister ter regions. Whether it then transports DNA to daughter cells remains to be determined. MatP thus would have a role akin to a cohesin and FtsK to a separase, although the mechanisms involved differ significantly from those of eukaryotic cohesins and separases. In wild-type cells, the pattern of ordered segregation implies that MatP removal is sequential. The region of high FtsK activity may be translocated from its borders to dif in a processive manner. Alternatively, translocations over short distances may occur randomly but may promote segregation only when they dissociate the MatP/matS complexes furthest from dif. The rather long time separating segregation of ter loci (i.e., more than 5 min for loci 100 kb apart) compared with the speed of FtsK and SpoIIIE translocation in vitro and in vivo [at least 75 kb per min (36, 37)] favor this second hypothesis. In ftsKKOPSblind cells, the same process would occur but would last longer because the loss of the sequence of MatP removal delays cell division. In ftsKC− cells, MatP would not been removed by FtsK, leading to important defects in cell division. Nevertheless, most cells have viable progeny, indicating that the ter region is finally segregated by other means, possibly involving either passive or active packaging of the mostly segregated sister nucleoids. The colethality of FtsKC and MukB inactivation (19, 20) is consistent with this hypothesis.
Materials and Methods
Strains and Plasmids.
Strains used were derived from E. coli K12 strain LN2666 (W1485 F− leu thyA thi deoB or C supE rpsL (StR) (38) and are listed in Table S1. Plasmids used are listed in Table S2. Tagged chromosome loci are listed in Table S3.
Cell Imaging.
Cells were grown in M9 medium containing alanine as a carbon source (0.2%); thiamine (1 μg/mL), thymine (2 μg/mL), and leucine (2 μg/mL). After 48 h cultures were diluted 250 times in fresh medium and were grown to OD600 = 0.2 before being mounted on microscope slides. Arabinose (0.2%) or isopropylthio-β-galactoside (50 µM) were added 45 min before mounting, and FM4-64 membrane dye was added 5 min before mounting. Cells were applied to a 1% agarose slide and placed in the microscope temperature-controlled box at 30 °C for at least 30 min before observation on a Ti-E inverted microscope (Nikon) carrying a 100× oil-immersion lens (N.A. 1.36) and a Hamamatsu ORCA-R2 camera. Images were acquired using NIS Elements AR 3.2 software (Nikon) and were converted for manual analysis with MetaMorph v. 7.0 software (Molecular Devices) using a pencil pad.
Supplementary Material
Acknowledgments
We thank J.-Y. Bouet and the members of the team for critical reading and helpful discussions; C. Lesterlin for help with flow cytometry experiments; and J.-Y. Bouet and the National BioResource Project-E. coli at the National Institute of Genetics (Japan) for the gift of strains. This work was funded by the Centre National de la Recherche Scientifique, University Paul Sabatier, Agence Nationale de la Recherche contract BLAN-1327-01, the Fonds Européen de Développement Régional Midi-Pyrénées, and the Fondation ARC pour la Recherche sur le Cancer. M.S. was supported by a fellowship from the Ministère de l’Enseignement Supérieur et de la Recherche and an European Molecular Biology Organization short-term fellowship.
Footnotes
The authors declare no conflict of interest.
This article is a PNAS Direct Submission.
This article contains supporting information online at www.pnas.org/lookup/suppl/doi:10.1073/pnas.1304080110/-/DCSupplemental.
References
- 1.Possoz C, Junier I, Espeli O. Bacterial chromosome segregation. Front Biosci. 2012;17:1020–1034. doi: 10.2741/3971. [DOI] [PubMed] [Google Scholar]
- 2.Reyes-Lamothe R, Nicolas E, Sherratt DJ. Chromosome replication and segregation in bacteria. Annu Rev Genet. 2012;46:121–143. doi: 10.1146/annurev-genet-110711-155421. [DOI] [PubMed] [Google Scholar]
- 3.Toro E, Shapiro L. Bacterial chromosome organization and segregation. Cold Spring Harb Perspect Biol. 2010;2(2):a000349. doi: 10.1101/cshperspect.a000349. [DOI] [PMC free article] [PubMed] [Google Scholar]
- 4.Touzain F, Petit MA, Schbath S, El Karoui M. DNA motifs that sculpt the bacterial chromosome. Nat Rev Microbiol. 2011;9(1):15–26. doi: 10.1038/nrmicro2477. [DOI] [PubMed] [Google Scholar]
- 5.Li Y, Youngren B, Sergueev K, Austin S. Segregation of the Escherichia coli chromosome terminus. Mol Microbiol. 2003;50(3):825–834. doi: 10.1046/j.1365-2958.2003.03746.x. [DOI] [PubMed] [Google Scholar]
- 6.Wang X, Possoz C, Sherratt DJ. Dancing around the divisome: Asymmetric chromosome segregation in Escherichia coli. Genes Dev. 2005;19(19):2367–2377. doi: 10.1101/gad.345305. [DOI] [PMC free article] [PubMed] [Google Scholar]
- 7.Bates D, Kleckner N. Chromosome and replisome dynamics in E. coli: Loss of sister cohesion triggers global chromosome movement and mediates chromosome segregation. Cell. 2005;121(6):899–911. doi: 10.1016/j.cell.2005.04.013. [DOI] [PMC free article] [PubMed] [Google Scholar]
- 8.Espeli O, Mercier R, Boccard F. DNA dynamics vary according to macrodomain topography in the E. coli chromosome. Mol Microbiol. 2008;68(6):1418–1427. doi: 10.1111/j.1365-2958.2008.06239.x. [DOI] [PubMed] [Google Scholar]
- 9.Meile JC, et al. The terminal region of the E. coli chromosome localises at the periphery of the nucleoid. BMC Microbiol. 2011;11(1):28. doi: 10.1186/1471-2180-11-28. [DOI] [PMC free article] [PubMed] [Google Scholar]
- 10.Espéli O, et al. A MatP-divisome interaction coordinates chromosome segregation with cell division in E. coli. EMBO J. 2012;31(14):3198–3211. doi: 10.1038/emboj.2012.128. [DOI] [PMC free article] [PubMed] [Google Scholar]
- 11.Mercier R, et al. The MatP/matS site-specific system organizes the terminus region of the E. coli chromosome into a macrodomain. Cell. 2008;135(3):475–485. doi: 10.1016/j.cell.2008.08.031. [DOI] [PubMed] [Google Scholar]
- 12.Lesterlin C, Barre FX, Cornet F. Genetic recombination and the cell cycle: What we have learned from chromosome dimers. Mol Microbiol. 2004;54(5):1151–1160. doi: 10.1111/j.1365-2958.2004.04356.x. [DOI] [PubMed] [Google Scholar]
- 13.Bigot S, Sivanathan V, Possoz C, Barre FX, Cornet F. FtsK, a literate chromosome segregation machine. Mol Microbiol. 2007;64(6):1434–1441. doi: 10.1111/j.1365-2958.2007.05755.x. [DOI] [PubMed] [Google Scholar]
- 14.Sherratt DJ, Arciszewska LK, Crozat E, Graham JE, Grainge I. The Escherichia coli DNA translocase FtsK. Biochem Soc Trans. 2010;38(2):395–398. doi: 10.1042/BST0380395. [DOI] [PubMed] [Google Scholar]
- 15.Deghorain M, et al. A defined terminal region of the E. coli chromosome shows late segregation and high FtsK activity. PLoS ONE. 2011;6(7):e22164. doi: 10.1371/journal.pone.0022164. [DOI] [PMC free article] [PubMed] [Google Scholar]
- 16.Bigot S, et al. KOPS: DNA motifs that control E. coli chromosome segregation by orienting the FtsK translocase. EMBO J. 2005;24(21):3770–3780. doi: 10.1038/sj.emboj.7600835. [DOI] [PMC free article] [PubMed] [Google Scholar]
- 17.Levy O, et al. Identification of oligonucleotide sequences that direct the movement of the Escherichia coli FtsK translocase. Proc Natl Acad Sci USA. 2005;102(49):17618–17623. doi: 10.1073/pnas.0508932102. [DOI] [PMC free article] [PubMed] [Google Scholar]
- 18.Sivanathan V, et al. The FtsK gamma domain directs oriented DNA translocation by interacting with KOPS. Nat Struct Mol Biol. 2006;13(11):965–972. doi: 10.1038/nsmb1158. [DOI] [PMC free article] [PubMed] [Google Scholar]
- 19.Yu XC, Weihe EK, Margolin W. Role of the C terminus of FtsK in Escherichia coli chromosome segregation. J Bacteriol. 1998;180(23):6424–6428. doi: 10.1128/jb.180.23.6424-6428.1998. [DOI] [PMC free article] [PubMed] [Google Scholar]
- 20.Sivanathan V, et al. KOPS-guided DNA translocation by FtsK safeguards Escherichia coli chromosome segregation. Mol Microbiol. 2009;71(4):1031–1042. doi: 10.1111/j.1365-2958.2008.06586.x. [DOI] [PMC free article] [PubMed] [Google Scholar]
- 21.Lesterlin C, Pages C, Dubarry N, Dasgupta S, Cornet F. Asymmetry of chromosome Replichores renders the DNA translocase activity of FtsK essential for cell division and cell shape maintenance in Escherichia coli. PLoS Genet. 2008;4(12):e1000288. doi: 10.1371/journal.pgen.1000288. [DOI] [PMC free article] [PubMed] [Google Scholar]
- 22.Pérals K, et al. Interplay between recombination, cell division and chromosome structure during chromosome dimer resolution in Escherichia coli. Mol Microbiol. 2001;39(4):904–913. doi: 10.1046/j.1365-2958.2001.02277.x. [DOI] [PubMed] [Google Scholar]
- 23.Nielsen HJ, Ottesen JR, Youngren B, Austin SJ, Hansen FG. The Escherichia coli chromosome is organized with the left and right chromosome arms in separate cell halves. Mol Microbiol. 2006;62(2):331–338. doi: 10.1111/j.1365-2958.2006.05346.x. [DOI] [PubMed] [Google Scholar]
- 24.Nielsen HJ, Li Y, Youngren B, Hansen FG, Austin S. Progressive segregation of the Escherichia coli chromosome. Mol Microbiol. 2006;61(2):383–393. doi: 10.1111/j.1365-2958.2006.05245.x. [DOI] [PubMed] [Google Scholar]
- 25.Steiner WW, Kuempel PL. Cell division is required for resolution of dimer chromosomes at the dif locus of Escherichia coli. Mol Microbiol. 1998;27(2):257–268. doi: 10.1046/j.1365-2958.1998.00651.x. [DOI] [PubMed] [Google Scholar]
- 26.Pérals K, Cornet F, Merlet Y, Delon I, Louarn JM. Functional polarization of the Escherichia coli chromosome terminus: The dif site acts in chromosome dimer resolution only when located between long stretches of opposite polarity. Mol Microbiol. 2000;36(1):33–43. doi: 10.1046/j.1365-2958.2000.01847.x. [DOI] [PubMed] [Google Scholar]
- 27.Nolivos S, Pages C, Rousseau P, Le Bourgeois P, Cornet F. Are two better than one? Analysis of an FtsK/Xer recombination system that uses a single recombinase. Nucleic Acids Res. 2010;38(19):6477–6489. doi: 10.1093/nar/gkq507. [DOI] [PMC free article] [PubMed] [Google Scholar]
- 28.Liu X, Wang X, Reyes-Lamothe R, Sherratt D. Replication-directed sister chromosome alignment in Escherichia coli. Mol Microbiol. 2010;75(5):1090–1097. doi: 10.1111/j.1365-2958.2009.06791.x. [DOI] [PMC free article] [PubMed] [Google Scholar]
- 29.Recchia GD, Aroyo M, Wolf D, Blakely G, Sherratt DJ. FtsK-dependent and -independent pathways of Xer site-specific recombination. EMBO J. 1999;18(20):5724–5734. doi: 10.1093/emboj/18.20.5724. [DOI] [PMC free article] [PubMed] [Google Scholar]
- 30.Capiaux H, Lesterlin C, Pérals K, Louarn JM, Cornet F. A dual role for the FtsK protein in Escherichia coli chromosome segregation. EMBO Rep. 2002;3(6):532–536. doi: 10.1093/embo-reports/kvf116. [DOI] [PMC free article] [PubMed] [Google Scholar]
- 31.Steiner W, Liu G, Donachie WD, Kuempel P. The cytoplasmic domain of FtsK protein is required for resolution of chromosome dimers. Mol Microbiol. 1999;31(2):579–583. doi: 10.1046/j.1365-2958.1999.01198.x. [DOI] [PubMed] [Google Scholar]
- 32.Kennedy SP, Chevalier F, Barre FX. Delayed activation of Xer recombination at dif by FtsK during septum assembly in Escherichia coli. Mol Microbiol. 2008;68(4):1018–1028. doi: 10.1111/j.1365-2958.2008.06212.x. [DOI] [PubMed] [Google Scholar]
- 33.Dupaigne P, et al. Molecular basis for a protein-mediated DNA-bridging mechanism that functions in condensation of the E. coli chromosome. Mol Cell. 2012;48(4):560–571. doi: 10.1016/j.molcel.2012.09.009. [DOI] [PMC free article] [PubMed] [Google Scholar]
- 34.Graham JE, Sivanathan V, Sherratt DJ, Arciszewska LK. FtsK translocation on DNA stops at XerCD-dif. Nucleic Acids Res. 2010;38(1):72–81. doi: 10.1093/nar/gkp843. [DOI] [PMC free article] [PubMed] [Google Scholar]
- 35.Bonné L, Bigot S, Chevalier F, Allemand JF, Barre FX. Asymmetric DNA requirements in Xer recombination activation by FtsK. Nucleic Acids Res. 2009;37(7):2371–2380. doi: 10.1093/nar/gkp104. [DOI] [PMC free article] [PubMed] [Google Scholar]
- 36.Saleh OA, Pérals C, Barre FX, Allemand JF. Fast, DNA-sequence independent translocation by FtsK in a single-molecule experiment. EMBO J. 2004;23(12):2430–2439. doi: 10.1038/sj.emboj.7600242. [DOI] [PMC free article] [PubMed] [Google Scholar]
- 37.Burton BM, Marquis KA, Sullivan NL, Rapoport TA, Rudner DZ. The ATPase SpoIIIE transports DNA across fused septal membranes during sporulation in Bacillus subtilis. Cell. 2007;131(7):1301–1312. doi: 10.1016/j.cell.2007.11.009. [DOI] [PMC free article] [PubMed] [Google Scholar]
- 38.Cornet F, Mortier I, Patte J, Louarn JM. Plasmid pSC101 harbors a recombination site, psi, which is able to resolve plasmid multimers and to substitute for the analogous chromosomal Escherichia coli site dif. J Bacteriol. 1994;176(11):3188–3195. doi: 10.1128/jb.176.11.3188-3195.1994. [DOI] [PMC free article] [PubMed] [Google Scholar]
Associated Data
This section collects any data citations, data availability statements, or supplementary materials included in this article.