

Abstract
Activation of mammalian target of rapamycin 1 (mTORC1) by nutrients, insulin and leptin leads to appetite suppression (anorexia). Contrastingly, increased AMP-activated protein kinase (AMPK) activity by ghrelin promotes appetite (orexia). However, the interplay between these mechanisms remains poorly defined. The relationship between the anorexigenic hormones, insulin and leptin, and the orexigenic hormone, ghrelin, on mTORC1 signalling was examined using S6 kinase phosphorylation as a marker for changes in mTORC1 activity in mouse hypothalamic GT1-7 cells. Additionally, the contribution of AMPK and mTORC1 signalling in relation to insulin-, leptin- and ghrelin-driven alterations to mouse hypothalamic agouti-related protein (AgRP) mRNA levels was examined. Insulin and leptin increase mTORC1 activity in a phosphoinositide-3-kinase (PI3K)- and protein kinase B (PKB)-dependent manner, compared to vehicle controls, whereas increasing AMPK activity inhibits mTORC1 activity and blocks the actions of the anorexigenic hormones. Ghrelin mediates an AMPK-dependent decrease in mTORC1 activity and increases hypothalamic AgRP mRNA levels, the latter effect being prevented by insulin in an mTORC1-dependent manner. In conclusion, mTORC1 acts as an integration node in hypothalamic neurons for hormone-derived PI3K and AMPK signalling and mediates at least part of the assimilated output of anorexigenic and orexigenic hormone actions in the hypothalamus.
Key Words: Ghrelin, Leptin, Insulin, AgRP, Hypothalamus, AMP-activated protein kinase
Introduction
Dysregulation of appetite or loss of caloric sensing can have a major impact on health and quality of life. When appetite suppression is blunted, obesity and associated comorbidities ensue [1]. Alternatively in conditions such as cancer, sepsis and ageing, appetite is suppressed, which exacerbates the associated cachexia/sarcopenia [2]. Considering the worldwide projections for obesity and the ageing population, it is vital to understand the molecular mechanisms regulating appetite and energy metabolism as this information may yield suitable pharmacological targets for the treatment of obesity and wasting. Energy homeostasis is maintained, in part, through regulation of body fat stores via feedback signals arising from fat depots that are sensed by neurons in the hypothalamus. For example, leptin and insulin, made and released from adipocytes and pancreatic beta cells, respectively, circulate in proportion to body fat levels and access the basomedial hypothalamus via specialized uptake systems [3, 4]. In contrast, ghrelin, an orexigenic hormone, is produced predominantly in the stomach and readily transported into the hypothalamus, although ghrelin is also ex-pressed and released by a small population of hypothalamic neurons potentially allowing a local, fine control of neuronal function [5]. These hormones control food intake and energy balance by regulating orexigenic and anorexigenic peptide levels and release by neurons in the arcuate nucleus (ARC) of the hypothalamus [3, 6]. Insulin and leptin suppress expression of orexigenic agouti-related peptide (AgRP) and neuropeptide Y (NPY) and promote anorexigenic pro-opiomelanocortin (POMC)-derived peptide production. Conversely ghrelin, which increases appetite and fat deposition, increases NPY and AgRP and reduces POMC neuropeptide expression and release, respectively [5, 7].
The precise mechanisms involved in the regulation of hypothalamic peptide expression and release remain to be fully determined. Recent studies have indicated a key role for the class 1A phosphoinositide-3-kinases (PI3Ks) in the signalling cascades linking leptin and insulin with modulation of ARC neuron neuropeptide expression and electrical activity [3, 4]. Thus, PI3K is an important integration node for leptin and insulin action on ARC neurons. However, the role of downstream mediators and the contributions of additional signalling pathways that act to modify PI3K-driven outputs in ARC neurons are unclear. An important signalling component downstream from PI3K in the hypothalamus is the mammalian target of rapamycin complex 1 (mTORC1), which activates the S6 kinases (S6K1 and S6K2). Refeeding-, amino acid- or leptin treatment increases ARC mTORC1-S6K activity in association with appetite suppression, actions attenuated by the specific mTORC1 inhibitor, rapamycin [8, 9]. Furthermore, mTORC1 activity is predominantly located to the ARC and highly colocalized to leptin receptor-expressing NPY/AgRP and, to a lesser extent, POMC neurons [8, 9]. These data are consistent with ARC mTORC1-S6K activity involvement in anorexigenic signalling. Indeed, recent studies have demonstrated that decreased hypothalamic mTORC1-S6K signalling is causally linked to diet-induced obesity and leptin resistance [10, 11, 12]. However, mice globally deficient in S6K are lean, insulin sensitive and resistant to obesity induced by high-fat diets [13]. This may be explained by the observation that hyperactive mTORC1 activity in liver and muscle is associated with insulin resistance and metabolic dysfunction [14, 15]. Taken together, these data indicate that dysregulated mTORC1 activity either centrally or peripherally has significant consequences for metabolic status, with the final outcome also dependent on the site of modification.
Ghrelin stimulates food intake by acting as an agonist on the growth hormone secretagogue receptor 1a (GHSR1a) within the hypothalamus [16, 17]. Central administration of ghrelin increases ARC AgRP and NPY mRNA levels and induces c-fos and Egr-1 in NPY/AgRP ARC neurons, indicative of increased neuronal activity [7, 18, 19]. The appetite-promoting effects of peripheral and central ghrelin treatment have largely been attributed to stimulation of AMP-activated protein kinase (AMPK), an enzyme activated during fuel deficiency to promote catabolic and inhibit anabolic pathways [20, 21]. Indeed, hypothalamic expression of a constitutively active form of AMPK or direct pharmacological activation of hypothalamic AMPK using the AMP analogue, AICAR, increases food intake and expression of AgRP and NPY mRNA [20, 22]. Importantly, AMPK activation inhibits mTORC1 activity in a variety of cell types [23]. However, it is unclear whether ghrelin-mediated induction of hypothalamic AgRP/NPY gene expression involves AMPK and/or mTORC1 signalling. It is also uncertain whether mTORC1 is a downstream signalling node in hypothalamic neurons, capable of integrating anorexigenic and orexigenic signals through AMPK and PI3K pathways to mediate control of orexigenic neuropeptides. Therefore, we used the mouse hypothalamic GT1-7 cell line to investigate the interaction between anorexigenic (leptin and insulin) and orexigenic (ghrelin) hormone signalling on mTORC1 activity and mouse hypothalamic basomedial tissue sections to determine whether these signalling processes are involved in hormone-mediated changes in AgRP mRNA expression.
Materials and Methods
Cell Culture
The mouse-derived hypothalamic GT1-7 cell line was maintained in Dulbecco's modified Eagle's medium (Sigma-Aldrich, Dorset, UK) supplemented with 10% fetal bovine serum (PAA Laboratories, Yeovil, UK) as described previously [24].
Immunoblotting
Confluent GT1-7 cells, in 6-well dishes, were serum starved for 3 h prior to hormone: leptin 50 nM (R&D Systems, Abingdon, UK), insulin 50 nM (Novo Nordisk, Crawley, UK), or ghrelin 100 nM (Tocris Bioscience, Bristol, UK) and/or drug: wortmannin 100 nM (Sigma-Aldrich, Gillingham, UK), LY294002 10 μM, Akti 10 μM, rapamycin 100 nM, compound C 40 μM, STO-609 10 μM (all Merck Chemicals Ltd., Nottingham, UK) and A-769662 50 μM (Ascent Scientific, Bristol, UK) treatment for various times, as described in the Results section. All drugs were dissolved in saline or 0.1% DMSO, unless otherwise stated. Total protein lysates from the cells were subjected to SDS-PAGE, electrotransferred to a nitrocellulose membrane. Non-specific protein binding sites were blocked by a 60-min incubation in 5% (w/v) skimmed milk in Tris-buffered saline supplemented with 0.5% (v/v) Tween 20. The membrane was then incubated overnight at 4°C using 5% milk solution supplemented with the appropriate primary antibody. Following three washes with 5% milk solution, the membranes were incubated with 5% milk solution supplemented with horseradish peroxidase-conjugated anti-IgG antibody (Fisher Scientific, UK) for 60 min at room temperature. After three further washes with 5% milk solution and two washes with Tris-buffered saline, the immunoreactive proteins were identified by enhanced chemiluminescence (GE Healthcare, UK). Primary antibodies used were: p-S6K (p85 S6K (Thr412) and p70 S6K (Thr389); 1:1,000), p-AMPKα (Thr172; 1:1,000), p-ACC (Ser79; 1:1,000), ACC (1:1,000) all from New England Biolabs, Hitchin, UK; S6K (1:1,000; Cambridge Bioscience, Cambridge, UK), Actin (1:5,000; Sigma-Aldrich) and AMPKα1 (1:5,000) and AMPKα2 (1:10,000), both of which were kind gifts from Grahame Hardie (University of Dundee). Protein bands on gels were quantified by densitometry using Aida Image Data Analyzer software (version 3), where total density was determined with respect to constant area, background was subtracted and average relative band density was calculated. Phosphoprotein levels are presented as normalized values in relation to control and as a ratio of non-phosphorylated total levels at equivalent time points.
AMPK Activity Assay
GT1-7 cells were serum starved for 3 h, prior to stimulation with either 100 nM ghrelin or 50 μM A-769662 for 30 min. The cells were washed twice with PBS and lysed in lysis buffer (50 mM Tris-HCl pH 7.5, 150 mM NaCl, 50 mM NaF, 5 mM NaPPi, 1 mM EDTA, 1 mM EGTA, 1 mM DTT, 0.1 mM benzamidine, 0.1 nM PMSF, 5 μg/ml soyabean trypsin inhibitor, 1% (v/v) Triton X-100), with insoluble debris removed by centrifugation and the protein content determined (BCA assay, Thermo Scientific). AMPK activity was determined as previously described [25]. AMPK activity was calculated using the difference of the counts between AMARA (AMPK substrate: AMARAASAAALARRR) containing and AMARA-negative samples and calculated as nanomoles of ATP incorporated per minute per milligram of sample peptide. Data represented are normalized to control and are the average of 4–6 independent experiments with 3 replicates in each experiment.
Calcium Imaging
GT1-7 cells were serum starved for 3 h prior to calcium imaging using a conventional MetaMorph imaging system (Universal Imaging Corporation, Marlow, UK) with a Zeiss Axiovert 200 inverted epifluorescence microscope equipped with a ×40 oil immersion objective. Cells were loaded with fura-2 AM (Sigma-Aldrich) for 45 min at 37°C in dark conditions in incubation medium containing 135 mM NaCl, 5 mM KCl, 1 mM MgCl2, 2.5 mM glucose, 10 mM leucine, 1 mM CaCl2, 10 mM HEPES, pH 7.4). Cells were maintained at 35°C and selected for measurement by placement of Triton-X100 regions of interest around their somata. The fluorescence emission at 510 nm was collected for alternating excitations at 340 and 380 nm and expressed as a ratio of emission fluorescence (340/380 nm). The ratiometric images were collected at 5- to 30-second intervals. This was increased to 2-second intervals during the first 5 min of drug application. Data from 7 separate experiments were derived from the somata of 5–15 cells within a field and are presented as percentage of change in fluorescent ratio, which is proportional to the intracellular calcium concentration.
Electrophysiology
GT1-7 cells were superfused at room temperature (22–25°C) with normal saline (135 mM NaCl, 5 mM KCl, 1 mM MgCl2, 1 mM CaCl2, 10 mM Hepes, 2.5 mM glucose and 1 mML-leucine, pH 7.4). Recordings were made using borosilicate glass pipettes (5–10 MΩ) containing 140 mM KCl, 5 mM MgCl2, 3.8 mM CaCl2, 10 mM Hepes and 10 mM EGTA (pH 7.2). Perforated patch recordings were achieved by the addition of 25–40 μM amphotericin B (Sigma-Aldrich) to the pipette solution. Following a minimum of 10 min of stable recording, 100 nM ghrelin was applied by bath superfusion.
Preparation of Mouse Hypothalamic Slices and Measurement of AgRP Gene Expression
Male or female adult C57BL6/J mice were maintained on a 12-hour light-dark cycle with free access to water and chow. All animal care protocols and procedures were performed in accordance to the Animal Scientific Procedures Act (1986) and with approval of the University of Dundee Animal Ethics Committee. Animals were fasted for 1 h prior to experiments. The preparation of hypothalamic slices was as previously described [24]. In brief, horizontal 400-μm coronal brain slices were prepared using a Vibratome (Intracel, Royston, UK) and hypothalamic ARC wedges were cut and incubated in aCSF ± A-769662 (50 μM), ghrelin (100 nM), insulin (50 nM) or leptin (50 nM) ± rapamycin (100 nM) or compound C (40 μM), or combinations thereof, for 3 h. Following tissue homogenization and RNA isolation, reverse transcription-PCR was performed using Superscript II (Life Technologies, Paisley, UK) and random primers. AgRP gene expression was then assayed by real-time PCR using a premixed mouse AgRP primer-probe set purchased from Applied Biosystems (Foster City, Calif., USA).
Statistics
Comparisons between groups were made by the unpaired or paired 2-tailed Student's t test, one-sample t test or analysis of variance with repeated measures and Bonferroni post-test analysis, as appropriate. Values represent mean ± SEM. p values ≤ 0.05 were considered statistically significant.
Results
Insulin and Leptin Increase S6K Phosphorylation Levels in GT1-7 Cells
To explore the mechanisms by which leptin, insulin and ghrelin alter mTORC1 signalling, we utilized changes in S6K phosphorylation (p-S6K) levels as a surrogate marker for mTORC1 activity in GT1-7 cells. Previous studies have shown that leptin and insulin increase activity through the PI3K signalling pathway in these cells [24] and that regulation of PI3K-dependent signalling is important for modulation of mTORC1-dependent S6K activity [26]. Immunoblots for pS6K generally exhibit two bands; the upper band represents p-85 S6K (Thr412) and the lower band p-70 S6K (Thr389). Control experiments demonstrated that leptin and insulin do not alter total levels of S6K over this time period (data not shown), whereas both hormones increase p-S6K levels (fig. 1a, b).
Fig. 1.
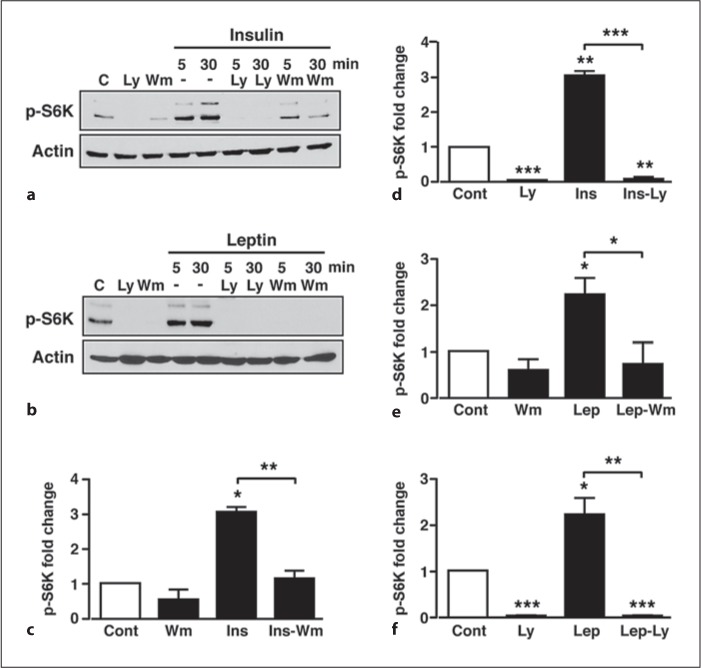
PI3K signalling mediates increased S6K phosphorylation by insulin and leptin in GT1-7 cells. a Representative immunoblots for S6K in GT1-7 cells in response to 50 nM insulin, 10 μM LY294002 (Ly) and 100 nM wortmannin (Wm) alone and to insulin in the presence of LY294002 or wortmannin. C = Control. b Representative immunoblot of p-S6K in response to 50 nM leptin, 10 μM LY294002 and 100 nM wortmannin alone and to leptin in the presence of LY294002 or wortmannin. C = Control. c, d Mean normalized p-S6K under non-stimulated conditions (Cont), insulin (Ins), wortmannin and LY294002, and insulin in the presence of wortmannin (Ins-Wm) and LY294002 (Ins-Ly) at time point 30 min. e, f Mean normalized p-S6K under non-stimulated conditions (Cont), leptin (Lep), wortmannin and LY294002, and leptin in the presence of wortmannin (Lep-Wm) and LY294002 (Lep-Ly) at time point 30 min. n = 3–6 for each condition. Values are mean ± SEM. * p < 0.05; ** p < 0.01; *** p < 0.001.
In order to confirm a role for PI3K in leptin- and insulin-induced S6K phosphorylation, GT1-7 cells were pre-treated with vehicle or the PI3K inhibitors, wortmannin (100 nM) or LY294002 (10 μM) for 20 min prior to leptin or insulin stimulation (in the continued presence of inhibitor or vehicle). Basal S6K phosphorylation was not significantly affected by wortmannin, whereas LY294002 almost completely suppressed basal p-S6K (fig. 1a–f). Both inhibitors were effective blockers of the insulin- (fig. 1a, c, e) and leptin- (fig. 1b, d, f) mediated increase in p-S6K. The ability of LY294002 to suppress p-S6K more than wortmannin may be due to this concentration of LY294002 directly inhibiting mTORC1 activity more than 100 nM wortmannin [27, 28]. Increased mTORC1 activity elicited by growth factors is reported to be dependent on PI3K signalling through the PKB/Akt pathway [29]. Therefore, to determine whether insulin and leptin utilize this pathway, GT1-7 cells were pre-incubated (as above) with the selective PKB inhibitor Akti [30] or the highly selective mTORC1 inhibitor, rapamycin [28]. The PKB inhibitor, Akti (10 μM), prevented the insulin- (fig. 2a, c) and leptin-mediated (fig. 2b, d) increases in p-S6K, with the inhibitor having no significant effect on basal p-S6K. In contrast, 100 nM rapamycin abolished basal, insulin- and leptin-induced S6K phosphorylation (fig. 2e–h). Thus, leptin and insulin increase S6K phosphorylation in GT1-7 cells, utilizing a pathway that depends upon the activity of the PI3K-PKB-mTORC1 pathway.
Fig. 2.
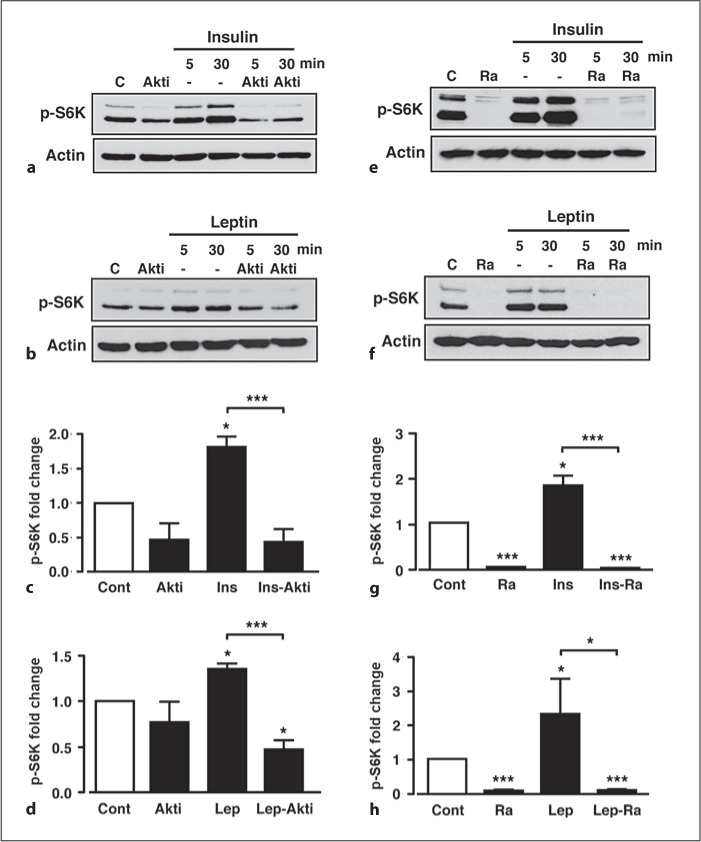
Increased p-S6K by insulin and leptin is PKB- and mTORC1-dependent. Representative immunoblots for p-S6K under control conditions (C), 10 μM Akti (Akti) and 50 nM insulin (a) or 50 nM leptin (b) in the absence and presence of Akti. Mean normalized p-S6K under non-stimulated conditions (Cont), Akti, and insulin in the absence (Ins) and presence (Ins-Akti) of Akti (c) and leptin (d) in the absence (Lep) and presence (Lep-Akti) of Akti at the 30-min time point. Representative immunoblots for p-S6K under control conditions, 100 nM rapamycin (Ra) and in response to 50 nM insulin (e) or 50 nM leptin (f) in the absence and presence of rapamycin. Mean normalized p-S6K under non-stimulated conditions (Cont), rapamycin (Ra), and insulin (g) in the absence and presence of rapamycin (Ins-Ra) and leptin (h) in the absence and presence of rapamycin (Lep-Ra) at the 30-min time point. n = 3 or 4 for each condition. Values are mean ± SEM. * p < 0.05; *** p < 0.001.
Modulation of AMPK by A-769662 or Ghrelin Leads to an Inhibition of mTORC1 Signalling
Raised hypothalamic AMPK activity increases AgRP mRNA expression levels concomitant with increased food intake [22]. Importantly, a recent study has demonstrated that the orexigenic effect of ghrelin is mediated by an AMPK-dependent increase in AgRP and NPY mRNA expression [31]. However, the modulation of hypothalamic mTORC1 activity by AMPK and ghrelin has not been fully investigated and little is known regarding this signalling pathway in relation to orexigenic peptide expression. Exposure of GT1-7 cells to the direct activator of AMPK, A-769662 (50 μM), caused a rapid increase in AMPK phosphorylation (p-AMPK) that was sustained for at least 60 min, with no effect on total AMPK (fig. 3a, b). This action of A-769662 correlated with a parallel increase in the phosphorylation of the AMPK downstream effector, acetyl-CoA carboxylase (p-ACC), indicating increased activity of AMPK (fig. 3a, c). Consistent with a model where AMPK inhibits mTORC1 signalling, A-769662 attenuated basal p-S6K in a time-dependent manner (fig. 3a, d), which paralleled the A-769662-mediated AMPK phosphorylation, with no effect on total S6K protein levels (fig. 3a). Insulin and leptin, over this time period and under the experimental conditions used here, had no effect on p-AMPK, p-ACC or total ACC (data not shown). In contrast, ghrelin (100 nM) increased p-AMPK and p-ACC in GT1-7 cells (fig. 4a–c), although the magnitude of this response was considerably less than with A-769662, with no effect on total AMPK (fig. 4a). Furthermore, in direct AMPK activity assays, ghrelin significantly increased α1-and α2-AMPK activity, also to a much smaller extent than that obtained by 50 μM A-769662 (fig. 4d), mirroring the immunoblot data. Combined, these data are consistent with ghrelin acting to elevate AMPK activity in GT1-7 cells.
Fig. 3.
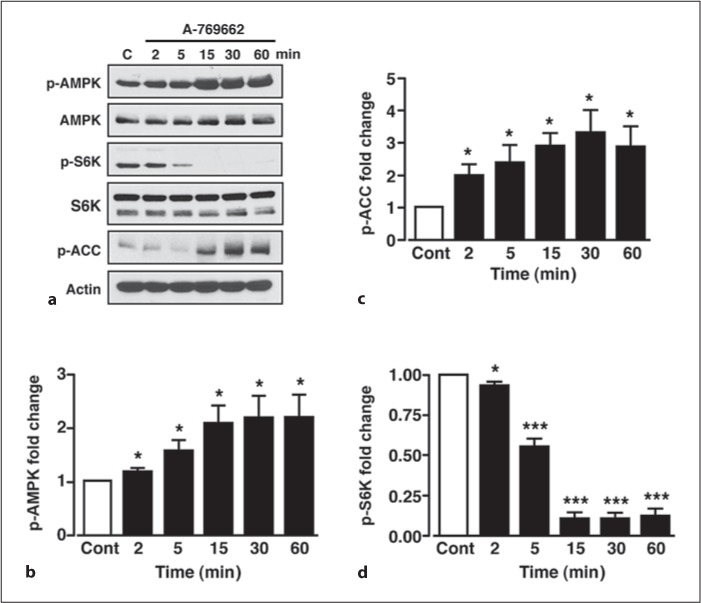
A-769662 increases AMPK activity concomitant with reduced p-S6K. a Representative immunoblots for p-AMPK, total AMPK, p-S6K, total S6K, p-ACC and actin under control conditions (C) and in response to 50 μM A-769662 at various time points. b Mean normalized p-AMPK under non-stimulated conditions (Cont) and after stimulation with A-769662. Mean normalized p-ACC (c) and p-S6K (d) under non-stimulated conditions (Cont) and after stimulation with A-769662. n = 5–6 for each condition. Values are means ± SEM. * p < 0.05; *** p < 0.001.
Fig. 4.
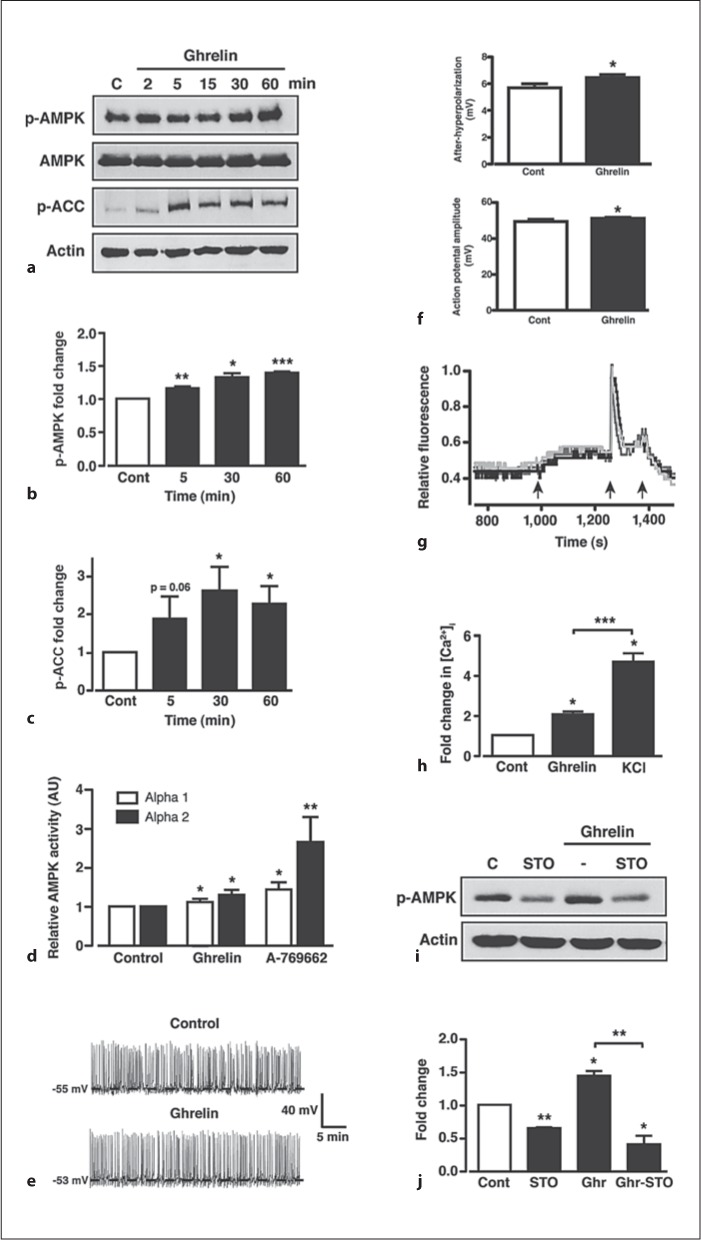
Ghrelin increases AMPK activity in GT1-7 cells via increased CaMKK2. a Representative immunoblots for p-AMPK, total AMPK, p-ACC and actin under control conditions (C) and in response to 100 nM ghrelin. Mean normalized p-AMPK (b) and p-ACC (c) under non-stimulated conditions (Cont) and after stimulation with ghrelin. d Mean normalized AMPK-α1 and -α2 subunit activity under non-stimulated conditions (Cont) and following 30 min stimulation with 100 nM ghrelin or 50 μM A-769662. e Representative perforated patch clamp recording (I = 0 pA) from a GT1-7 cell under control conditions and following application of 100 nM ghrelin. f Mean action potential and afterhyperpolarization amplitudes (n = 75 from 5 cells) under control (saline) conditions and following application of ghrelin (100 nM). g Representative traces from 3 separate GT1-7 cells showing the change in relative fluorescence (internal calcium concentration) under control conditions and following application (sequential arrows) of 100 nM ghrelin, 100 mM KCl and 5 mM EGTA, respectively. h Mean normalized change in [Ca2+]i under control conditions (Cont) and following application of ghrelin and KCl. i Representative immunoblot for p-AMPK under control (C) conditions, 10 μM STO-609 (STO) and in response to 100 nM ghrelin in the absence and presence of STO-609. j Mean normalized p-AMPK under non-stimulated conditions (Cont), STO-609 alone and ghrelin in the absence and presence of STO-609. n = 3–7 for each condition. Values are means ± SEM. * p < 0.05; ** p < 0.01; *** p < 0.001.
Recent studies have shown that ghrelin-induced activation of hypothalamic AMPK requires the calcium-dependent activation of calcium/calmodulin-dependent protein kinase kinase 2 (CaMKK2), an upstream kinase for AMPK [32] widely expressed in neurons [33]. Ghrelin is thought to raise neuronal intracellular calcium by multiple mechanisms that include release from intracellular stores and influx of extracellular calcium through ion channels [34]. Here, we demonstrate that ghrelin produced no significant change in the membrane potential (Vm) or firing rate of GT1-7 cells (fig. 4e). In the absence of ghrelin, Vm was −48.6 ± 1.5 mV and firing frequency was 0.47 ± 0.11 Hz and 10 min after ghrelin (100 nM) application, the mean values were −50.3 ± 1.2 mV (n = 9; p > 0.1) and 0.63 ± 0.15 Hz (p > 0.1), respectively. However, we detected a small, but significant effect of ghrelin on action potential amplitude and after-hyperpolarization amplitude in GT1-7 cells (fig. 4f). Thus, although there is no strong evidence to indicate that ghrelin acts to depolarize or excite GT1-7 cells, an increase in action potential amplitude, coupled with a larger after-hyperpolarization, may indicate increased extracellular calcium entry. Complete inhibition of GT1-7 cell firing was achieved by treatment with the non-specific voltage-gated calcium channel blocker, cadmium (100 μM; data not shown), suggesting that GT1-7 action potentials are mainly voltage gated calcium channel dependent and that continual cell firing will maintain a constant small influx of calcium. Accordingly, using fura-2 fluorescence imaging (see online suppl. fig. 1; for all online suppl. material, see www.karger.com/doi/10.1159/000334144), ghrelin induced a small, but sustained, increase in intracellular calcium ([Ca2+]i) in all GT1-7 neurons that responded to the addition of KCl (100 mM) with a large transient increase in calcium (fig. 4g, h). Thus ghrelin raises [Ca2+]i in GT1-7 hypothalamic neurons, which may, at least in part, be due to increased calcium entry. Consistent with raised [Ca2+]i resulting in higher CaMKK2 activity, the ghrelin-dependent induction of AMPK phosphorylation in GT1-7 cells was blocked (fig. 4i, j) by a 30-min pre-incubation of cells with STO-609 (10 μM), a CaMKK2 inhibitor [35]. Interestingly, basal p-AMPK was also diminished by STO-609, indicative of constitutive CaMKK2 activity in these cells. From these results, we predicted that ghrelin would decrease mTORC1 activity in GT1-7 cells. Indeed, although less effective than A-769662, ghrelin (100 nM) induced a significant suppression of basal p-S6K in GT1-7 cells following 30 and 60 min exposure (fig. 5a, b), with no effect on total S6K (fig. 5a). To confirm a role for AMPK in ghrelin-mediated mTORC1 modulation, GT1-7 cells were treated for 30 min with ghrelin (100 nM) in the presence (with a 30-min pre-incubation) or absence of the AMPK inhibitor, compound C (40 μM). Compound C, in the absence of ghrelin, significantly inhibited basal AMPK phosphorylation (fig. 5c, d), which coincided with increased S6K phosphorylation (fig. 5c, e). This suggests that basal AMPK activity is sufficient to elicit a tonic inhibitory effect on mTORC1 activity within GT1-7 cells. Furthermore, compound C blocked the ability of ghrelin to increase AMPK phosphorylation concomitant with reversal of ghrelin-mediated reduction of S6K phosphorylation (fig. 5c–e), indicating that ghrelin-mediated modulation of mTORC1 activity is AMPK dependent.
Fig. 5.
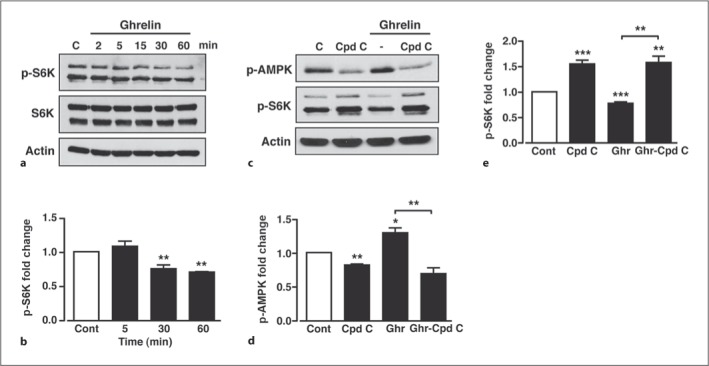
Ghrelin inhibition of mTORC1 in GT1-7 cells is AMPK dependent. a Representative immunoblot of p-S6K, S6K and actin under control conditions (C) and in response to 100 nM ghrelin. b Mean normalized p-S6K under non-stimulated conditions (Cont) and after stimulation with ghrelin. c Representative immunoblots for p-AMPK and p-S6K under control conditions (C), with 40 μM compound C (Cpd C) and in response to 100 nM ghrelin in the absence and presence of compound C. Mean normalized p-AMPK (d) and p-S6K (e) under non-stimulated conditions (Cont), with compound C and in response to ghrelin in the absence and presence of compound C. n = 3–7 for each condition. Values are means ± SEM. * p < 0.05; ** p < 0.01; *** p < 0.001.
Insulin, but Not Leptin, Prevents Ghrelin-Induced Inhibition of S6K Phosphorylation
We have demonstrated that leptin and insulin increase whereas ghrelin or direct activation of AMPK using A-769662 decrease mTORC1 activity, respectively, in GT1-7 cells. Consequently, these results suggest that, at least, part of the final hypothalamic output of anorexigenic and orexigenic hormone-mediated signalling may depend on integration of their actions on upstream (i.e. PI3K-PKB vs. AMPK) signalling pathways that converge on mTORC1-S6K. We therefore determined whether increased AMPK activity could attenuate the anorexigenic hormone-driven increase in mTORC1 activity. Both the insulin- and leptin-mediated increases in S6K phosphorylation were significantly reduced in the presence (with 30 min pre-incubation) of A-769662 (fig. 6a–c). This shows that direct stimulation of AMPK mimics the effect of the mTORC1 inhibitor, rapamycin, on anorexigenic hormone-induced S6K phosphorylation. However, pre-incubation of GT1-7 cells with 100 nM ghrelin had no significant effect on the insulin-mediated increase in S6K phosphorylation (fig. 6d, e), perhaps reflecting the smaller effect of ghrelin on AMPK activity observed in comparison to A-769662 (fig. 4e). Hence, in GT1-7 cells, the inhibitory signal elicited by ghrelin, presumably through increased AMPK activity, is too weak to overcome the stimulatory insulin signal (via PI3K-PKB) to mTORC1, suggesting that the insulin signal dominates. In contrast, the stimulatory signal driven by leptin to mTORC1 is weaker than that of insulin, and pre-incubation with ghrelin (100 nM) inhibits the leptin signal (fig. 6f).
Fig. 6.
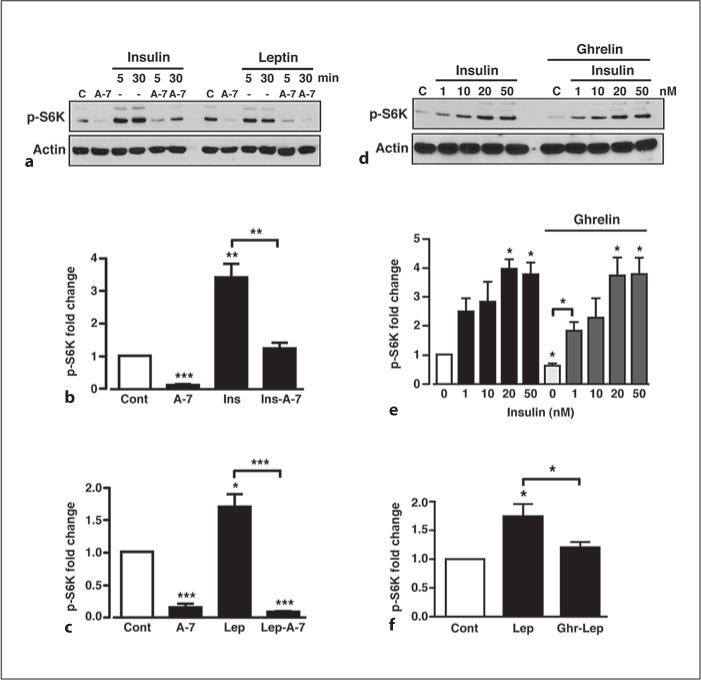
Insulin, but not leptin, prevents ghrelin-mediated S6K phosphorylation. a Representative immunoblot showing p-S6K in response to 50 μM A-769662 alone (A-7) and 50 nM insulin and 50 nM leptin in the absence and presence of 50 μM A-769662. Mean normalized p-S6K under non-stimulated conditions (Cont), A-769662 (A-7) and insulin (Ins) (b) and leptin (lep) (c) in the absence and presence of A-769662. d Representative immunoblot showing p-S6K under control conditions (C), 100 nM ghrelin and in response to 50 nM insulin, in the absence and presence of 100 nM ghrelin, respectively. e Mean normalized p-S6K in response to increasing concentrations of insulin in the absence and presence of ghrelin. Note that ghrelin, in the absence of insulin, reduced p-S6K levels. n = 3–6 for each condition. f Mean normalized p-S6K in response to leptin alone or leptin following pre-treatment of cells with ghrelin. Values are means ± SEM. * p < 0.05; ** p < 0.01; *** p < 0.001.
Increased mTORC1 Activity Inhibits Ghrelin-Mediated AgRP Expression in the Mouse Arcuate Nucleus
To investigate whether modulation of AMPK and mTORC1 activity underlies the ability of ghrelin to increase hypothalamic AgRP expression, we measured AgRP mRNA levels in mouse ARC tissue sections in response to A-769662 or ghrelin under conditions similar to that used to demonstrate modified mTORC1 activity in the GT1-7 hypothalamic neurons. In order to demonstrate significant upregulation of AgRP mRNA in response to increased AMPK activity by A-769662 or ghrelin, basal AgRP was maintained at a low level (short period of food withdrawal) prior to the preparation of hypothalamic slices. A-769662-mediated increased AMPK phosphorylation in ARC tissue sections resulted in a large increase in AgRP mRNA expression (fig. 7a). Although much less effective than A-769662, ghrelin per se induced a more than two-fold increase in AgRP mRNA expression in mouse ARC, whereas under these experimental conditions neither insulin (fig. 7a, b) nor leptin (data not shown) alone had any effect on basal AgRP expression levels. The AMPK inhibitor compound C prevented the increase in AgRP mRNA elicited by ghrelin in hypothalamic tissue (fig. 7c). Thus, ghrelin mediates raised AgRP gene expression through increased hypothalamic AMPK activity. Furthermore, the ghrelin-induced increased AgRP expression was significantly attenuated (with 30 min pre-incubation) by insulin (fig. 7b), although leptin had no effect on the ghrelin-mediated increase in AgRP mRNA expression (data not shown). In a separate series of experiments in which mice were starved overnight, leptin was demonstrated to suppress AgRP mRNA levels as expected (data not shown). One explanation for these outcomes is that AgRP mRNA transcription is controlled, at least in part, by the integration of PI3K- and AMPK-dependent signalling through the mTORC1 pathway. Consequently, insulin may attenuate the ability of ghrelin to increase AgRP gene expression by sufficiently raised activity in the PI3K-PKB pathway resulting in stimulation of mTORC1, although if AgRP expression is stimulated by much higher AMPK activity (driven by A-769662), insulin is unable to offset this increase (fig. 7a).
Fig. 7.
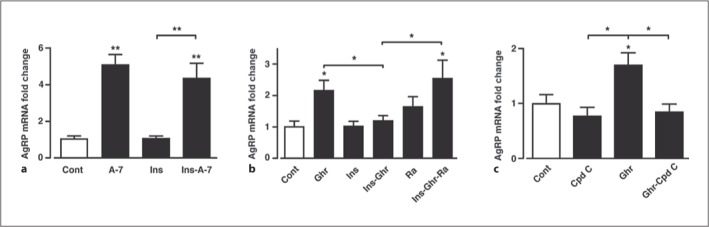
Ghrelin increases arcuate AgRP mRNA levels by raising AMPK activity, an outcome prevented by insulin. a Mean normalized mouse arcuate AgRP mRNA following stimulation with 50 μM A-769662 (A-7), 50 nM insulin (Ins) and A-769662 (A-7) in the presence of insulin. b Arcuate AgRP mRNA levels following stimulation with 100 nM ghrelin, 50 nM insulin, 100 nM rapamycin (Ra), insulin in the presence of ghrelin and insulin in the presence of ghrelin and rapamycin. c Arcuate AgRP mRNA following stimulation with 40 μM compound C (Cpd C), 100 nM ghrelin (Ghr) and ghrelin in the presence of compound C. n = 5–9 for each condition. Values are means ± SEM. * p < 0.05; ** p < 0.01.
To confirm that the inhibition by insulin- on ghrelin-mediated AgRP mRNA expression was dependent upon the PI3K-PKB-mTORC1 pathway, hypothalamic slices were pre-incubated for 20 min with 100 nM rapamycin, and then treated for 3 h with 100 nM ghrelin and 50 nM insulin, as described. In the presence of rapamycin, the inhibitory effect of insulin on ghrelin-dependent AgRP expression was significantly attenuated (fig. 7b), indicating that insulin inhibits the promotion of AgRP mRNA production by ghrelin in an mTORC1-dependent manner. However, this lack of inhibition by rapamycin of ghrelin-mediated increased AgRP mRNA also indicates an additional action of ghrelin to increase AgRP mRNA levels that is AMPK dependent but mTORC1 independent.
Discussion
The raised levels of S6K phosphorylation by insulin and leptin were inhibited by the presence of rapamycin, strongly indicating that the kinase responsible for S6K phosphorylation in GT1-7 cells is mTORC1. The increase in mTORC1 activity driven by insulin and leptin in GT1-7 cells was shown to require signalling through the PI3K-PKB pathway. LY294002 and wortmannin, commonly used inhibitors of PI3K, inhibited leptin- and insulin-induced S6K phosphorylation in GT1-7 cells. One major caveat regarding these compounds concerns their ability to also inhibit mTOR, the proposed downstream effector of the S6K pathway. However, whereas LY294002 has been reported to inhibit mTOR at concentrations similar to those required for inhibition of PI3K, wortmannin has only been shown to inhibit mTOR at micromolar concentrations [28]. Additionally, the PKB inhibitor, Akti, is a selective inhibitor of PKB, with very little direct effect on other kinase activity, including mTOR and S6K [28, 30]. Taken together these data indicate that leptin- and insulin-induced S6K phosphorylation is, at least partly, due to the activation of the PI3K-PKB pathway. Additionally, previous work has demonstrated that centrally or peripherally administered leptin and insulin increase hypothalamic S6K phosphorylation, in conjunction with their actions to reduce food intake and body weight [8, 9]. However, the mechanism by which these hormones increase hypothalamic mTORC1 activity has not been fully explored, with both induction of PI3K signalling and actions secondary to increased neuronal activity plausible. The data presented here support the notion that PI3K and PKB activity are required for insulin and leptin modulation of mTORC1 in hypothalamic neurons and indicate that both hormones utilize the canonical growth factor signalling pathway to increase mTORC1 activity (fig. 8).
Fig. 8.
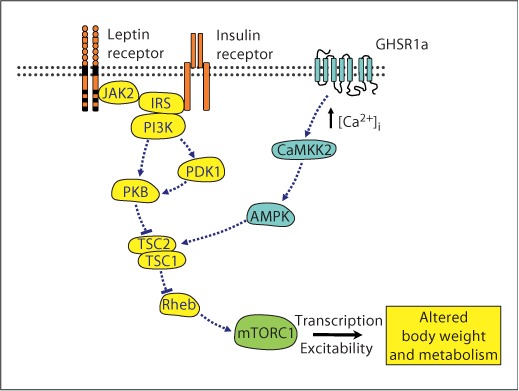
Model by which anorexigenic and orexigenic hormone signals may converge and regulate mTORC1 in hypothalamic neurons. Signalling through molecules highlighted in orange/yellow leads to inhibition of food intake and increased energy expenditure, whereas signalling through molecules highlighted in blue leads to increased food intake and reduced energy expenditure, with mTORC1, highlighted in green, acting as a key signalling node to various cell outputs involved in body weight and metabolic control. GHSR1a = GH secretagogue receptor 1a; CaMKK2 = calmodulin kinase kinase 2; AMPK = AMP-activated protein kinase; JAK2 = janus kinase 2; IRS = insulin receptor substrate; PI3K = phosphoinositide 3-kinase; PDK1 = phospholipid-dependent kinase 1; PKB = protein kinase B; TSC1/2 = tuberous sclerosis complex 1 (hamartin) and 2 (tuberin); Rheb = Ras homolog enriched in brain. Colors refer to the online version only.
The orexigenic action of ghrelin is likely associated with GHSR1a-dependent signalling in the hypothalamus [16, 17, 34] and recent studies strongly suggest that increased hypothalamic AMPK activity underpins ghrelin-induced food intake [33, 36]. Furthermore, activity of the upstream AMPK kinase, CaMKK2, is a central component of ghrelin-mediated regulation of food intake and neuropeptide expression [33]. Thus, CaMKK2 KO mice exhibited decreased hypothalamic AMPK activity, which was associated with reduced AgRP and NPY mRNA levels and loss of response to ghrelin. Moreover, inhibition of hypothalamic CaMKK2 in control mice by intracerebroventricular application of the CaMKK2 inhibitor, STO-609, inhibited food intake and induced weight loss. Therefore, it has been proposed that ghrelin mediates orexigenic actions via hypothalamic GHSR1a activation, increasing intracellular neuronal calcium, which drives CaMKK2 to raise AMPK activity [37]. Consequently, we used GT1-7 cells to explore how this pathway is involved in hypothalamic ghrelin signalling. Previous work has indicated that ghrelin directly depolarizes and increases the firing rate of hypothalamic arcuate neurons, including NPY-containing neurons [5, 38]. Ghrelin also raises [Ca2+]i levels in neurons and glia [39, 40, 41]. However, the mechanisms by which ghrelin increase [Ca2+]i appear complex, with reports of direct depolarization of neurons initiating channel-mediated extracellular calcium entry [38, 39, 40] and release of calcium from thapsigargan-sensitive intracellular stores [41]. Here we demonstrated that although ghrelin does not depolarize or excite GT1-7 hypothalamic neurons, it does induce a rise in [Ca2+]i, which may in part be due to increased calcium entry during action potential firing. As we were focused on determining the main constituents of the signalling pathway utilized by ghrelin to alter mTORC1 activity, we have not determined the exact sources of the raised [Ca2+]i in this study.
Ghrelin also increased AMPK activity, as measured by increased p-AMPK and p-ACC and by direct kinase activity assay in GT1-7 cells, with the ghrelin-mediated increase in p-AMPK prevented by the presence of the CaMKK2 inhibitor, STO-609. The increase in AMPK activity also coincided, temporally, with a decrease in mTORC1 activity, with the latter outcome blocked by the presence of the AMPK inhibitor, compound C. At present, STO-609 and compound C are the best available inhibitors of CaMKK2 and AMPK, respectively. However, a major caveat regarding both of these drugs is their relative lack of selectivity, with inhibition of a wide range of kinases reported at concentrations that inhibit CaMKK2 and AMPK [28]. Nevertheless, these data are consistent with the model described above whereby ghrelin raises intracellular calcium levels, increasing activity of CaMKK2, thus raising the levels of p-AMPK and increasing AMPK activity. Higher AMPK activity in these cells was therefore predicted to inhibit mTORC1 activity and antagonize the effects of the anorexigenic hormones on mTORC1 signalling, as depicted in the model shown in figure 8. Indeed, increasing AMPK activity in GT1-7 cells using A-769662 resulted in suppression of basal mTORC1 activity and reversed insulin- and leptin-stimulated mTORC1 activity. However, the ghrelin-induced increased AMPK activity was not sufficiently robust to offset the insulin- or leptin-mediated increase in mTORC1 activity in these hypothalamic neurons. This outcome was consistent with our finding that insulin signalling through mTORC1 dominates over the ghrelin-mediated signal for regulation of hypothalamic AgRP mRNA expression. We did not find that leptin or insulin attenuated hypothalamic AMPK activity in this study, in apparent contradiction to a previous report [42]. However, it should be pointed out that the inhibition of AMPK by leptin requires time periods of about 3 h and in separate studies (data not shown) we have observed decreased basomedial hypothalamic p-AMPK and p-ACC levels in mice 3 h following leptin injection.
It is clear from recent work that a modification of hypothalamic AMPK activity impacts on the regulation of neuropeptide expression levels and energy homeostasis [20, 21]. However, the downstream mediators of altered AMPK activity in relation to these outputs are presently unclear. Our results suggested to us that modulation of hypothalamic mTORC1 activity, through the activation of AMPK, might contribute to ghrelin-driven changes in neuropeptide expression. Indeed, previous work has demonstrated that changing hypothalamic AMPK activity modifies mTORC1 signal transduction and results in altered neuropeptide expression and food intake [43, 44]. In support, a recent study has shown that decreasing hypothalamic AMPK activity by intracerebroventricular administration of compound C or adenovirus-driven over-expression of dominant negative AMPK catalytic isoforms impairs the central orexigenic actions of ghrelin [36]. Using freshly isolated wedges of ARC tissue, we demonstrate that pharmacological activation of AMPK by A-769662 increases AgRP mRNA levels as expected. Ghrelin also increases AgRP mRNA expression, an effect prevented by the AMPK inhibitor compound C. Furthermore, insulin, although having no effects per se (due to animals being close to a satiated state when tested), also inhibited the ability of ghrelin to increase AgRP mRNA expression in ARC tissue, an outcome prevented by the concomitant presence of rapamycin. Consequently, these data support the notion that mTORC1 acts as a signalling node in at least some hypothalamic neurons, allowing integration of signalling by anorexigenic and orexigenic hormones (see fig. 8) to be coupled to neuropeptide expression. It is important to note that rapamycin per se did not significantly alter ghrelin-stimulated AgRP mRNA levels, indicating that ghrelin likely utilizes additional, although AMPK-dependent, pathways to upregulate AgRP mRNA expression. For example, ghrelin has been reported to alter hypothalamic fatty acid metabolism pathways in an AMPK-dependent manner, through reduced fatty acid synthase levels and activity, reduced malonyl-CoA content and higher carnitine palmitoyl transferase 1 (CPT1) activity [36]. Furthermore, ghrelin increases hypothalamic levels of mitochondrial uncoupling protein 2 (UCP2), in an AMPK- and CPT1-dependent manner, and UCP2 KO mice demonstrate insensitivity to ghrelin or pharmacological activation of hypothalamic AMPK in relation to altered food intake and NPY and AgRP mRNA expression levels [45]. Thus, an additional signalling system, exhibiting dependence on AMPK activity for ghrelin-mediated outputs in hypothalamic neurons, such as changes in neuropeptide expression, may be through increased hypothalamic fatty acid β-oxidation and increased UCP2 activity [31, 45].
In summary, these data improve our current understanding of the molecular signals regulating neuropeptide expression and demonstrate that mTORC1 is an important component of a complex regulatory system in hypothalamic neurons. mTORC1 acts to integrate signalling information from anorexigenic hormones such as insulin and leptin via PI3K-PKB, with that of the orexigenic hormone ghrelin, via Ca2+-CaMKK2-AMPK in order to modulate AgRP neuropeptide expression. It is likely that these key hormone and nutrient sensor systems are fundamental components, not only of specific arcuate neuron populations but also of other neurons and cell types, which act in concert to integrate and disseminate information to alter various cellular output signals involved in the regulation of energy homeostasis. For example, mTORC1 activation in the hypothalamus suppresses food intake, thereby creating a systemic negative feedback loop to maintain nutrient homeostasis, and mTORC1 also increases nutrient mobilization into peripheral tissues through enhanced lipid storage in adipose tissue [46]. It will therefore be interesting to determine whether a similar cross-talk mechanism involving hormone-dependent modulation of mTORC1 and AMPK occurs in peripheral tissues, particularly in relation to insulin secretion from the pancreas and tissue insulin and leptin resistance.
Supplementary Material
Acknowledgements
This work was supported by the Wellcome Trust (grant No. 068692 and 086989), Diabetes UK (grant No. 0003681) and a Wellcome Trust summer studentship (D.B.). We thank Jerry Lambert and Michelle Cooper for help with the calcium-imaging studies.
References
- 1.Dixon JB. The effect of obesity on health outcomes. Mol Cell Endocrinol. 2010;316:104–108. doi: 10.1016/j.mce.2009.07.008. [DOI] [PubMed] [Google Scholar]
- 2.Thaler JP, Choi SJ, Schwartz MW, Wisse BE. Hypothalamic inflammation and energy homeostasis: resolving the paradox. Front Neuroendocrin. 2010;31:79–84. doi: 10.1016/j.yfrne.2009.10.002. [DOI] [PubMed] [Google Scholar]
- 3.Niswender KD, Baskin DG, Schwartz MW. Insulin and its evolving partnership with leptin in the hypothalamic control of energy homeostasis. Trends Endocrinol Metab. 2004;15:362–369. doi: 10.1016/j.tem.2004.07.009. [DOI] [PubMed] [Google Scholar]
- 4.Niswender KD, Schwartz MW. Insulin and leptin revisited: adiposity signals with overlapping physiological and intracellular signaling capabilities. Front Neuroendocrinol. 2003;24:1–10. doi: 10.1016/s0091-3022(02)00105-x. [DOI] [PubMed] [Google Scholar]
- 5.Cowley MA, Smith RG, Diano S, Tschöp M, Pronchuk N, Grove KL, Strasburger CJ, Bidlingmaier M, Esterman M, Heiman ML, Garcia-Segura LM, Nillni EA, Mendez P, Low MJ, Sotonyi P, Friedman JM, Liu H, Pinyo S, Colmers WF, Cone RD, Horvath TL. The distribution and mechanism of action of ghrelin in the CNS demonstrates a novel hypothalamic circuit regulating energy homeostasis. Neuron. 2003;37:649–661. doi: 10.1016/s0896-6273(03)00063-1. [DOI] [PubMed] [Google Scholar]
- 6.Cone RD. Anatomy and regulation of the central melanocortin system. Nat Neurosci. 2005;8:571–578. doi: 10.1038/nn1455. [DOI] [PubMed] [Google Scholar]
- 7.Kamegai J, Tamura H, Shimizu T, Ishii S, Sugihara H, Wakabayashi I. Chronic central infusion of ghrelin increases hypothalamic neuropeptide Y and agouti-related protein mRNA levels and body weight in rats. Diabetes. 2001;50:2438–2443. doi: 10.2337/diabetes.50.11.2438. [DOI] [PubMed] [Google Scholar]
- 8.Cota D, Proulx K, Smith KA, Kozma SC, Thomas G, Woods SC, Seeley RJ. Hypothalamic mTOR signaling regulates food intake. Science. 2006;312:927–930. doi: 10.1126/science.1124147. [DOI] [PubMed] [Google Scholar]
- 9.Villanueva EC, Münzberg H, Cota D, Leshan RL, Kopp K, Ishida-Takahashi R, Jones JC, Fingar DC, Seeley RJ, Myers MG., Jr Complex regulation of mammalian target of rapamycin complex 1 in the basomedial hypothalamus by leptin and nutritional status. Endocrinology. 2009;150:4541–4551. doi: 10.1210/en.2009-0642. [DOI] [PMC free article] [PubMed] [Google Scholar]
- 10.Cota D, Matter EK, Woods SC, Seeley RJ. The role of hypothalamic mammalian target of rapamycin complex 1 signaling in diet-induced obesity. J Neurosci. 2008;28:7202–7208. doi: 10.1523/JNEUROSCI.1389-08.2008. [DOI] [PMC free article] [PubMed] [Google Scholar]
- 11.Blouet C, Ono H, Schwartz GJ. Mediobasal hypothalamic p70 S6 kinase 1 modulates the control of energy homeostasis. Cell Metab. 2008;8:459–467. doi: 10.1016/j.cmet.2008.10.004. [DOI] [PMC free article] [PubMed] [Google Scholar]
- 12.Reed AS, Unger EK, Olofsson LE, Piper ML, Myers MG, Jr, Xu AW. Functional role of suppressor of cytokine signaling 3 upregulation in hypothalamic leptin resistance and long-term energy homeostasis. Diabetes. 2010;59:894–906. doi: 10.2337/db09-1024. [DOI] [PMC free article] [PubMed] [Google Scholar]
- 13.Um SH, Frigerio F, Watanabe M, Picard F, Joaquin M, Sticker M, Fumagalli S, Allegrini PR, Kozma SC, Auwerx J, Thomas G. Absence of S6K1 protects against age- and diet-induced obesity while enhancing insulin sensitivity. Nature. 2004;431:200–205. doi: 10.1038/nature02866. [DOI] [PubMed] [Google Scholar]
- 14.Miller AM, Brestoff JR, Phelps CB, Berk EZ, Reynolds TH., 4th Rapamycin does not improve insulin sensitivity despite elevated mammalian target of rapamycin complex 1 activity in muscles of ob/ob mice. Am J Physiol Regul Integr Comp Physiol. 2008;295:R1431–R1438. doi: 10.1152/ajpregu.90428.2008. [DOI] [PMC free article] [PubMed] [Google Scholar]
- 15.Korsheninnikova E, van der Zon GC, Voshol PJ, Janssen GM, Havekes LM, Grefhorst A, Kuipers F, Reijngoud DJ, Romijn JA, Ouwens DM, Maassen JA. Sustained activation of the mammalian target of rapamycin nutrient sensing pathway is associated with hepatic insulin resistance, but not with steatosis, in mice. Diabetologia. 2006;49:3049–3057. doi: 10.1007/s00125-006-0439-5. [DOI] [PubMed] [Google Scholar]
- 16.Sun Y, Wang P, Zheng H, Smith RG. Ghrelin stimulation of growth hormone release and appetite is mediated through the growth hormone secretagogue receptor. Proc Natl Acad Sci USA. 2004;101:4679–4684. doi: 10.1073/pnas.0305930101. [DOI] [PMC free article] [PubMed] [Google Scholar]
- 17.Zigman JM, Nakano Y, Coppari R, Balthasar N, Marcus JN, Lee CE, Jones JE, Deysher AE, Waxman AR, White RD, Williams TD, Lachey JL, Seeley RJ, Lowell BB, Elmquist JK. Mice lacking ghrelin receptors resist the development of diet-induced obesity. J Clin Invest. 2005;115:3564–3572. doi: 10.1172/JCI26002. [DOI] [PMC free article] [PubMed] [Google Scholar]
- 18.Hewson AK, Dickson SL. Systemic administration of ghrelin induces Fos and Egr-1 proteins in the hypothalamic arcuate nucleus of fasted and fed rats. J Neuroendocrinology. 2000;12:1047–1049. doi: 10.1046/j.1365-2826.2000.00584.x. [DOI] [PubMed] [Google Scholar]
- 19.Wang L, Saint-Pierre HH, Taché Y. Peripheral ghrelin selectively increases Fos expression in neuropeptide Y-synthesizing neurons in mouse hypothalamic arcuate nucleus. Neurosci Lett. 2002;325:47–51. doi: 10.1016/s0304-3940(02)00241-0. [DOI] [PubMed] [Google Scholar]
- 20.Andersson U, Filipsson K, Abbott CR, Woods A, Smith K, Bloom SR, Carling D, Small CJ. AMP-activated protein kinase plays a role in the control of food intake. J Biol Chem. 2004;279:12005–12008. doi: 10.1074/jbc.C300557200. [DOI] [PubMed] [Google Scholar]
- 21.Kola B, Hubina E, Tucci SA, Kirkham TC, Garcia EA, Mitchell SE, Williams LM, Hawley SA, Hardie DG, Grossman AB, Korbonits M. Cannabinoids and ghrelin have both central and peripheral metabolic and cardiac effects via AMP-activated protein kinase. J Biol Chem. 2005;280:25196–25201. doi: 10.1074/jbc.C500175200. [DOI] [PubMed] [Google Scholar]
- 22.Minokoshi Y, Alquier T, Furukawa N, Kim Y-B, Lee A, Xua B, Mu J, Foufelle F, Ferré P, Birnbaum MJ, Stuck BJ, Kahn, BB. AMP-kinase regulated food intake by responding to hormonal and nutrient signals in the hypothalamus. Nature. 2004;428:569–574. doi: 10.1038/nature02440. [DOI] [PubMed] [Google Scholar]
- 23.Shaw RJ. LKB1 and AMP-activated protein kinase control of mTOR signaling and growth. Acta Physiol Scand. 2009;196:65–80. doi: 10.1111/j.1748-1716.2009.01972.x. [DOI] [PMC free article] [PubMed] [Google Scholar]
- 24.Mirshamsi S, Laidlaw HA, Ning K, Anderson E, Burgess LA, Gray A, Sutherland C, Ashford ML. Stimulation of PI3K by leptin and insulin leads to actin reorganization and KATP activation in arcuate nucleus neurones. BMC Neurosci. 2004;5:54. doi: 10.1186/1471-2202-5-54. [DOI] [PMC free article] [PubMed] [Google Scholar]
- 25.Hawley SA, Ross FA, Chevtzoff C, Green KA, Evans A, Fogarty S, Towler MC, Brown LJ, Ogunbayo OA, Evans AM, Hardie DG. Use of cells expressing gamma subunit variants to identify diverse mechanisms of AMPK activation. Cell Metab. 2010;11:554–565. doi: 10.1016/j.cmet.2010.04.001. [DOI] [PMC free article] [PubMed] [Google Scholar]
- 26.Huang J, Manning BD. A complex interplay between Akt, TSC2 and the two mTOR complexes. Biochem Soc Trans. 2009;37:217–222. doi: 10.1042/BST0370217. [DOI] [PMC free article] [PubMed] [Google Scholar]
- 27.Toral-Barza L, Zhang WG, Lamison C, Larocque J, Gibbons J, Yu K. Characterization of the cloned fill-length and a truncated human target of rapamycin: activity, specificity, and enzyme inhibition as studied by a high capacity assay. Biochem Biophys Res Commun. 2005;332:304–310. doi: 10.1016/j.bbrc.2005.04.117. [DOI] [PubMed] [Google Scholar]
- 28.Bain J, Plater L, Elliot M, Shpiro N, Hastie CJ, McLauchlan H, Klevernic I, Arthur JS, Alessi DR, Cohen P. The selectivity of protein kinase inhibitors: a further update. Biochem J. 2007;408:297–315. doi: 10.1042/BJ20070797. [DOI] [PMC free article] [PubMed] [Google Scholar]
- 29.Dann SG, Thomas G. The amino acid sensitive TOR pathway from yeast to mammals. FEBS Lett. 2006;580:2821–2829. doi: 10.1016/j.febslet.2006.04.068. [DOI] [PubMed] [Google Scholar]
- 30.Logie L, Ruiz-Alcaraz AJ, Keane M, Woods YL, Bain J, Marquez R, Alessi DR, Sutherland C. Characterization of a protein kinase B inhibitor in vitro and in insulin-treated liver cells. Diabetes. 2007;56:2218–2227. doi: 10.2337/db07-0343. [DOI] [PubMed] [Google Scholar]
- 31.Lage R, Vásquez MJ, Varela L, Saha AK, Vidal-Puig A, Nogueiras R, Diéguez C, López, M. Ghrelin effects on neuropeptides in the rat hypothalamus depend on fatty acid metabolism actions on BSX but not on gender. FASEB J. 2010;24:2670–2679. doi: 10.1096/fj.09-150672. [DOI] [PMC free article] [PubMed] [Google Scholar]
- 32.Towler MC, Hardie DG. AMP-activated protein kinase in metabolic control and insulin signaling. Circ Res. 2007;100:328–341. doi: 10.1161/01.RES.0000256090.42690.05. [DOI] [PubMed] [Google Scholar]
- 33.Anderson KA, Ribar TJ, Lin F, Noeldner PK, Green MF, Muehlbauer MJ, Witters LA, Kemp BE, Means AR. Hypothalamic CaMKK2 contributes to the regulation of energy balance. Cell Metab. 2008;7:377–388. doi: 10.1016/j.cmet.2008.02.011. [DOI] [PubMed] [Google Scholar]
- 34.Schellekens H, Dinan TG, Cryan JF. Lean mean fat reducing ‘ghrelin’ machine: hypothalamic ghrelin and ghrelin receptors and therapeutic targets in obesity. Neuropharmacology. 2009;58:2–16. doi: 10.1016/j.neuropharm.2009.06.024. [DOI] [PubMed] [Google Scholar]
- 35.Tokumitsu H, Inuzuka H, Ishikawa Y, Ikeda M, Saji I, Kobayashi R. STO-609, a specific inhibitor of the Ca2+/calmodulin-dependent protein kinase kinase. J Biol Chem. 2002;277:15813–15818. doi: 10.1074/jbc.M201075200. [DOI] [PubMed] [Google Scholar]
- 36.López M, Lage R, Saha AK, Pérez-Tilve D, Vázquez MJ, Varela, L, Sangiao-Alverellos S, Tovar S, Raghay K, Rodríguez-Cuenca S, Deoliveira RM, Castañeda T, Datta R, Dong JZ, Culler M, Sleeman MW, Álvarez CV, Gallego R, Lelliot CJ, Carling D, Tschöp MH, Diéguez C, Vidal-Puig A. Hypothalamic fatty acid metabolism mediates the orexigenic action of ghrelin. Cell Metab. 2008;7:389–399. doi: 10.1016/j.cmet.2008.03.006. [DOI] [PubMed] [Google Scholar]
- 37.Kola B, Korbonits M. Shedding light on the intricate puzzle of ghrelin's effects on appetite regulation. J Endocrinol. 2009;202:191–198. doi: 10.1677/JOE-09-0056. [DOI] [PubMed] [Google Scholar]
- 38.Osterstock G, Escobar P, Mitutsova V, Gouty-Colomer LA, Fontanaud P, Molino F, Fehrentz JA, Carmignac D, Martinez J, Guerineau NC, Robinson IC, Mollard P, Méry PF. Ghrelin stimulation of growth hormone-releasing hormone neurons is direct in the arcuate nucleus. PLoS One. 2010;11:e9159. doi: 10.1371/journal.pone.0009159. [DOI] [PMC free article] [PubMed] [Google Scholar]
- 39.Kohno D, Gao HZ, Muroya S, Kikuyama S, Yada T. Ghrelin directly interacts with neuropeptide-Y-containing neurons in the rat arcuate nucleus: Ca2+ signaling via protein kinase A and N-type channel-dependent mechanisms and cross-talk with leptin and orexin. Diabetes. 2003;52:948–956. doi: 10.2337/diabetes.52.4.948. [DOI] [PubMed] [Google Scholar]
- 40.Kohno D, Sone H, Minokoshi Y, Yada T. Ghrelin raises [Ca2+]I via AMPK in hypothalamic arcuate nucleus NPY neurons. Biochem Biophys Res Commun. 2008;366:388–392. doi: 10.1016/j.bbrc.2007.11.166. [DOI] [PubMed] [Google Scholar]
- 41.Erriquez J, Bernascone S, Ciarletta M, Filigheddu N, Graziani A, Distasi C. Calcium signals activated by ghrelin and D-Lys3-GHRP-6 ghrelin antagonist in developing dorsal root ganglion glial cells. Cell Calcium. 2009;46:197–208. doi: 10.1016/j.ceca.2009.07.003. [DOI] [PubMed] [Google Scholar]
- 42.Gao S, Kinzig KP, Aja S, Scott KA, Keung W, Kelly S, Strynadka K, Chohnan S, Smith WW, Tamashiro KLK, Ladenheim EE, Ronnett GV, Tu U, Birnbaum MJ, Lopaschuk GD, Moran TH. Leptin activates hypothalamic acetyl-CoA carboxylase to inhibit food intake. Proc Natl Acad Sci USA. 2007;104:17358–17363. doi: 10.1073/pnas.0708385104. [DOI] [PMC free article] [PubMed] [Google Scholar]
- 43.Ropelle ER, Pauli JR, Fernandes MFA, Rocco SA, Marin RM, Morari J, Souza KK, Dias MM, Gomes-Marcondes MC, Gontijo JAR, Franchini KG, Vellosa LA, Saad MJA, Carvalheira JBC. A central role for neuronal AMP-activated protein kinase (AMPK) and mammalian target of rapamycin (mTOR) in high-protein diet-induced weight loss. Diabetes. 2008;57:594–605. doi: 10.2337/db07-0573. [DOI] [PubMed] [Google Scholar]
- 44.Ropelle ER, Fernandes MF, Flores MB, Ueno M, Rocco S, Marin R, Cintra DE, Velloso LA, Franchini KG, Saad MJ, Carvalheira JB. Central exercise action increases the AMPK and mTOR response to leptin. PLoS One. 2008;3:e3856. doi: 10.1371/journal.pone.0003856. [DOI] [PMC free article] [PubMed] [Google Scholar] [Retracted]
- 45.Andrews ZB, Liu Z-W, Wallingford N, Erion DM, Borok E, Friedman JM, Tschöp MH, Shanabrough M, Cline G, Shulman GI, Coppola A, Gao X-B, Horvath TL, Diano S. UCP2 mediates ghrelin's action on NPY/AgRP neurons by lowering free radicals. Nature. 2008;454:846–851. doi: 10.1038/nature07181. [DOI] [PMC free article] [PubMed] [Google Scholar]
- 46.Cota D, Proulx K, Seeley RJ. The role of CNS fuel sensing in energy and glucose regulation. Gastroenterology. 2007;132:2158–2168. doi: 10.1053/j.gastro.2007.03.049. [DOI] [PubMed] [Google Scholar]
Associated Data
This section collects any data citations, data availability statements, or supplementary materials included in this article.