Abstract
Two recently published studies, (1) and (2), report blood oxygenation level dependent (BOLD) responses in the human locus coeruleus (LC). Here we show that these LC responses do not correspond to the anatomical location of the LC, and present cautionary data concerning the quality of BOLD signals measured from the LC using standard fMRI acquisition parameters.
Comment
Because the locus coeruleus (LC) plays a major role in modulating brain activity, there is great interest in using neuroimaging techniques to study its function in humans. Two recent studies ((1) and (2)) reported BOLD responses in human LC, but neither provided anatomical evidence that activations were located in the LC and their claim conflicts with the known location of human LC.
The LC is a small rod-shaped nucleus located within the dorsal wall of the rostral pons in the lateral floor of the fourth ventricle and is the principle site for synthesis of noradrenaline in the brain. The LC in each hemisphere contains 9,500–23,000 cells and has a rostro-caudal extent of approximately 16mm. The cross-sectional area of the LC is 17.2–32.8 mm2 if regions with the lowest cell densities are measured, but is only 0.3–5.6 mm2 (3) if regions with the mean density (1281–1920 cells/mm2) and above are measured. The LC has been localized in humans based on postmortem examinations (3, 4) and on in vivo MRI scans that visualize neuromelanin pigment within the LC (5–8).
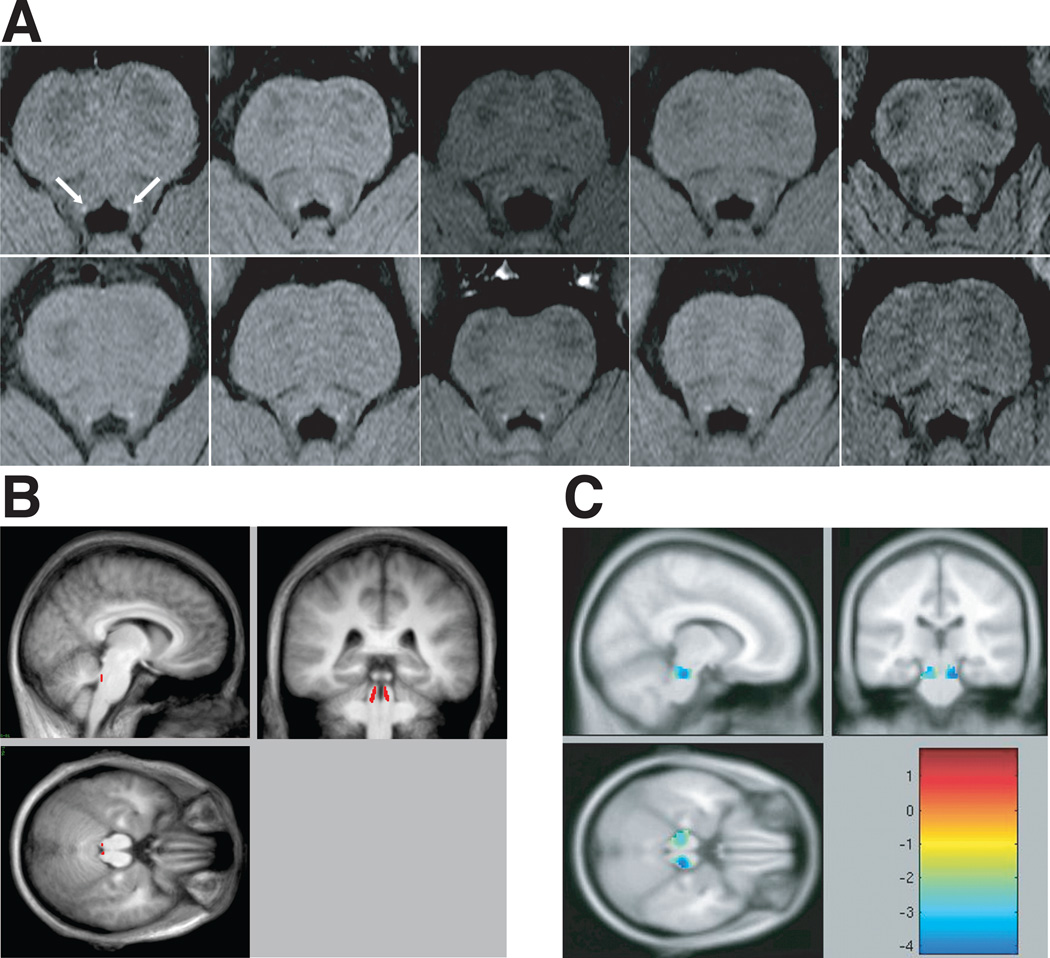
We adapted the neuromelanin imaging technique to the Siemens Trio 3T scanner (TR=600ms, TE=14ms, flip angle=120, voxel dimensions 0.43×0.43×2.5 mm, 20 axial slices) and scanned ten subjects. A bite-bar stabilized head position. On axial images the LC appeared as an area of high signal intensity in the upper pontine tegmentum immediately antero-lateral to the floor of the fourth ventricle (Fig. 1A). In all ten subjects the LC corresponded to the location reported in previous imaging (5, 8) and histological studies (3–5), and in human brain atlases (9, 10). To compare the LC location across subjects, individual images were registered to a brainstem atlas template (Supplementary Figure 1A), and a group-average neuromelanin image was computed (Supplementary Figure 2). The high accuracy of this procedure was evidenced by the close match of individual brainstem outlines to the template (Supplementary Figure 1A), the presence and high contrast of the LC in the group-average neuromelanin image (Supplementary Figure 2), and the low variability across individuals of the LC coordinates in the MNI152 atlas [Average (SD): Left LC = −3.2(0.39), −38.2(0.63), −24.8(1.01); Right LC=5.4(0.28), −37.9(0.57), −24.7(1.61); Supplementary Figure 1B)]. Variability was greatest along the dorso-caudal axis, the longest axis of the LC in previous anatomical studies.
Figure 1.
A: The localization of the human LC in neuromelanin scans of 10 subjects. B: High contrast LC voxels from the group-averaged neuromelanin image in atlas space (see Supplementary Figure 2) are colored in red on the group-averaged anatomical image in atlas space. The location of the LC in this atlas-space image can be compared with the atlas-space activations of Minzenberg et al. (1), which is shown in C: Adapted version of Fig. 1 from Minzenberg et al, 2008 (1). Reprinted with permission from AAAS.
In contrast, the “bilateral pontine clusters” identified as LC in (1) (Figure 1C) were located in a more antero-lateral and superior position, which is inconsistent with previous anatomical studies and human brain atlases. The average MNI152 coordinates for Minzenberg et al.’s (1) ‘task-dependent’ and ‘task-independent’ contrasts were 15.2 mm (right LC) and 15.4 mm (left LC) in vector distance from our LC coordinates. Moreover, the variability across subjects was largest along the antero-posterior axis rather than the dorso-caudal axis. Finally, some of the reported LC clusters (1) contained more than 300 voxels (2565 mm3 and 5144 mm3), greatly exceeding the estimated volume of the LC (275.2–524.8 mm3) (3).
Minzenberg et al. (1) acknowledge that the observed “activation clusters extend outside the LC proper”, but argue that (i) “LC-NE dendrites, which are the likely site of membrane potential changes associated with BOLD signal change …, extend in the pons considerably beyond the LC proper in mammals…, including humans” and (ii) “the activation clusters observed here compare favorably, both qualitatively (3D extent) and quantitatively (location of maxima, cluster size), with those reported in several other studies”. However, (i) the dendrites of individual LC neurons typically extend for less than 1 mm from the nuclear core of LC (up to 500 µm in rats (11) and similarly in humans (12), distances far too small to account for the extended pontine clusters; and (ii) the cited studies that reported LC activity did not conduct an independent localizer (i.e. neuromelanin scans) but relied on previously reported atlas coordinates. Accurate LC localization is also unclear in the recent report of Schmidt et al. (2), who claimed that the “dorsal pontine tegmentum area” ”encompasses the locus coeruleus” but did not independently localize the LC. Their reported LC MNI coordinates are 12 mm and 9 mm in vector distance from our coordinates.
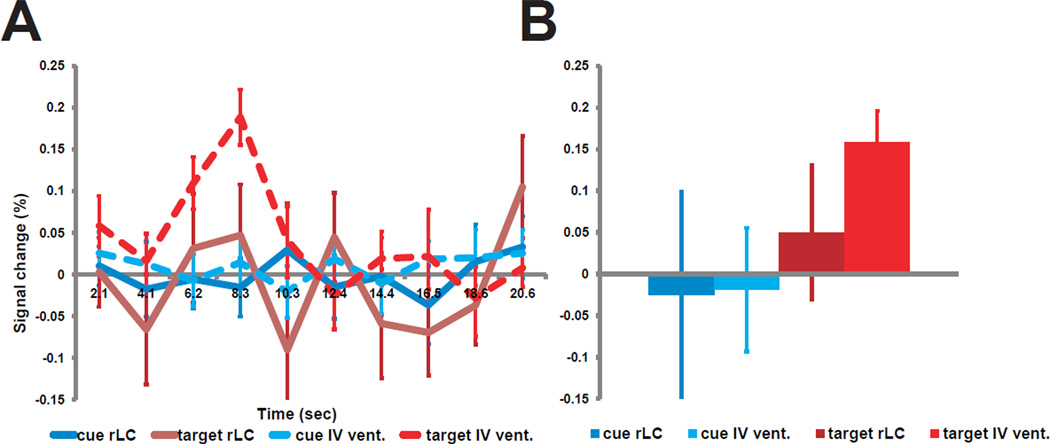
Even if the LC is properly localized, the measured BOLD response may not accurately reflect the activity of LC neurons because of a mismatch between the size of the LC and the typical size of an fMRI voxel (3–4 mm isotropic), as well as pulsation artifacts from the fourth ventricle. The ten subjects whose LC was localized using the neuromelanin sequence had previously participated in a fMRI study (13) involving standard acquisition parameters (4×4×4 mm3 voxels, whole-brain coverage, no cardiac gating), which separately measured the BOLD activations to peripheral cues that directed attention to a task-relevant location and the activations to targets at that location. Figure 2 shows group-mean BOLD time courses and magnitudes (13) from individually defined LC ROIs (3×3×3 mm3). Neurophysiological studies indicate that LC neurons respond to behaviorally relevant targets (14). No response was observed to cues, and a low amplitude noisy response to targets. A task-specific response was observed from the identically sized ROI in the fourth ventricle, raising concerns about the biological validity of any observed LC response. The use of small voxel sizes to reduce partial volume averaging and cardiac gating to minimize ventricular pulsation artifacts may improve signal quality (15).
Figure 2.
A: Average time course from 10 subjects extracted from individually defined ROIs in the right LC and the IV ventricle. B: average magnitudes from the same subjects extracted from the same regions. Cue: response to an informative peripheral cue that either shifted attention or maintained attention at the current location; target: response to correct detection of a target, which required a key press (13). rLC: right LC, IV vent.: IV ventricle. Error bars represent SEM.
Finally, a common practice in fMRI research is the reporting of responses magnitudes rather than time courses, as in Minzenberg et al. This is particularly problematic when imaging brainstem nuclei, since a significant positive magnitude can be observed while ‘non-physiological’ features of the time course are hidden. Our results, however, do not imply that the BOLD signals of Minzenberg et al. are artifactual, only that those signals do not reflect LC activity.
In conclusion, our analysis raises serious doubts concerning the identification of the LC in several previous BOLD studies. Moreover, the interpretation of BOLD signals from the LC using standard fMRI acquisition parameters can be problematic and requires time course information. These cautions apply to other brainstem nuclei.
Supplementary Material
Acknowledgments
This work was supported by the National Institute of Neurological Disorders and Stroke grant RO1 NS048013, National Institute of Mental Health Grant RO1 MH 71920-06, and the J. S. McDonnell Foundation. We thank D.L. Pope for help with data collection and subject recruitment, S. Adams for help with subject requirement, M.P. McAvoy for statistical advice, G. Foster and R. Nagel for the adaptation of neuromelanin-sensitive sequence, D.A. Yablonskiy and X. He for testing alternative sequences for LC localization and for physics advice.
References
- 1.Minzenberg MJ, Watrous AJ, Yoon JH, Ursu S, Carter CS. Modafinil shifts human locus coeruleus to low-tonic, high-phasic activity during functional MRI. Science. 2008 Dec 12;322:1700. doi: 10.1126/science.1164908. [DOI] [PubMed] [Google Scholar]
- 2.Schmidt C, et al. Homeostatic sleep pressure and responses to sustained attention in the suprachiasmatic area. Science. 2009 Apr 24;324:516. doi: 10.1126/science.1167337. [DOI] [PubMed] [Google Scholar]
- 3.German DC, et al. The human locus coeruleus: computer reconstruction of cellular distribution. J Neurosci. 1988 May;8:1776. doi: 10.1523/JNEUROSCI.08-05-01776.1988. [DOI] [PMC free article] [PubMed] [Google Scholar]
- 4.Baker KG, Tork I, Hornung JP, Halasz P. The human locus coeruleus complex: an immunohistochemical and three dimensional reconstruction study. Exp Brain Res. 1989;77:257. doi: 10.1007/BF00274983. [DOI] [PubMed] [Google Scholar]
- 5.Sasaki M, et al. Neuromelanin magnetic resonance imaging of locus ceruleus and substantia nigra in Parkinson's disease. Neuroreport. 2006 Jul 31;17:1215. doi: 10.1097/01.wnr.0000227984.84927.a7. [DOI] [PubMed] [Google Scholar]
- 6.Sasaki M, et al. Monoamine neurons in the human brain stem: anatomy, magnetic resonance imaging findings, and clinical implications. Neuroreport. 2008 Nov 19;19:1649. doi: 10.1097/WNR.0b013e328315a637. [DOI] [PubMed] [Google Scholar]
- 7.Nakane T, Nihashi T, Kawai H, Naganawa S. Visualization of neuromelanin in the Substantia nigra and locus ceruleus at 1.5T using a 3D-gradient echo sequence with magnetization transfer contrast. Magn Reson Med Sci. 2008;7:205. doi: 10.2463/mrms.7.205. [DOI] [PubMed] [Google Scholar]
- 8.Keren NI, Lozar CT, Harris KC, Morgan PS, Eckert MA. In vivo mapping of the human locus coeruleus. Neuroimage. 2009 Oct 1;47:1261. doi: 10.1016/j.neuroimage.2009.06.012. [DOI] [PMC free article] [PubMed] [Google Scholar]
- 9.Nieuwenhuys R, Voogd J, van Huijjzen C. The human central nervous system. ed. 4th. NY: Springer; 2008. p. 967. [Google Scholar]
- 10.DeArmond SJ, Fusco MM, Dewey MM. Structure of the human brain : a photographic atlas. ed. 3rd. New York: Oxford University Press; 1989. p. 202. [Google Scholar]
- 11.Aston-Jones G. In: The rat nervous system. Paxinos G, editor. Boston: Elsevier Academic Press, Amsterdam; 2004. pp. 259–294. [Google Scholar]
- 12.Ishimatsu M, Williams JT. Synchronous activity in locus coeruleus results from dendritic interactions in pericoerulear regions. J Neurosci. 1996 Aug 15;16:5196. doi: 10.1523/JNEUROSCI.16-16-05196.1996. [DOI] [PMC free article] [PubMed] [Google Scholar]
- 13.Shulman GL, et al. Interaction of stimulus-driven reorienting and expectation in ventral and dorsal frontoparietal and basal ganglia-cortical networks. J Neurosci. 2009 Apr 8;29:4392. doi: 10.1523/JNEUROSCI.5609-08.2009. [DOI] [PMC free article] [PubMed] [Google Scholar]
- 14.Aston-Jones G, Cohen JD. An integrative theory of locus coeruleus-norepinephrine function: adaptive gain and optimal performance. Annu Rev Neurosci. 2005;28:403. doi: 10.1146/annurev.neuro.28.061604.135709. [DOI] [PubMed] [Google Scholar]
- 15.D'Ardenne K, McClure SM, Nystrom LE, Cohen JD. BOLD responses reflecting dopaminergic signals in the human ventral tegmental area. Science. 2008 Feb 29;319:1264. doi: 10.1126/science.1150605. [DOI] [PubMed] [Google Scholar]
Associated Data
This section collects any data citations, data availability statements, or supplementary materials included in this article.


