

Abstract
Foot sole somatosensory feedback is critical to motor control and declines with aging and disease. To enable study of cortical networks underlying foot sole somatosensation we developed a pneumatic tactile stimulator capable of producing 1-DOF oscillations with preset waveform, frequency (≤10 Hz), force magnitude (5-500 N), duty cycle (20%-100%) and contacted surface area over which pressures are applied to the foot sole. Image tests (anatomical/functional/field map) of a phantom demonstrated that the device is compatible with 3T MRI. GRE-EPI images of seven healthy young adults using a typical block-designed 1Hz sinusoidal stimulation protocol revealed significant activation contralaterally within the primary somatosensory cortex and paracentral gyrus, and bilaterally within the secondary somatosensory cortex. The stimulation system may therefore serve as a research tool to study functional brain networks involved in the perception and modulation of foot sole somatosensation and its relationship to motor control.
Keywords: Plantar, somatosensory, gait, feedback, pneumatic
INTRODUCTION
Foot sole somatosensation plays a critical role among the active feedback loops that contribute to the control of standing and walking. Aging and disease often impair foot sole somatosensation, and consequently, decrease balance and increase the risk of falling. Still, behavioral research indicates that some older adults with foot sole somatosensory impairment can maintain balance to a similar degree as their healthy counterparts (1). Furthermore, both perceptible and imperceptible foot sole vibratory stimulation during standing (2) and walking (3) reduces movement variability in older adults both with and without movement disorders.
In order to determine the neural mechanisms underlying these adaptive capacities, we aimed to develop and evaluate an MRI-compatible tactile stimulator capable of applying controlled patterns of pressure to the foot sole. Numerous devices have been developed to study the brain's response to somatosensory stimuli. These devices have focused primarily on the application of low amplitude, high-frequency vibratory stimuli (4-7). With respect to the foot sole, Gallasch et al (8) successfully mapped somatosensory cortical activation in response to mechanical vibrations (i.e., 20-100 Hz oscillations with an maximum contact force of 20 N) produced by an electrically-driven magnetic actuator.
The pressures experienced beneath the foot during weight-bearing activities, however, often meet or exceed one's body weight and may vary considerably in frequency and amplitude. As a critical first step to enable study of the brain's response to this type of stimuli, we have developed an air-driven stimulation system capable of applying relatively high pressure stimuli to the foot sole with a programmable waveform and adjustable surface area over which the pressure is applied. Combination of this new tool with functional MRI (fMRI) will afford insight into the functional brain networks underlying this source of afferent feedback under different experimental conditions. This experimental paradigm will enable study of the neural circuits underlying foot sole somatosensation and the mechanisms of neural adaptation that optimize behavior in the presence of both acute and chronic alterations to this source of afferent feedback.
METHODS
Basic Design of Tactile Stimulation System
The foot sole stimulation system consists of an air compressor, a control unit (i.e., a microprocessor, proportional valve, 5-port air-operated valve and user-interface) and an aluminum pneumatic actuator attached to a non-ferromagnetic support platform (Fig. 1).
Fig. 1.

Foot sole pressure stimulation is applied to the foot by an aluminum pneumatic actuator attached to a support platform (a). The actuator can be adjusted to any location of the foot sole (b). Force generation is regulated by a control unit located outside of the magnet room (c, lower panel) attached to the non-ferromagnetic actuator and platform (c, upper panel) via 4m plastic air tubes.
Foot sole pressure stimulation is produced by a linear pneumatic actuator consisting of a single-acting, single-rod air cylinder (CG1BN32-40-XC6, SMC, Tokyo, Japan). This actuator was chosen for several reasons. First, it is comprised of aluminum and driven by air and therefore non-ferromagnetic. Second, it is capable of producing linear output force ranging from 5N to 500N, and thus suitable for applications requiring the generation of relatively large pressure stimuli. Third, stroke movement speed is 40-1000mm/s and thus enables rapidly-generated pressures to the foot sole.
The control unit affords independent control of the magnitude and frequency of force application to the foot sole. Specifically, the microprocessor (MSP 430 F168, Texas Instruments, USA) controls air flow to the pneumatic actuator by regulating voltage input to two electronic air valves. First, a proportional electro-pneumatic valve connected to an air compressor enables stepless control of the amount of air flow to the actuator. The relationship between voltage input to the proportional valve and air flow to the actuator is linear (see following section), thus enabling precise control of the magnitude of force application to the foot sole. Second, a 5-port air-operated valve enables movement direction control of the actuator's cylinder and thus, the waveform (i.e., the frequency and duty cycle) of force application. Movement direction of the cylinder can be fully reversed in 100ms, thus enabling a maximal oscillatory frequency of 10 Hz. The microprocessor also produces a trigger in/out (TTL level) signal to synchronize the system with the MR scanner.
We developed a user interface using C programming, which allows the investigator to program the characteristics of foot stimulation. It consists of a 16-character LCD display and four control buttons: one for selection of pre-defined waveforms (sine/square/triangle), waveform parameters (frequency/duty cycle/magnitude) and MRI-trigger options; two for up/down regulation of parameters; one for downloading and applying self-programmed stimulation waveforms. Self-programming allows the investigator to set the force output for each 0.02s increment of one cycle, which can be repeated during stimulation protocols. During stimulation, the magnitude, duty cycle and frequency of force (as determined by voltage input) are displayed on the LCD screen. All components of the control unit are located outside the scanner room and connected with the actuator inside via plastic air tubes.
A support platform was utilized to secure the actuator in place during the application of pressure stimulation. A plastic medical boot was modified and attached to a support surface comprised of non-ferromagnetic plastic and nylon materials. The support platform was designed to fix the ankle joint at 90 deg of dorsiflexion yet enable adjustment of knee and hip joint angle. Visual inspection during pilot studies indicated that applying pressure to the foot sole with the knee joint flexed, as opposed to fully extended, reduced translational movements of the head. The actuator was attached to the support platform perpendicularly to the foot sole using a multi-joint lever system that enabled anterior-posterior and medial-lateral adjustments relative to the foot. A series of Velcro straps secured the support platform to the scanner table, as well as the subject's foot, shank and thigh to the support platform.
Implementation, Calibration and Performance Testing
In order to determine the relationship between voltage input to the proportional electro-pneumatic valve on the air compressor and force output of the actuator, an instrumented foot pressure insole (RSscan Lab LTD, United Kingdom) was first calibrated inside the magnet room and then placed between the foot sole and the cylinder cover of the actuator. The voltage input-force output relationship, which was tested on five young adult subjects using square waveform inside the magnet room, was highly linear (Fig. 2). At each voltage, the standard deviation about the recorded mean force value was less than 0.47 N. As such, we subsequently used a linear-fit function (y = 63.833x-10.164) to transform voltage into force on the LCD display.
Fig. 2.

The relationship between voltage input to the proportional electro-pneumatic valve on the air compressor and the force output of the actuator on the foot sole.
Performance of the stimulation system was then tested with the instrumented pressure insole to measure the actual force produced on the foot sole in response to pre-programmed patterns of stimulation in a single subject inside of the scanner room (Fig. 3). To demonstrate the system's versatility, tested stimulation waveforms included a 1Hz sine curve with a duty cycle of 80%, a 2Hz sine curve with a duty cycle of 20%, a square waveform (80% duty cycle), and a biphasic waveform mimicking the typical ground reaction force experienced when walking.
Fig. 3.

Foot sole stimulation system performance. We compared four different patterns of pre-programmed foot stimulation (green line) to the actual stimulation applied to the foot sole (red line). Stimulation patterns included (a) a 1Hz sine curve with an 80% duty cycle, (b) a 2Hz sine curve with a 20% duty cycle, (c) a square waveform with an 80% duty cycle, (d) a biphasic waveform similar to that experienced by the foot when walking.
fMRI Compatibility
All of the imaging tests were performed on a 3T scanner (Signa Excite HD; GE Medical Systems, Milwaukee, WI, USA) with an eight-channel head coil. With the stimulator located 90cm away from the phantom center (closer than the distance from foot to head), a phantom was imaged under the following conditions: 1) stimulation system powered on; 2) stimulation system powered off; 3) control (i.e., no stimulation system present). Anatomical, functional and magnetic field map images were acquired under each condition. Acquisition parameters were as follows; 1) Anatomical: 3D fast Spoiled Gradient Echo (SPGR) sequence, TR/TE=7.8/3.0ms, flip angle=20°, IR=450ms, FOV=23×23 cm2, slice thick=2.0mm with 1mm overlap, resolution=1×1 mm2, 2 measurements. 2) Functional: GRE-EPI sequence, TR=2000ms, TE=30ms, flip angle=90°, matrix=64×64, thickness/spacing=4mm/1mm, FOV=23×23 cm2, 28 interleaved axial slices, 30 measurements. 3) Magnetic field map: 2D SPGR sequence, TR=488ms, TE1=5.19 ms, TE2=7.65 ms, flip angle=60°, FOV=23×23 cm2, 64 ×64 matrix, 3.0 mm thickness, 1 mm gap, 15 slices.
In addition to a visual inspection of all images for artifacts, ROI image quality parameters were calculated for each image type in each condition using SPM8 software (the Wellcome Trust Centre for Neuroimaging, London, UK) and custom MATLAB (The MathWorks, Inc. Natick, MA) programming. All tests were calculated from a central 30-mm radius circular ROI in the center of the phantom. The signal-to-noise ratio (SNR) of anatomical images was calculated following the methods delivered by National Electrical Manufacturers Association (9). The signal-to-fluctuation-noise ratio (SFNR) of functional images was calculated by creating a “signal image” from the voxel-wise time-series mean without the first ten measurements. Then a fluctuation noise image was formed by detrending the voxel-wise time series with a second-order Legendre polynomial and computing the voxel-wise time-series standard deviation. The signal image was divided by the noise image, and the ROI mean (and standard deviation) of the resulting SFNR image was recorded as the SFNR (10). For the magnetic field maps, the ROI mean and standard deviation were recorded to check for subtle magnetic field perturbations potentially arising from the presence of the device.
The Brain Response to Foot Sole Stimulation
Participants
Seven healthy adults (4M/3F) aged 23-27 years were recruited and signed written informed consent as approved by the local ethical committee. Inclusion criteria were right-foot dominance and the ability to perceive 10g of pressure at five weight-bearing sites on the right foot sole as determined with a 5.07 gauge Semmes-Weinstein monofilament and standard testing procedures. Exclusion criteria included any acute illness, self-reported history of cardiovascular, metabolic, or neurological disease, musculoskeletal disorders and previous surgery on the back or lower-extremities.
Protocol
A block-design fMRI protocol was completed using gradient-recalled echo planar imaging (GRE-EPI) sequences with alternating blocks of foot sole stimulation and rest (i.e., no stimulation). Each block was 30s in duration and repeated three times. With the subject barefoot, foot sole pressure stimulation was applied to a circular area four centimeters in diameter over the head of the first metatarsal of the right foot. Maximum force output of the actuator was set to 10% of the subject's body mass and was applied in a 1Hz sinusoidal waveform with a duty cycle of 80% (i.e., Fig. 3a).
In order to determine if larger pressure stimuli would induce motion artifact due to head movement, a subsample (n=3) completed a block-design protocol in which stimulation was applied in a square waveform (80% duty cycles) with maximum force output set to 40% body mass (i.e., Fig. 3c).
Functional imaging parameters were similar to the phantom test previously described. We acquired 90 volumes with 28 interleaved axial slices covering the entire cerebrum and cerebellum. Following the fMRI protocol, high-resolution structural images of the brain were acquired using the 3D SPGR sequence above.
Imaging and Statistical Analysis
First, in order to quantify the extent of head motion induced by high-frequency foot stimulation, SFNR was calculated from white matter (segmented by SPM8) on raw EPI images with/without foot stimulation on all 7 subjects. Then, functional images were processed by SPM8. Images were first realigned to the first scan to correct for potential head movement between scans and then time-corrected to compensate for delays associated with acquisition time differences. Six-parameter head motion curves were generated. All images were normalized to a 2*2*2mm3 Montreal Neurological Institute (MNI) template. Functional images were spatially smoothed using a Gaussian filter with the full-width/half-maximum parameter (FWHM) set to 8mm and temporally filtered using a cutoff of 128s. General linear modeling (GLM) was applied to detect activation patterns for each individual. One sample t tests were then applied to generate a group result on the t-map of each individual (FDR p<0.05, at least 10 contiguous voxels).
RESULTS
Compatibility of the Foot Sole Stimulation System with 3T MRI
FMRI compatibility tests using the phantom revealed that the foot sole stimulation system did not affect image quality. Within the tested ROI, the SNR of anatomic images, the SFNR of functional images, and the mean and standard deviation of the magnetic field maps were virtually identical with the stimulation system present (whether powered on or off) as compared to the stimulation system absent (Table 1).
Table 1.
MRI compatibility test on phantom center ROI
| Foot Stimulator Condition | Anatomic SNR (mean ± SD) | Functional SFNR (mean ± SD) | Field map mean (mean ± SD) |
|---|---|---|---|
| Powered on | 80 ± 2 | 768 ± 71 | 2013 ±15 |
| Powered off | 81 ± 1 | 771 ± 66 | 2018 ± 15 |
| Absent from room | 79 ± 1 | 764 ± 65 | 2011 ± 15 |
SNR = Signal-to-Noise Ratio; SFNR = Signal-to-Fluctuation-Noise Ratio
Cortical Response to Foot Sole Stimulation
Foot sole stimulation did not induce significant motion artifact due to head movement. Average three-dimensional head translation and rotation relative to the first image were less than 1mm and 1deg in all subjects for both sinusoidal stimuli (magnitude=10% body mass) and square-wave stimuli (magnitude=40% body mass). The average SFNR value calculated from white matter on the raw EPI images was not significantly different (p = 0.46) between conditions of no stimulation (135.6 ± 9.4) and stimulation (136.8 ± 7.2). Furthermore, we did not visually detect remarkable motion artifacts or unthresholded statistical parameter maps during data processing.
1 Hz sinusoidal foot sole pressure stimulation resulted in significant cortical activation contralaterally within the primary somatosensory cortex (postcentral gyrus, Brodmann areas (BA) 1 and 2) and primary motor cortex (paracentral gyrus, BA 4). Bilateral activation was observed within the secondary somatosensory cortex (inferior parietal lobule, BA 40) (FDR P<0.05, k≥10) (Fig. 4). Cerebellar activation was observed in 3 of 7 subjects (uncorrected p<0.001, k≥10); however, this activation did not reach significance in the group map.
Fig. 4.
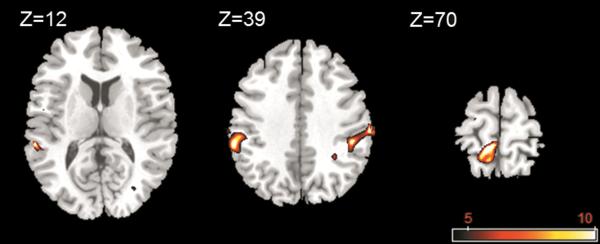
Group activation clusters overlaid on a standard T1 template for the contrasts of the images acquired during foot sole stimulation as compared to rest. Stimulation elicited well-pronounced brain activation contralaterally within the primary somatosensory cortex and the primary motor cortex, and bilaterally within the secondary somatosensory cortex. FMRI maps are in standard neurological convention with left=left and right=right.
DISCUSSION
The foot sole stimulation system accurately produces customized pressure waveforms, can be easily adjusted to stimulate different foot sole areas, and does not interfere with image quality. Oscillatory pressure stimulation applied to a portion of the foot sole was associated with a characteristic network of brain activation in healthy young adults. Furthermore, the oscillatory force stimuli of up to 40% of subject body mass did not cause motion artifact due to head movement. This novel system is therefore feasible for fMRI studies conducted at 3 Tesla and can serve as a valuable research tool to study the functional brain networks involved in the perception and modulation of foot sole somatosensation.
As compared to previous MRI-compatible systems designed to apply low-force vibrotactile stimuli, this air-driven device is capable of greater force output, as well as independent control of the force waveform and surface area over which pressure stimulation is applied. As all control elements and ferromagnetic components are located outside of the scanner room, this versatile system will enable researchers to utilize high-field MRI to study the brain response to an array of customizable foot pressure stimuli.
Our proof-of-concept imaging study demonstrated that 1Hz sinusoidal-wave pressure stimulation to a relatively small portion of one foot sole produced significant brain activation within regions linked to both somatosensory and motor function. Activation within the left primary somatosensory cortex (BA 1 and 2) in response to stimulation of the right foot sole was expected as these regions receive input from both slowly and rapidly adapting cutaneous mechanoreceptors (11,12). Bilateral activation within the secondary somatosensory cortex likely stemmed from a combination of feed-forward projections from the primary somatosensory cortex (13) and transcollosal projections to the ipsilateral hemisphere (14). Significant activation within the contralateral primary motor cortex, which has also been reported in response to vibratory foot sole stimulation(15,16), may have been caused by direct thalamo-cortical proprioceptive projections to the primary motor cortex in response to repetitive stretching of the short muscles within the plantar region of the foot sole (17).
Initial calibration experiments indicated that the voltage-input/force-output relationship of the stimulation system was linear at a constant frequency. Yet, under conditions of varying stimulation frequency, eddy currents created by movement of the aluminum actuator cylinder within the magnetic field may interfere with the force output (18). To test this potential effect, separate experiments were conducted inside and outside the scanner. In each setting, a sinusoidal pressure waveform with a peak force of 200N was applied to the foot sole with an increasing frequency from 1 to 10 Hz. As measured by an instrumented pressure insole, increasing the frequency of oscillation did not affect peak forces outside the magnet room, yet resulted in a small but significant reduction (1.58 N) in peak force production inside the magnet room. This result is consistent with previous research (18) and should therefore be considered when designing protocols. Furthermore, in applications within higher magnetic fields (e.g. 7T), an actuator constructed of glass and graphite materials may be needed to ensure accuracy of foot stimulation.
In conclusion, the foot sole stimulation system does not interfere with image quality, does not produce motion artifact with applied load, and elicits a reliable pattern of brain activation. Future studies that utilize multiple, independently-controlled pneumatic actuators over larger surface areas to stimulate the soles of both feet may more accurately simulate the pressures experienced when standing and walking and enable study of the functional brain networks involved in this critical source of afferent feedback. Experimental paradigms that combine fMRI imaging of the brain during foot sole stimulation under different conditions with behavioral studies of walking will afford first-of-its-kind insight into the cortical networks underlying the control of this fundamental human behavior in both health and disease.
Acknowledgement
Ying Hao and Brad Manor contributed equally to this work. The content is solely the responsibility of the authors and does not necessarily represent the official views of Harvard Catalyst, Harvard University and its affiliated academic health care centers, the National Center for Research Resources, or the National Institutes of Health.
Grant :
Grant sponsor: National Natural Science Foundation of China; Grant number: 31150110173.
Grant sponsor: Fundamental Research Funds for the Central Universities, China.
Grant sponsor: MeRIT award from Harvard Catalyst; Grant number: 5KL2RR025757-04.
Grant sponsor: The Harvard Clinical and Translational Science Center: KL2 RR 025757.
References
- 1.Manor B, Costa MD, Hu K, Newton E, Starobinets O, Kang HG, Peng CK, Novak V, Lipsitz LA. Physiological complexity and system adaptability: evidence from postural control dynamics of older adults. J Appl Physiol. 2010;109(6):1786–1791. doi: 10.1152/japplphysiol.00390.2010. [DOI] [PMC free article] [PubMed] [Google Scholar]
- 2.Costa M, Priplata AA, Lipsitz LA, Wu Z, Huang NE, Goldberger AL, Peng CK. Noise and poise: Enhancement of postural complexity in the elderly with a stochastic-resonance-based therapy. Europhys Lett. 2007;77:68008. doi: 10.1209/0295-5075/77/68008. [DOI] [PMC free article] [PubMed] [Google Scholar]
- 3.Novak P, Novak V. Effect of step-synchronized vibration stimulation of soles on gait in Parkinson's disease: a pilot study. J Neuroeng Rehabil. 2006;3:9. doi: 10.1186/1743-0003-3-9. [DOI] [PMC free article] [PubMed] [Google Scholar]
- 4.Golaszewski SM, Siedentopf CM, Baldauf E, Koppelstaetter F, Eisner W, Unterrainer J, Guendisch GM, Mottaghy FM, Felber SR. Functional magnetic resonance imaging of the human sensorimotor cortex using a novel vibrotactile stimulator. Neuroimage. 2002;17(1):421–430. doi: 10.1006/nimg.2002.1195. [DOI] [PubMed] [Google Scholar]
- 5.Graham SJ, Staines WR, Nelson A, Plewes DB, McIlroy WE. New devices to deliver somatosensory stimuli during functional MRI. Magn Reson Med. 2001;46(3):436–442. doi: 10.1002/mrm.1211. [DOI] [PubMed] [Google Scholar]
- 6.Harrington GS, Wright CT, Downs JR. A new vibrotactile stimulator for functional MRI. Hum Brain Mapp. 2000;10(3):140–145. doi: 10.1002/1097-0193(200007)10:3<140::AID-HBM50>3.0.CO;2-0. [DOI] [PMC free article] [PubMed] [Google Scholar]
- 7.Stippich C, Hofmann R, Kapfer D, Hempel E, Heiland S, Jansen O, Sartor K. Somatotopic mapping of the human primary somatosensory cortex by fully automated tactile stimulation using functional magnetic resonance imaging. Neurosci Lett. 1999;277(1):25–28. doi: 10.1016/s0304-3940(99)00835-6. [DOI] [PubMed] [Google Scholar]
- 8.Gallasch E, Golaszewski SM, Fend M, Siedentopf CM, Koppelstaetter F, Eisner W, Gerstenbrand F, Felber SR. Contact force- and amplitude-controllable vibrating probe for somatosensory mapping of plantar afferences with fMRI. J Magn Reson Imaging. 2006;24(5):1177–1182. doi: 10.1002/jmri.20742. [DOI] [PubMed] [Google Scholar]
- 9.Association NEM . Determination of signal-to-noise ratio (SNR) in diagnostic magnetic resonance imaging. 2008*ed NEMA Standards Publication MS1; 2008. [Google Scholar]
- 10.Friedman L, Glover GH. Report on a multicenter fMRI quality assurance protocol. J Magn Reson Imaging. 2006;23(6):827–839. doi: 10.1002/jmri.20583. [DOI] [PubMed] [Google Scholar]
- 11.Kurth R, Villringer K, Curio G, Wolf KJ, Krause T, Repenthin J, Schwiemann J, Deuchert M, Villringer A. fMRI shows multiple somatotopic digit representations in human primary somatosensory cortex. Neuroreport. 2000;11(7):1487–1491. [PubMed] [Google Scholar]
- 12.Geyer S, Schleicher A, Zilles K. Areas 3a, 3b, and 1 of human primary somatosensory cortex. Neuroimage. 1999;10(1):63–83. doi: 10.1006/nimg.1999.0440. [DOI] [PubMed] [Google Scholar]
- 13.Kany C, Treede RD. Median and tibial nerve somatosensory evoked potentials: middle-latency components from the vicinity of the secondary somatosensory cortex in humans. Electroencephalogr Clin Neurophysiol. 1997;104(5):402–410. doi: 10.1016/s0168-5597(97)00045-2. [DOI] [PubMed] [Google Scholar]
- 14.Burton H, Videen TO, Raichle ME. Tactile-vibration-activated foci in insular and parietal-opercular cortex studied with positron emission tomography: mapping the second somatosensory area in humans. Somatosens Mot Res. 1993;10(3):297–308. doi: 10.3109/08990229309028839. [DOI] [PubMed] [Google Scholar]
- 15.Siedentopf CM, Heubach K, Ischebeck A, Gallasch E, Fend M, Mottaghy FM, Koppelstaetter F, Haala IA, Krause BJ, Felber S, Gerstenbrand F, Golaszewski SM. Variability of BOLD response evoked by foot vibrotactile stimulation: influence of vibration amplitude and stimulus waveform. Neuroimage. 2008;41(2):504–510. doi: 10.1016/j.neuroimage.2008.02.049. [DOI] [PubMed] [Google Scholar]
- 16.Golaszewski SM, Siedentopf CM, Koppelstaetter F, Fend M, Ischebeck A, Gonzalez-Felipe V, Haala I, Struhal W, Mottaghy FM, Gallasch E, Felber SR, Gerstenbrand F. Human brain structures related to plantar vibrotactile stimulation: a functional magnetic resonance imaging study. Neuroimage. 2006;29(3):923–929. doi: 10.1016/j.neuroimage.2005.08.052. [DOI] [PubMed] [Google Scholar]
- 17.Murphy JT, Wong YC, Kwan HC. Afferent-efferent linkages in motor cortex for single forelimb muscles. J Neurophysiol. 1975;38(4):990–1014. doi: 10.1152/jn.1975.38.4.990. [DOI] [PubMed] [Google Scholar]
- 18.Jeneson JA, Schmitz JP, Hilbers PA, Nicolay K. An MR-compatible bicycle ergometer for in-magnet whole-body human exercise testing. Magn Reson Med. 2010;63(1):257–261. doi: 10.1002/mrm.22179. [DOI] [PubMed] [Google Scholar]