

Abstract
SERS spectra of whole human blood, blood plasma and red blood cells on Au nanoparticle SiO2 substrates excited at 785 nm have been observed. For the sample preparation procedure employed here, the SERS spectrum of whole blood arises from the blood plasma component only. This is in contrast to the normal Raman spectrum of whole blood excited at 785 nm and open to ambient air, which is exclusively due to the scattering of oxyhemoglobin. The SERS spectrum of whole blood shows a storage time dependence that is not evident in the non-SERS Raman spectrum of whole blood. Hypoxanthine, a product of purine degradation, dominates the SERS spectrum of blood after ~10 – 20 hours of storage at 8 °C. The corresponding SERS spectrum of plasma isolated from the stored blood shows the same temporal release of hypoxanthine. Thus, blood cellular components (red blood cells, white blood cells and/or platelets) are releasing hypoxanthine into the plasma over this time interval. The SERS spectrum of red blood cells (RBCs) excited at 785 nm is reported for the first time and exhibits well known heme group marker bands, as well as other bands that may be attributed to cell membrane components or protein denaturation contributions. SERS, as well as normal Raman spectra, of oxy- and met-RBCs are reported and compared. These SERS results can have significant impact in the area of clinical diagnostics, blood supply management and forensics.
Keywords: SERS, hypoxanthine, hemoglobin, whole human blood
Introduction
Due to its easy access and key roles in biological activity, qualitative and quantitative chemical analysis of human blood provides a commonly used and key diagnostic for a wide variety of diseases. In addition, measures of blood components allow routine monitoring of many pathologies, as well as health levels in humans more generally. A large number of analytical techniques are employed for these purposes. However, optical analytical approaches for distinguishing specific components in complex biological mixtures often offer advantages of speed, ease-of-use and cost. Raman spectroscopy, in particular, is additionally attractive as a potential diagnostic tool because it requires no extrinsic labeling, is not limited by masking water contributions, and is inherently a multiplexing technique. Raman relies on the inherent vibrational motions as labels, resulting in specific, molecular level spectroscopic signatures, and the narrow vibrational linewidths provide the ability to identify multiple components of a sample mixture from spectral analyses. Raman-based measurements of blood have already been exploited for the identification of molecular specific markers for disease detection and monitoring. For example, the use of whole blood or plasma Raman spectra for glucose level monitoring (diabetes),1, 2 cancer screening,3–7 cardiovascular risk evaluation,8 and detection of rheumatoid arthritis,9 prions,10, 11 hemoglobin related blood diseases,12 early malarial infection,13 renal dysfunction (urea and creatine levels),8 as well as other blood and serum constituents8, 14–16 have been previously described. The complete characterization of the inherent Raman properties of whole blood and its constituents, however, is required for the development of this methodology for accurate diagnostic and clinical applications. This report describes our initial efforts to exploit the well established phenomenon of surface enhanced Raman spectroscopy17–20 (SERS) to more carefully examine the potential for Raman spectroscopy to act as a probe of biological activity in whole human blood and to characterize the SERS features of red blood cells (RBCs), the most common type of cellular component in blood.
In SERS, Raman effective cross-sections are typically enhanced by 106 to 108 for some normal modes of molecules in close proximity to nanostructured metal surfaces when the incident and scattering radiation is resonant with the surface plasmon excitations of these surfaces.17–20 The use of SERS can significantly extend the range of applicability of Raman for monitoring analytes in complex biological samples by offering advantages of sensitivity and specificity over normal spontaneous Raman. The large Raman enhancement factor offers the potential for SERS to be used to detect and identify low concentration blood constituents which maybe difficult to discern via normal Raman scattering. Secondly, the distance and orientation dependence of the SERS enhancement mechanisms could allow access to vibrational modes not readily observed in normal Raman spectra, thus enhancing the structural information available via inelastic light scattering.17, 20, 21 The consequent appearance of vibrational bands that may be weak or missing from normal or resonance Raman spectra of a species may, however, also be a liability especially for complex biological structures in terms of making vibrational assignments. In addition, small vibrational frequency shifts often observed in SERS, resulting from proximity to the SERS active surface,22, 23 can also complicate vibrational band assignments in biological macromolecules. These advantages and complications are illustrated in this SERS study of whole blood, blood plasma and RBCs.
Despite the extensive interest in exploiting SERS for a wide variety of bioanalytical applications and the central biological role of blood, there have been no prior 785 nm excited SERS studies of whole human blood. Only a SERS study of whole blood mixed with Ag colloid excited at 514.5 nm has recently appeared.24 A few bands associated with the heme group were identified. To the best of our knowledge, only a single previous SERS study of RBCs has been previously reported as well.25 In that study SERS spectra of RBCs mixed with Ag colloids appeared to indicate a sub-membrane hemoglobin population as distinct from the cytoplasmic population which dominates the 532 nm excited near resonance Raman spectrum of hemoglobin.
Several investigators have used SERS, however, for the study of disease markers in human serum, including measurements obtained with 785 nm excitation.3–6, 16, 26, 27 The data reported here are crucial to understanding the biological significance of results described in those papers as shown below. A few SERS studies of hemoglobin, including one recent report at 785 nm,28 have been given and discussed in the context of the denaturing effect of metal nanostructured surfaces,29 single molecule spectroscopy30 and sensitive hemoglobin detection.28 The convenient accessibility of hemoglobin electronic transitions for excitation by readily available commercial visible laser frequencies probably lessened the perceived need for SERS studies of whole blood, RBCs and hemoglobin. However, as shown here, SERS provides an alternative and complementary approach for learning about such heme containing samples and Raman-based biomedical applications more generally.
Aside from the medical applications highlighted above, exploiting SERS for blood analysis could also impact other fields. Recently, Raman analysis of body fluids, including blood, has been shown to be of potential value for forensic purposes, allowing nondestructive, rapid, on-site identification of human body fluids.31, 32 Thus the continuing characterization of the Raman activity of human blood and its components may have potential importance additionally in the developing area of forensic science.
Our research group has recent and on-going efforts to develop a SERS based platform for a rapid bacteremia diagnostic. In vitro cultured bacterial cells placed on a novel, in situ grown, Au nanoparticle covered SiO2 SERS active substrate,33 yield reproducible, high quality characteristic spectral signatures that can be used for bacterial identification when combined with a unique multivariate data analysis approach.34, 35 SERS spectra of bacteria have also been observed from enriched bacteria-spiked blood samples36 and efforts are continuing to further develop this protocol.37 However, in developing a SERS based platform for a diagnostic of bacteria enriched from human blood samples, an understanding and characterization of the SERS signals due to whole blood components that may remain after the enrichment process is required and is an additional motivation for these studies.
Thus, the SERS spectra of 785 nm excited whole human blood, blood plasma and its major cellular constituent, RBCs, on Au nanoparticle covered SiO2 substrates33 are reported here. The time dependence of these signals, and their comparison with non-SERS spectra and previous reports, are considered in detail. The results suggest some novel applications for SERS spectroscopy of whole blood and its components.
Experimental
Sample preparations
Following standard protocols, 5 mL of blood was collected by venipuncture from healthy donors into vacutainer blood collection tubes containing EDTA as an anticoagulant (BD, Franklon Lakes, NJ). Samples were stored in an 8 °C refrigerator until required for measurements or additional separation steps. Blood plasma was separated from the blood by centrifugation at 10000 rpm for 2 minutes. RBCs were obtained via a gradient centrifugation procedure. 5mL of human peripheral venous blood with EDTA was layered on 5 mL of polymorphprep liquid (Accurate Chemical and Scientific Corp.) in a 15 mL polypropylene tube. The sample was centrifuged at 450 × g using Eppendorf 5804R centrifuge at 18 °C. All the liquid above the RBC pellet was discarded. The RBC pellet was resuspended in a normal saline solution and washed four times with saline solutions prior to use.
MetRBCs were prepared from a centrifugation (1 min at 10000 rpm) concentrated RBC sample.38 10 μL of concentrated RBCs were suspended in 10 ml of 0.1% (by wt.) sodium nitrite in PBS (phosphate buffered saline) and incubated for one hour at room temperature. MetRBCs were recovered after centrifugation and washed three times with saline before re-suspending in 0.5 mL of saline for data acquisition.
SERS spectral data acquisition
All the SERS spectra reported here were acquired on substrates resulting from an in-situ Au ion doped SiO2 sol-gel procedure previously developed in our laboratory.33 This procedure results in small (2 – 15 particles) aggregates of monodispersed ~80 nm Au nanoparticles covering the outer layer of ~1 mm2 SiO2 substrate. An SEM image of this chemically produced substrate is shown in the Supplementary Information (Fig. S1). The sol-gel based process was maximized for optimal 785 nm excited SERS performance and exhibits a broad surface plasmon resonance centered at ~800 nm. Extensive details concerning the production of these SERS active chips and the characterization of their performance for providing reproducible and strongly enhanced (single cell level) SERS spectra of bacteria when excited by a few milliwatts of 785 nm radiation have been previously described.33
An RM-2000 Renishaw Raman microscope employing either a 50x or 20x objective and 785 nm excitation was used to obtained all of the spectra shown here. SERS spectra typically resulted from < 2 mw of incident laser power in ~10 seconds of illumination time. The 520 cm−1 band of a silicon wafer was used for frequency calibration.
Results and Discussion
Whole human blood
Normal Raman spectra
Raman spectra of whole human blood excited at 785 nm are shown in Fig. 1 for two different methods of sample preparation. These normal (non-SERS) Raman spectra are reported here to allow a comparison with the corresponding, subsequently described 785 nm excited SERS spectra of whole blood. The Raman spectrum of a human blood sample, collected 30 minutes prior to data acquisition and placed in a capped quartz tube to prevent clotting, is the (blue) spectrum, labeled a, in the upper panel of Fig. 1. The Raman spectrum labeled b in the same panel of Fig. 1 results from a drop of blood that has been placed on a silicon wafer, open to the ambient air and allowed to dry for about 1 hour. 1.8 mW of incident laser power and 20 sec data accumulation times are used to acquire these non-SERS Raman spectra. As evident in Fig. 1, there is a close correspondence between the pattern of relative vibrational intensities and frequencies observed in these two 785 nm excited non-SERS Raman spectra of whole human blood. However, small spectral shifts and relative intensity changes are evident for some vibrational features when the liquid (a) and dried blood (b) Raman spectra are compared in greater detail. For example, as seen in the lower panel of Fig. 1, where these spectra are compared in greater detail in the 1200 – 1750 cm−1 region, vibrational band peaks at 1523, 1545, 1605 cm−1 are more prominent in the liquid spectrum, whereas 1563, 1582, 1638 cm−1 bands are relatively stronger in the dried blood spectrum. The relative intensities of the 1212 and 1224 cm1 bands change in the dried and liquid blood spectra, bands at 1374 and 1398 cm−1 are much stronger in the dried blood spectrum, and a number of other bands exhibit small but measureable frequency shifts when these two spectra are carefully compared.
Figure 1.

The normal (non-SERS) Raman spectra excited at 785 nm of a. liquid whole blood in sealed cuvette, and b. dried whole blood sample are shown in upper panel. Frequencies of liquid and dried blood sample corresponding to deoxy- and oxyhemoglobin respectively are shown in the lower panel.
The observed vibrational features in the Raman spectra of whole blood excited by radiation in the 720 – 830 nm range reported previously have been variously attributed to blood proteins24, 31, 32 and other known blood constituents14, 15 (glucose, urea, cholesterol, triglycerides), in addition to hemoglobin. However, based on previous Raman studies of RBCs and hemoglobin excited at 785 nm or in the NIR, all the observed blood bands (Fig. 1) can be assigned to normal modes of either the oxygenated or deoxygenated hemoglobin porphyrin macrocycle and hemoglobin protein constituents.39–44 The observed Raman vibrational frequencies of liquid and dried whole human blood (Fig. 1), and their corresponding vibrational assignments are summarized in Table I. The vibrational bands observed in this normal Raman spectrum are nearly identical to the previously reported non-SERS spectra of whole human blood excited by near IR radiation (720nm or 830 nm).14, 31, 42, 45 Furthermore, comparison with previous Raman studies of oxygenated and deoxygenated single RBCs39 and hemoglobin,40 reveal that the most significant differences between the dried and liquid whole blood Raman spectra excited at 785 nm (Fig. 1) are due to the state of hemoglobin oxygenation. Marker bands associated with oxygenated hemoglobin dominate the dried blood spectrum and those of de-oxygenated hemoglobin dominate the fresh liquid blood spectrum.39, 40 The predominance of deoxygenated hemoglobin for the liquid hemoglobin sample liquid is due to the venous source of this blood sample collected in a vacuum sealed tube, hence limiting its contact with ambient air. The dried blood sample, in contrast, has been open to the ambient air for at least 60 minutes before data acquisition which is sufficient time for oxygen binding.9
Table I.
Observed vibrational bands of “normal” (non-SERS) Raman spectrum of whole human blood (liquid drop and dried blood) at 785 nm
| Observed bandb (cm−1) | Intensity | Assignmenta | Observed bandb (cm−1) | Intensity | Assignmenta |
|---|---|---|---|---|---|
| 347d | m | ν8 | 1127d, 1129ℓ | m | ν5 |
| 380d | w | δ(CβCcCd) | 1173 | w | ν30 |
| 417 | m | δ(Fe-O-O) | 1212ℓ | m | ν5 + ν18 |
| 570 | w | ν(Fe-O2) | 1224 | wℓ, md | ν13 or ν42 |
| 621 | w | ν12 | 1305ℓ, 1311d | w | ν21 |
| 674ℓ, 677d | m | ν7 | 1338ℓ, 1341 | m | ν41 |
| 716 | w | γ11 | 1374d, 1377ℓ | md, vwℓ | ν4 |
| 754 | s | ν15 | 1398 | m | ν20 |
| 788 | w | ν6 | 1450 | s | δ(CH2/CH3) |
| 825ℓ | w | γ10 | 1523ℓ | m | ν38 |
| 856 | tw | 1545ℓ | s | ν11 | |
| 900 | w | p:C-C skeletal | 1563 | s | ν19 |
| 937 | m | ν46 | 1582 | m | ν37 |
| 1003 | s | phenylalanine | 1605ℓ/03d | m | ν(Ca = Cb) |
| 1030 | w | δ(= CbH2)asym | 1621 | s | ν(Ca = Cb) |
| 1054 | w | δ(= CbH2)asym | 1638 | md, wℓ | ν10 |
| 1115ℓ | w | 1654 | w | amide I |
Further evidence that the 785 nm excited non-SERS Raman spectrum of whole blood is exclusively due to hemoglobin is provided by a comparison of the Raman spectra of dried whole blood and ambient exposed (oxygenated) RBCs at this excitation wavelength. The 785 nm excited Raman spectrum of whole blood is virtually identical to that of RBCs as shown in Fig. 2. Thus, in agreement with Sato et al.,42 we find that the 785 nm excited whole blood Raman spectrum is derived exclusively from the hemoglobin of RBCs and gives no information about the other components of this complex inhomogeneous biological mixture.
Figure 2.
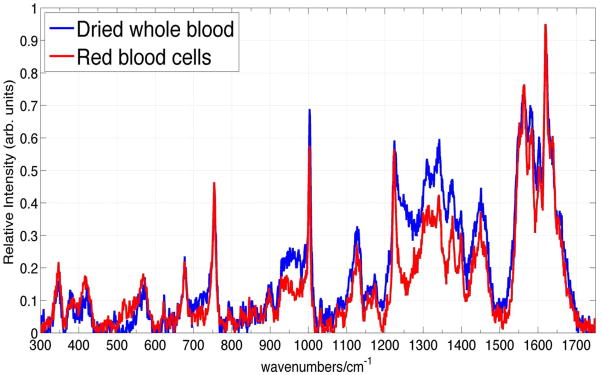
785 nm excited Raman spectrum of dried whole blood and RBCs.
Finally, we note that it is essential to keep incident Raman excitation fluence and total illumination energy at low levels (< 7 × 10⁴ W/cm2, and less than 30 sec data collection time) in order to avoid contributions due to photothermal and photochemical effects in the Raman spectra of whole blood. Above these excitation power levels at 785 nm, fluence dependent Raman spectra, including a broad fluorescence-like emission background, are observed with characteristic new vibrational frequencies due to denaturation and hemoglobin aggregation as previously reported for RBCs.39, 41 This fluence dependence may contribute to some of the variability seen in the previously reported spectra of whole blood.14, 15, 31
SERS spectrum of whole blood
The SERS spectrum of fresh whole human blood excited at 785 nm is shown in Fig. 3b. The freshly drawn blood sample was refrigerated (8°C) prior to SERS measurements. ~1μL of this blood sample was placed on the Au SERS substrate33 and as much of this sample volume as possible was removed immediately with a pipet leaving only a thin film of blood on the SERS active surface. A SERS spectrum was acquired after the sample was allowed to completely dry (~5 minutes). In contrast to the normal Raman spectrum of whole blood (Fig. 3a) excited with ~2mW for 20 sec (20x objective, average of 5 spectra), the SERS spectrum (Fig. 3b) results from 10 sec of 0.45 mW incident 785 nm laser power (50x objective, single scan). In this fresh blood sample, observed ~ 1 hour after being drawn, strong vibrational transitions are observed at 490, 639, 895, 1134, 1362, 1569 and 1649 cm−1 in the SERS spectrum (Fig. 3b). The observed vibrational frequencies of the bands in this SERS spectrum of whole blood are indicated on the displayed SERS spectrum (Fig. 3b). Comparison of the SERS spectrum of whole blood (Fig. 3b) with the normal Raman spectrum excited at 785 nm (Fig. 3a) reveals that there are virtually no vibrational bands that appear in both of these spectra. Thus, the SERS spectrum of whole human blood excited at 785 nm is due to blood components other than hemoglobin. This is in dramatic contrast to the normal Raman spectrum of whole blood excited at 785 nm, which is exclusively due to hemoglobin, as discussed above.
Figure 3.

785 nm excited (b) SERS spectrum of fresh whole blood compared to (a) normal Raman spectrum of dried whole blood, and (c) SERS spectrum of fresh plasma. The peak positions of the bands in the SERS spectrum of fresh whole blood are given in (b).
Although no prior reports of 785 nm excited SERS spectra of fresh whole blood have appeared, a SERS spectrum of whole blood excited at 514.5 nm, resulting from mixing blood with a Ag colloid solution, has been recently published.24 Only a few vibrational bands are evident in that spectrum and they are attributed to hemoglobin, in contrast to the 785 nm SERS results presented here (Fig. 3b). Only two of the 785 nm SERS bands of whole blood (1649 cm−1 and 1569 cm−1) appear to correspond to features seen in the 514.5 nm SERS spectrum (1640 cm−1 and 1587 cm−1). The blood components accounting for this SERS spectrum of whole blood excited at 785 nm are discussed further below.
A key observation central to the use of SERS of whole blood for bioanalytical and diagnostic applications is illustrated in Fig. 4. In the left-hand panel, the SERS spectra of the same blood sample stored at 8 °C are shown as a function of storage time over a period of 24 hours. For display purposes, these spectra have been normalized by the intensity of the largest feature in the 24 hour spectrum at 724 cm−1. As seen in Fig. 4, the 785 nm excited SERS spectrum of whole blood dramatically changes over this time frame. For example, new vibrational bands appear at 724, 965, 1070, 1332, 1365, 1453 cm−1 and increase in relative importance as a function of whole blood storage time. The 24 hour minus the 1 hour difference SERS spectrum of whole blood is shown in the top part of this Fig. 4 panel. This difference spectrum is compared to the SERS spectrum of hypoxanthine, a well-known purine degradation product, in normal saline solution (0.9 % NaCl by weight) in this figure as well. All the major bands of this whole blood difference spectrum correspond in frequency and relative intensity to the SERS spectrum of hypoxanthine. Furthermore, the SERS spectrum of whole blood stored for ~24 hours is essentially that of hypoxanthine. The 490 cm−1 vibrational band is a strong Raman feature of the SERS spectrum of fresh whole blood (Figs. 3b and 4), and thus can be used as an internal standard for the changes in relative intensity as a function of time. Vertical lines at 490 cm−1 and 724 cm−1 in Fig. 4 highlight the changes in relative intensities of these two components over the ~24 hour time period. In the panel on the right-hand side of Fig. 4, the intensity of the 724 cm−1 band of hypoxanthine relative to the 490 cm−1 transition of the fresh whole blood spectrum is plotted as a function of time. As seen in this figure, the time dependence of the hypoxanthine signal is not linear with time and its concentration dramatically increases after ~15 hours of storage. The hypoxanthine signal appears to saturate after ~24 hours, when it is found to completely dominate the 785 nm SERS spectrum of whole blood. In this limited blood sampling, the hypoxanthine concentration in whole blood increases by ~ 50 – 100 times its value in fresh blood and reaches a maximum value of ~ 200 μM, for the blood of the donor followed for the ~24 hour period. This concentration estimate is calibrated by the SERS intensities of hypoxanthine in fresh blood plasma solutions of known concentrations. The time profile of the hypoxanthine signal (Fig. 4) is potentially donor dependent, as well as donor history dependent for a single donor, and will be the subject of future investigations.
Figure 4.

SERS spectrum of whole blood as a function of storage time (4 °C), 24 hour – 1 hour SERS blood difference spectrum and the SERS spectrum of hypoxanthine (Hx) in normal saline solution are shown in the left hand panel. The relative intensities of the time dependent whole blood SERS spectra have been normalized by the observed signal size intensity of the largest feature in the 24 hour spectrum at 724 cm−1. The SERS intensity of the 724 cm−1 band of Hx relative to the 490 cm−1 band of whole blood, and the 724 cm−1 band of Hx relative to the 490 cm−1 band of a blood plasma sample as a function of storage time are shown in the right hand panel.
Aside from revealing that SERS can be a sensitive probe of biological activity in this complex body fluid, and offering a potential means for understanding the fundamental biochemical processes that accounts for this time dependent hypoxanthine signal, the data in Fig. 4 highlight the potential difficulties that can be encountered when trying to develop SERS-based whole blood assays for disease detection and identification due to the “age” of the blood sample alone. The inherent SERS signature of whole blood is time-dependent. This is a complication for the use of whole blood SERS for bioanalytical investigations if fresh blood samples are not used immediately (within ~ 1 hour). In order to further understand the origin and time dependent characteristics of the SERS spectra of human whole blood, a SERS study of all the readily separated constituents of blood is necessary. Here we report in detail only on the temporal evolution of the SERS spectrum of blood plasma. It is important to emphasize that no hypoxanthine bands are evident in the normal, i.e. non-SERS, spectrum of whole blood during this 24 hour period (not shown).
Blood Plasma
~1 μL of blood plasma, the resulting clear yellow supernatant corresponding to the non-particulate liquid component of anti-coagulated blood, was placed on the Au nanoparticle covered SERS substrate. SERS spectra of blood plasma were obtained after waiting ~5 minutes to allow reduction of the sample volume due to water evaporation. A 785 nm excited SERS spectrum of plasma derived from a fresh blood sample (~1 hour after being drawn) is shown in Fig. 3c. The SERS spectrum of plasma resulting from our Au nanoparticle covered SiO2 “chips” (Fig. 3c) exhibits similar vibrational frequencies as reported for the SERS spectra of plasma due to other plasmonically enhancing substrates excited at 785 nm, including enriched Au5 and Ag3, 4, 6, 26 colloid solutions and a PVA-Ag nanoparticle films.27 As seen in Fig. 3, the SERS spectrum of fresh whole blood (Fig. 3b), prepared as described above on our SERS substrate, is virtually identical to that of fresh plasma (Fig. 3c). The pattern of relative band intensities and frequencies are the same in both spectra. Vertical lines in Fig. 3 highlight the correspondence between the features in these two SERS spectra (and their absence in the normal Raman spectrum of whole blood). Thus, the 785 nm excited SERS spectrum of fresh whole blood, resulting from the sample preparation procedure employed here, is dominated by the plasma component of whole blood. When a thin layer of blood is placed on our nanostructured Au surface, no significant vibrational features arising from RBCs, white blood cells (mononuclear or polymorphonuclear cells) or platelets are evident in the whole blood SERS spectrum at this excitation wavelength. The SERS spectrum of fresh blood plasma must arise from the wide variety of components that make up this aqueous solution: proteins (albumins, globulins, fibrinogen, hormones), lipoproteins (protein complexes with cholesterol, phospholipids, triglycerides), carbohydrates (glucose), other small organic molecules (vitamins, steroids, amino acids, nucleic acids) and metabolites excreted by the cells. A detailed vibrational assignment of the chemical origins of the observed features of the reported 785 nm SERS spectrum of fresh human blood plasma, and hence that of fresh whole blood, is outside of the scope of this study and will be addressed in subsequent work.
Further confirmation that the whole blood SERS spectrum is just that of blood plasma and some initial insight into the origin of the time dependent hypoxanthine contribution to the SERS spectrum of whole blood is derived from the time dependence of the SERS plasma signals. The 785 nm excited SERS spectra of plasma as a function of blood storage time are displayed in Fig. 5. This time corresponds to the age of the stored whole blood when the plasma was removed via centrifugation from the whole blood sample and then immediately placed on the SERS substrate for signal acquisition, as described above. The relative intensities of these spectra are normalized to the value of the peak signal size of the 724 cm−1 band at 24 hours. As shown in Fig. 5, this feature is the strongest band in the 785 nm excited SERS spectrum of hypoxanthine. Just as is found for the whole blood spectrum (Fig. 4), hypoxanthine appears in the SERS spectrum of plasma (Fig. 5) over a period of ~24 hours with a rate that appears nearly identical to that seen for the whole blood samples (Fig. 4, right panel). The 24 hour − 0.5 hour SERS difference spectrum of plasma is found to be identical with the SERS spectrum of hypoxanthine (Fig. 5), and the 785 nm excited SERS spectrum of plasma separated from blood stored for ~24 hours is dominated by the spectrum of hypoxanthine. The SERS spectrum of plasma separated from fresh blood and stored independently displays only a very minimal increase in hypoxanthine concentration over this same time frame. Thus, the increasing concentration of hypoxanthine observed in the whole blood spectrum as a function of time (Fig. 4) corresponds to the leakage of this species into the extracellular fluid from one or more cellular components during this time frame. Knowledge of the time dependence of the hypoxanthine contribution to the SERS of whole blood and plasma is essential for the development of a plasma or whole blood based SERS diagnostic.
Figure 5.

SERS spectra of the plasma derived from stored (8 °C) blood as a function of storage time compared with the SERS spectrum of hypoxanthine (x μM) in normal saline solution. The 24 hour – 0.5 hour SERS difference spectrum of stored blood plasma is also shown.
Erythrocytes/RBCs
Erythrocytes or RBCs, primarily responsible for delivering O2 throughout the body, are the most abundant cells in humans and are present in blood at concentrations of 4 – 6 × 10⁹/mL. They are flexible biconcave disks that are 6 – 8 μm in diameter and 2 μm thick. The ratio of RBCs to white blood cells to platelets in human blood is approximately 600:1:40. Furthermore, about 33% of RBCs are hemoglobin by volume. As discussed above, the Raman spectrum of RBCs and dried whole blood excited at 785nm (Fig. 2) is dominated by oxygenated hemoglobin vibrational modes. While a few modes attributable to the non-porphyrin related component of the hemoglobin protein are evident, such as the amide I (1654 cm−1), phenylalanine ring stretching (1003 cm−1) and CH2/CH3 amino acid deformation modes (1450 cm−1), most of the vibrational features are due to the Raman activity of the heme porphyrin moiety in the non-SERS spectrum (Fig. 2). RBCs are a convenient target for Raman studies owing to the well-known visible electronic transitions of the heme group,46 allowing resonance Raman access to the structural sensitive vibrational spectrum.47 The strong Soret (405 – 430 nm, ε ~1.3 – 1.9 x10⁵ M−1cm−1) and weaker α-β band (or Q band) (500 – 600 nm, ε~1.0 × 10⁴ M−1cm−1) transitions are significantly blue shifted from 785 nm, and hence the spectra reported and discussed here are, at best, in the pre-resonant region. A weak charge transfer excitation centered at ~760 nm (ε ~ 300 M−1cm−1) has been identified for deoxyhemoglobin,48 but that species does not appear to be significantly present in these ambient air exposed blood and RBC samples. The 785 nm excited Raman spectrum of RBCs (Figs. 2 and 6) are in agreement with those previously reported for oxygenated RBCs at this excitation wavelength39, 43, 49, 50 as noted above.
Figure 6.
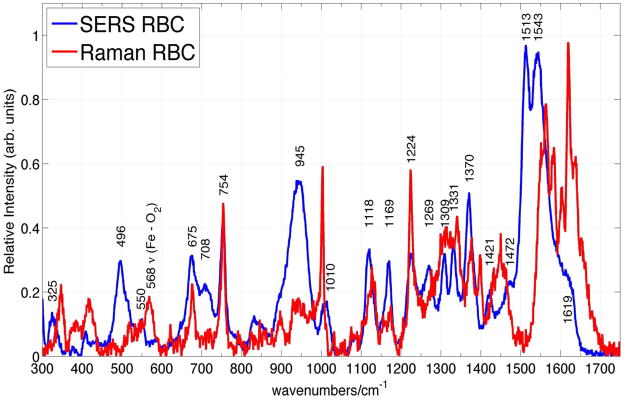
Comparison of SERS and normal Raman spectra of RBCs excited at 785 nm. The observed frequencies and tentative assignment of the RBC SERS vibrational bands are indicated.
The corresponding SERS spectrum of RBCs isolated from fresh whole blood is shown in Fig. 6 and overlapped with the normal Raman spectrum of RBCs excited at 785 nm. To the best of our knowledge, this is the first non-electronically resonant SERS spectrum of RBCs. In fact, only one prior SERS spectrum of RBCs, obtained with excitation at 532 nm, resulting from a red blood cell mixture with Ag colloids, has been reported.25 This visible excitation wavelength is resonant with the Q band region, and thus, the intensities of these vibrational bands, which are also attributed to oxygenated hemoglobin, are both electronically and plasmonically enhanced. Some vibrational bands appear in both SERS spectra, however some very significant differences are evident, as well, between the spectrum reported for 532 nm excitation25 and the 785 nm one reported here (Fig. 6).
As evident in Fig. 6, SERS spectra of red blood cells excited at this nonresonant excitation wavelength are readily attainable with excellent signal to noise. The Raman illumination region (~2.5μm × 15μm) for the 50x objective used in these studies is approximately equal to the area of a single red blood cell, thus these SERS spectra (Fig. 6) are at the single cell level. The enhancement factor for the Raman intensities on the Au substrates employed in these studies can be estimated for the 754 cm−1 band, which is a Raman feature due to the heme group (ν15) observed in both the SERS and normal Raman spectrum of RBCs. When the absolute signal size is normalized for the different incident laser powers, data accumulation times, and number of cells in the scattering volume (1 vs. 20), an enhancement factor of 1.2 × 10³ per red blood cell is obtained for the 754 cm−1 mode. However, the number of hemoglobin molecules that contribute to the bulk Raman and SERS spectra per cell are quite different. Due to the distance dependence of the SERS enhancement mechanisms, only those molecules that are close (< ~ 5 nm) to the nanostructured metal surface will be plasmonically enhanced. Approximately 0.5% of the hemoglobins are estimated to be bound at the inner surface of the red blood cell membrane25, 51, 52 and furthermore, if we estimate that ~40% of the entire cell surface is in close contact with the nanostructured metal surface, then the SERS enhancement factor (EF) is ~106 per hemoglobin. This EF value is lower than what we usually achieve on these SERS substrates (107 – 108),33 but is consistent with the location of the sub-membrane hemoglobin population at a distance of ~ 4–5 nm from the extracellular edge of the red blood.25, 51
The vibrational frequencies of the bands observed in the 785 nm excited normal Raman and SERS spectra of RBCs (Fig. 6) are listed in Table II. Vibrational frequencies for some transitions are unchanged in these SERS and normal Raman spectra of RBCs: 754 cm−1 (ν15), 675 cm−1 (ν7), 1224 cm−1 (ν42/ν13), whereas several appear to red shift in the SERS spectrum: 1375 cm−1 to 1371 cm−1 (ν4), 1127 to 1120 cm−1 (ν5), 1173 to 1169 cm−1 (ν30), 1340 to 1332 cm−1 (ν41), 1551 to 1543 cm−1 (ν11). Other vibrational bands seen in the 785 nm Raman spectrum of RBCs are not evident in the corresponding SERS spectrum: 1654 cm−1 (amide I), 1450 cm−1 (CH2/CH3 amino acid deformation modes), 1399 cm−1 (ν20) and 568 cm−1 (ν Fe-O2) and a few new bands, whose parentage is unclear, appear prominently in the SERS spectrum, for example bands at: 1513 cm−1, 551 cm−1, 1471 cm−1 and 496 cm−1. Interestingly, the Fe-O2 stretch mode at 568 cm−1 is either completely missing in the SERS spectrum or this band is significantly red-shifted perhaps corresponding to the relatively weaker band at 550 cm−1 or to the new strong feature at 496 cm−1 in the SERS red blood cell spectrum (Fig. 6).
Table II.
Observed 785 nm excited Raman and SERS bands of oxyRBCs and metRBCs.
| oxyRBCb (cm−1) | metRBC (cm−1) | SERS oxyRBC (cm−1) | SERS metRBC (cm−1) | Tentative Assignmenta |
|---|---|---|---|---|
| 328 | 328 | |||
| 346 | 347 | ν8 | ||
| 382 | 377 | 380 | 377 | δ(CβCcCd) |
| 408 | 408 | δ(CβCaCb)4 + δ(CβMe) | ||
| 418 | ν21 δ(Fe-O-O) | |||
| 496 | 497 | γ12 | ||
| 551 | ν49 or ν(Fe-O2)? | |||
| 568 | ν (Fe-O2) | |||
| 586 | 586 | ν48 | ||
| 621 | 622 | 621 | 621 | ν12 |
| 675 | 676 | 675 | 674 | ν7 |
| 715 | 715 | 710 | 710 | ν11 |
| 754 | 756 | 754 | 756 | ν15 |
| 832 | 835 | |||
| 897 | 897 | |||
| 939 | 939 | 944 | 939 | ν46 |
| 1003 | 1003 | phe | ||
| 1010 | 1010 | ν45 | ||
| 1031 | 1031 | δ (=CbH2)asym | ||
| 1127 | 1127 | 1120 | 1119 | ν5 |
| 1158 | ν44 | |||
| 1173 | 1174 | 1169 | 1170 | ν30 |
| 1210 | 1213 | ν5 + ν18 or ν13 | ||
| 1224 | 1224 | 1224 | 1228 | ν13 or ν42 |
| 1270 | 1274 | |||
| 1309 | 1309 | 1309 | 1309 | ν21 |
| 1340 | 1340 | 1332 | 1331 | ν41 |
| 1375 | 1372 | 1371 | 1371 | ν4 |
| 1399 | ν20 | |||
| 1422 | 1422 | ν28 | ||
| 1450 | 1450 | δ (CH2/CH3) | ||
| 1471 | ||||
| 1513 | 1515 | |||
| 1551 | 1545 | 1543 | 1539/1547 | ν11 |
| 1563 | 1563 | ν19 | ||
| 1582 | 1582 | ν37 | ||
| 1603 | 1603 | ν (C=C)vinyl | ||
| 1620 | 1621 | 1620 | 1620 | ν (C=C)vinyl |
| 1630 | 1629 | |||
| 1638 | ν10 | |||
| 1654 | 1654 | Amide I |
We considered the possibility that the proximity to the Au nanostructured surface could induce the transition of hemoglobins in the oxyRBCs to methemoglobin, the high-spin ferric heme protein where water takes the place of the dioxygen site.38, 53–55 The Raman and SERS spectra of oxy- and met-RBCs are shown in Fig. 7, and the corresponding observed vibrational band frequencies and assignments are summarized in Table II. The differences between the normal Raman spectra of oxyRBCs and metRBCs excited at 785 nm is more noticeable than between the SERS spectra of these two cells (Fig. 7). However, reproducible small differences between the oxy and met RBCs SERS spectra are found, such as a distinct 1629 cm−1 band in metRBC spectrum which is missing in the oxyRBC spectrum, 551 cm−1 and 1471 cm−1 bands in the oxyRBC spectrum that are not evident in metRBC spectrum, structure in the 1539–1547 cm−1 region of metRBC which is absent in the corresponding oxyRBC spectrum, and other small spectral shifts listed in Table II. Thus, methemoglobin does not appear to be the species responsible for the SERS spectra of RBCs reported here.
Figure 7.

The normal Raman spectra of oxyRBCs and metRBCs excited at 785 nm are compared in the upper panel. The SERS spectra of oxy- and met-RBCs excited at this same wavelength are compared in the lower panel.
As discussed above, SERS spectra can exhibit changes in relative vibrational intensities and small vibrational frequency shifts compared to normal Raman spectra at the same excitation wavelength owing to metal surface interactions, and the orientation and distance dependence of the SERS enhancement mechanisms. Such effects appear to be affecting the SERS spectrum of RBCs reported here. In addition, new vibrational bands or frequency shifted bands may appear as a result of chemical reactivity facilitated by the proximity to the SERS active metal surface. In a prior study, the Soret band resonant SERS spectrum of oxygenated hemoglobin in a Ag colloidal solution, exhibited vibrational bands assigned to the formation of surface bound hemin μ-oxo dimers.29 Thus, heme proteins may be denatured by adsorption to the metal surface, at least under conditions of electronic resonance. Whether denaturation is responsible for the spectral changes in the SERS observed here in these nonresonant excitation conditions for the heme chromophore in the red blood cell environment will be further investigated by studies of the heme chromophore alone in these excitation condition on the Au SERS active surfaces used here and in Ag colloids. Furthermore, for intact RBCs, hemoglobin is located ~ 4–5 nm from the outer layer,25, 51, 52 presumably reducing the potential for the heme moiety to leave the surrounding protein and aggregate at the metal surface, as noted above in the electronically resonant hemoglobin SERS study.29 SERS bands of RBCs tend to be broader than their corresponding vibrational transitions in the normal Raman spectrum (Fig. 6). This may be attributable to a number of effects resulting from the interaction with the nanostructure metal surface, including a large inhomogeneous distribution of interaction strengths with the surface, enhanced vibrational dephasing rates or enhanced contributions of low frequency protein modes arising from local heating effects. Previously identified characteristic heme aggregation marker bands39, 41 (1248 cm−1, 973 cm−1) discussed above are not evident in the observed SERS spectra of RBCs (Fig. 6) thus eliminating this potential non-native heme-based contribution to these SERS spectra.
One possible origin for the SERS vibrational bands without obvious heme parentage in the 785 nm SERS spectrum of RBCs (Fig. 6), e.g. 1513 cm−1, 1010 cm−1, 945 cm−1 or 496 cm−1, are the protein, lipid or carbohydrate components of the red blood cell membrane. Judging by the microscopic images obtained simultaneously with the SERS acquisition, these SERS spectra appear to result from intact erythrocytes. Thus, it is at least plausible that the red cell membrane components (glycoproteins, glycolipids, spectrin, cholesterol, phospholipids, transmembrane proteins, etc.), which must be closer to the SERS active surface than the hemoglobins, will contribute to these SERS spectra. Subsequent SERS studies of red blood cell ghosts and model compounds will further explore this possible origin of the “new” vibrational features in the red blood cell SERS spectra reported here.
In the one previous SERS spectrum of RBCs,25 resulting from Q-band resonant 532 nm excitation of erythrocytes mixed with Ag colloids, small frequency shifts were observed for selected bands, relative intensities are significantly altered and a few new bands are observed in the SERS spectrum although these are not commented on in that report. These observations are similar to the qualitative features that distinguish the 785 nm SERS and non-SERS spectra reported. However, the pattern of relative intensities at these two excitation frequencies cannot be directly compared due to the resonant excitation condition of the 532 nm radiation as compared to the non-resonant 785 nm excitation. In the 532 nm study, RBCs mixed with Ag nanoparticles exhibited no change in membrane fluidity, indicating the integrity of the cell membrane in the presence of the SERS active substrate and, at least suggesting that the changes in the vibrational spectra are not due to significant hemoglobin denaturation. Furthermore, the observed SERS spectra were used to distinguish sub-membrane hemoglobin from free unbound cytosolic hemoglobin due to the distance dependence of SERS.25 Similar analysis will be carried out subsequently for RBCs on our substrates at this electronically nonresonant excitation wavelength.
With respect to the origin of the hypoxanthine signal in blood, no hypoxanthine vibrational bands are seen in the SERS spectrum of RBCs (Fig. 6), and furthermore, no appreciable hypoxanthine vibrational features are observed in the SERS spectra of RBCs that have been stored in PBS or saline solution at 8 °C for 24 hours (not shown). The dependence of the RBC SERS spectrum as a function of storage time in plasma will be the subject of a future study.
Significance of hypoxanthine signal
Hypoxanthine is a well-known, ubiquitous metabolite that is produced in the highly conserved purine degradation pathway found in both prokaryotic and eukaryotic cells. The nearly 100 fold increase of hypoxanthine in plasma of stored blood after 24 hours was first noted more than 55 years ago via a procedure which involved deproteinization of the blood, conversion of hypoxanthine to uric acid by xanthine oxidase, and spectrophotometric determination of the uric acid concentration found by a UV absorption decrease following addition of the enzyme uricase.56–58 Subsequently, techniques based on high-performance liquid chromatography following various procedures for deproteinization, have been employed for determinations of hypoxanthine levels in whole blood or blood plasma.59–65 The ability to accurately measure levels of hypoxanthine in blood or plasma is important for purine metabolism disorders such as xanthine oxidase deficiency,59, 66 hyperuricemia (gout)67 and fetal hypoxia.68 Elevated hypoxanthine has also been used in the early detection of acute cardiac ischemia62, 65 and may be a marker of pre-labor fetal development problems.64 The substitution of a SERS based methodology for detection of hypoxanthine and related small molecules offers advantages relative to HPLC approaches. Firstly, SERS detection is fast, thus allowing essentially “real time” concentration measures to be determined both for rapid diagnostic capabilities as well as aiding fundamental studies of the biochemical mechanisms involving these species. Secondly, the SERS optical approach is easy to use. It requires minimal sample handling as compared to the HPLC approach. No deproteinization step is necessary, no additional chemical treatment steps are needed for detection, and no instrument calibration procedures, as required for HPLC-based identification techniques, have to be performed. Both chromatographic and SERS based techniques are inherently multiplexing detection schemes. Hypoxanthine and related compounds, such as adenine, adenosine, xanthine, inosine, and uric acid are all strong SERS scatterers and can be spectrally distinguished. However, the sensitivity offered by SERS for hypoxanthine detection is as good, if not better, than that of HPLC. We have found that hypoxanthine in plasma can be detected at the ~1 nM level, which appears to be more than an order of magnitude lower than that reported for HPLC methods.62, 63, 66 Thus, SERS should provide a potentially valuable substitute for HPLC-based methods for the detection, identification and quantification of purine compounds in blood or blood plasma for a variety of medical applications.
Conclusions
SERS spectra of whole human blood, plasma and RBCs excited at 785 nm are reported for the first time and reveal a number of effects that are relevant to potential biomedical applications. In contrast to the normal Raman spectrum of whole blood, which is dominated by transitions to vibrational modes of hemoglobin, the SERS spectrum of fresh whole blood is only due to blood plasma when the sample preparation procedure employed here is followed. When a thin layer of whole blood is allowed to dry on our in situ grown Au nanoparticle covered SiO2 substrates, a SERS spectrum due to the proteins, lipoproteins, carbohydrates and other small molecules including metabolites that are found in blood plasma is observed. For this sample preparation procedure, no cellular components of blood (RBCs, white blood cells, or platelets) contribute to the SERS spectrum of whole blood excited at 785 nm. Other methods for bringing this biological complex mixture into contact with metal nanoparticles, such as the more traditional Ag or Au nanoparticle colloid mixtures, as previously employed at 514 nm excitation,24 may yield different SERS spectra of whole blood at this excitation wavelength (785 nm). The whole blood spectra due to these types of SERS media, as well as the Ag version of the sol-gel based Au substrates,36 will be contrasted with the whole blood SERS results described here in subsequent work.
Excellent signal/noise SERS spectra of RBCs are obtained on the Au nanoparticle covered substrates excited at 785 nm, as shown here, and are the first reported at this excitation wavelength. Some vibrational bands are readily assignable to hemoglobin. The hemoglobin parentage of other slightly perturbed bands appear clear as well. However, the vibrational assignment of additional robust vibrational bands in this spectrum, which may be due to red blood cell membrane components or denaturation products, is outside the scope of this initial study and will be addressed in detail in following studies.
The time dependence of the SERS spectra of whole blood is probably the most significant biological results reported here. The SERS spectrum of whole blood becomes dominated by the vibrational signature of hypoxanthine within ~24 hours as a function blood storage time after collection. The concentration of hypoxanthine is found to increase from the μM level to the several hundred μM level rather suddenly after ~15 hours, at least for the two donor blood samples described here. This component, and hence this biological activity, is not evident in the normal Raman spectrum excited at 785 nm. Firstly, this speaks to the importance of using fresh human blood most generally for analytical probes of blood for disease detection and monitoring. Secondly, several studies employing 785 nm SERS spectra of serum for detection of different diseases, such as colorectal cancer,5 diabetes,26 nasopharyngeal cancer3 and gastric cancer4 have appeared very recently. The strongest vibrational band of the hypoxanthine at 724 cm−1 is evident in these SERS spectra. It is misidentified as adenine or coenzyme A and used as a disease marker in these multivariate data analysis based detection procedures. Knowledge of the time dependence of this hypoxanthine signature is critical for the accurate evaluation of the potential of such SERS based detection schemes and underscores the importance of understanding the chemical origins of hypoxanthine in this complex biological fluid. Subsequent studies must also determine the variability of the hypoxanthine rate of release in the population as a whole and for a given individual. In addition to the clinical applications, the time dependence of the hypoxanthine contribution to the SERS spectrum of human blood may be exploited as an age marker for forensic purposes, aside from the overall sensitivity enhancement that SERS detection provides.
In order to determine which of the cellular components account for the observed dramatic increase in hypoxanthine in stored blood, we will follow the time course of the SERS signals from RBCs, polymorphonuclear leukocytes, mononuclear leukocytes, and platelets in plasma. Identifying the particle or particles releasing hypoxanthine in blood and following its time course and magnitude via SERS in response to different stimuli will be useful for developing a molecular level understanding of the biochemical mechanism responsible for this dramatic effect. As described above, SERS would make a very attractive alternative to HPLC-based methods for monitoring purine compounds, including hypoxanthine, for the detection and study of a number of diseases or conditions such as xanthine oxidase deficiency, hyperuricemia, fetal hypoxia, fetal development problems and, perhaps most significantly, ischemic heart disease.
Supplementary Material
Acknowledgments
The support of the National Institute of Health (Grant # 1R01AI090815-01) is gratefully acknowledged.
Footnotes
Supporting Information Available
An SEM image of a typical Au nanostructured substrate used to acquire the SERS spectra described in this study is given in Figure S1. This information is available free of charge via the Internet at http://pubs.acs.org
References
- 1.Berger AJ, Itzkan I, Feld MS. Spectrochim Acta A. 1997;53:287–292. doi: 10.1016/s1386-1425(96)01779-9. [DOI] [PubMed] [Google Scholar]
- 2.Lyandres O, Shah NC, Yonzon CR, Walsh JT, Jr, Glucksberg MR, Van Duyne RP. Anal Chem. 2005;77(19):6134–9. doi: 10.1021/ac051357u. [DOI] [PubMed] [Google Scholar]
- 3.Feng S, Chen R, Lin J, Pan J, Chen G, Li Y, Cheng M, Huang Z, Chen J, Zeng H. Biosens Bioelectron. 2010;25(11):2414–9. doi: 10.1016/j.bios.2010.03.033. [DOI] [PubMed] [Google Scholar]
- 4.Feng SY, Pan J, Wu Y, Lin D, Chen Y, Xi G, Lin J. Chen, R Sci China Life Sci. 2011;54:828–834. doi: 10.1007/s11427-011-4212-8. [DOI] [PubMed] [Google Scholar]
- 5.Lin D, Feng S, Pan J, Chen Y, Lin J, Chen G, Xie S, Zeng H, Chen R. Opt Express. 2011;19(14):13565–77. doi: 10.1364/OE.19.013565. [DOI] [PubMed] [Google Scholar]
- 6.Lin J, Chen R, Feng S, Pan J, Li B, Chen G, Lin S, Li C, Sun L-q, Huang Z, Zeng H. Journal of Raman Spectroscopy. 2011;43:497–502. [Google Scholar]
- 7.Harris AT, Lungari A, Needham CJ, Smith SL, Lones MA, Fisher SE, Yang XB, Cooper N, Kirkham J, Smith DA, Martin-Hirsch DP, High AS. Head Neck Oncol. 2009;1:34. doi: 10.1186/1758-3284-1-34. [DOI] [PMC free article] [PubMed] [Google Scholar]
- 8.Hanlon EB, Manoharan R, Koo TW, Shafer KE, Motz JT, Fitzmaurice M, Kramer JR, Itzkan I, Dasari RR, Feld MS. Phys Med Biol. 2000;45(2):R1–59. doi: 10.1088/0031-9155/45/2/201. [DOI] [PubMed] [Google Scholar]
- 9.Hoey S, Brown DH, McConnell AA, Smith WE, Marabani M, Sturrock RD. J Inorg Biochem. 1988;34(3):189–99. doi: 10.1016/0162-0134(88)85029-3. [DOI] [PubMed] [Google Scholar]
- 10.Carmona P, Monleon E, Monzon M, Badiola JJ, Monreal J. Raman analysis of prion protein in blood cell membranes from naturally affected scrapie sheep. Vol. 11. Cell Press; Cambridge, MA, ETATS-UNIS: 2004. p. 6. [DOI] [PubMed] [Google Scholar]
- 11.Alvarez-Puebla RA, Agarwal A, Manna P, Khanal BP, Aldeanueva-Potel P, Carbo-Argibay E, Pazos-Perez N, Vigderman L, Zubarev ER, Kotov NA, Liz-Marzan LM. Proc Natl Acad Sci U S A. 2011;108(20):8157–61. doi: 10.1073/pnas.1016530108. [DOI] [PMC free article] [PubMed] [Google Scholar]
- 12.Rusciano G, De Luca AC, Pesce G, Sasso A. Sensors. 2008;8:7818–7832. doi: 10.3390/s8127818. [DOI] [PMC free article] [PubMed] [Google Scholar]
- 13.Wood BR, Stoddart PR, McNaught D. Aust J Chem. 2011;64:593–599. [Google Scholar]
- 14.Berger AJ, Koo TW, Itzkan I, Horowitz G, Feld MS. Appl Opt. 1999;38:2916–2916. doi: 10.1364/ao.38.002916. [DOI] [PubMed] [Google Scholar]
- 15.Enejder AMK, Koo TW, Oh J, Hunter M, Sasic S, Feld MS. Opt Lett. 2002;27:2004–2006. doi: 10.1364/ol.27.002004. [DOI] [PubMed] [Google Scholar]
- 16.Stokes RJ, McBride E, Wilson CG, Girkin JM, Smith WE, Graham D. Appl Spectrosc. 2008;62(4):371–6. doi: 10.1366/000370208784046812. [DOI] [PubMed] [Google Scholar]
- 17.Dieringer JA, McFarland AD, Shah NC, Stuart DA, Whitney AV, Yonzon CR, Young MA, Zhang X, Van Duyne RP. Faraday Discuss. 2006;132:9–26. doi: 10.1039/b513431p. [DOI] [PubMed] [Google Scholar]
- 18.Camden JP, Dieringer JA, Zhao J, Van Duyne RP. Acc Chem Res. 2008;41(12):1653–61. doi: 10.1021/ar800041s. [DOI] [PubMed] [Google Scholar]
- 19.Jeanmaire DL, Van Duyne RP. J Electroanal Chm. 1977;84:1–20. [Google Scholar]
- 20.Moskovits M. Rev Mod Physics. 1985;57:783–826. [Google Scholar]
- 21.Lombardi JR, Birke RL. J Phys Chem C. 2008;112:5605–5617. [Google Scholar]
- 22.Takahashi M, Niwa M, Ito M. The Journal of Physical Chemistry. 1987;91(1):11–14. [Google Scholar]
- 23.Fleger Y, Mastai Y, Rosenbluh M, Dressler DH. Surf Sci. 2009;603:788–793. [Google Scholar]
- 24.Casella M, Lucotti A, Tommasini M, Bedoni M, Forvi E, Gramatica F, Zerbi G. Spectrochim Acta A Mol Biomol Spectrosc. 2011;79(5):915–9. doi: 10.1016/j.saa.2011.03.048. [DOI] [PubMed] [Google Scholar]
- 25.Brazhe NA, Abdali S, Brazhe AR, Luneva OG, Bryzgalova NY, Parshina EY, Sosnovtseva OV, Maksimov GV. Biophys J. 2009;97(12):3206–14. doi: 10.1016/j.bpj.2009.09.029. [DOI] [PMC free article] [PubMed] [Google Scholar]
- 26.Han HW, Yan XL, Dong RX, Ban G, Li K. Appl Phys B. 2009;94:667–672. [Google Scholar]
- 27.Liu R, Zi X, Kang Y, Si M, Wu Y. J Raman Spectrosc. 2011;42:137–144. [Google Scholar]
- 28.Kang Y, Si M, Liu R, Qiao S. J Raman Spectrosc. 2009;41:614–617. [Google Scholar]
- 29.Smulevich G, Spiro TG. J Phys Chem. 1985;89:5168–5173. [Google Scholar]
- 30.Xu H, Bjerneld EJ, Kall M, Borjesson L. Phys Rev Lett. 1999;83:4357–4360. [Google Scholar]
- 31.Virkler K, Lednev IK. Anal Bioanal Chem. 2010;396(1):525–34. doi: 10.1007/s00216-009-3207-9. [DOI] [PubMed] [Google Scholar]
- 32.Sikirzhytski V, Virkler K, Lednev IK. Sensors. 2010;10:2869–2884. doi: 10.3390/s100402869. [DOI] [PMC free article] [PubMed] [Google Scholar]
- 33.Premasiri WR, Moir DT, Klempner MS, Krieger N, Jones G, II, Ziegler LD. J Phys Chem B. 2005;109:312–320. doi: 10.1021/jp040442n. [DOI] [PubMed] [Google Scholar]
- 34.Patel IS, Premasiri WR, Moir DT, Ziegler LD. J Raman Spectrosc. 2008;39(11):1660–1672. doi: 10.1002/jrs.2064. [DOI] [PMC free article] [PubMed] [Google Scholar]
- 35.Premasiri WR, Gebregziabher Y, Ziegler LD. Appl Spectrosc. 2011;65(5):493–9. doi: 10.1366/10-06173. [DOI] [PMC free article] [PubMed] [Google Scholar]
- 36.Premasiri WR, Moir DT, Klempner MS, Ziegler LD. Surface enhanced Raman scattering of microorganisms. In: Kneipp K, Aroca R, Kneipp H, Wentrup-Byrne E, editors. New Approaches in Biomedical Spectroscopy. Oxford University Press; New York: 2007. p. 164. [Google Scholar]
- 37.Zhang JY, Do J, Premasiri WR, Ziegler LD, Klapperich CM. Lab Chip. 2010;10(23):3265–3270. doi: 10.1039/c0lc00051e. [DOI] [PMC free article] [PubMed] [Google Scholar]
- 38.Wood BR, Tait B, McNaughton D. Biochim Biophys Acta. 2001;1539(1–2):58–70. doi: 10.1016/s0167-4889(01)00089-1. [DOI] [PubMed] [Google Scholar]
- 39.Wood BR, Caspers P, Puppels GJ, Pandiancherri S, McNaughton D. Anal Bioanal Chem. 2007;387(5):1691–703. doi: 10.1007/s00216-006-0881-8. [DOI] [PubMed] [Google Scholar]
- 40.Venkatesh B, Ramasamy S, Mylrajan M, Asokan R, Manoharan PT, Rifkind JM. Spectrochim Acta A. 1999;55:1691–1697. doi: 10.1016/s1386-1425(99)00008-6. [DOI] [PubMed] [Google Scholar]
- 41.Wood BR, Hammer L, Davis L, McNaughton D. Journal of Biomedical Optics. 2005;10(1):014005–13. doi: 10.1117/1.1854678. [DOI] [PubMed] [Google Scholar]
- 42.Sato H, Chiba H, Tashiro H, Ozaki Y. J Biomed Opt. 2001;6(3):366–70. doi: 10.1117/1.1380668. [DOI] [PubMed] [Google Scholar]
- 43.Bankapur A, Zachariah E, Chidangil S, Valiathan M, Mathur D. PLoS One. 2010;5(4):e10427. doi: 10.1371/journal.pone.0010427. [DOI] [PMC free article] [PubMed] [Google Scholar]
- 44.Karumuri SR, Sekhar JV, Sreeram V, Uma Maheswara rao V, Basaveswara Rao MV. Journal of Molecular Spectroscopy. 2011;269(1):119–123. [Google Scholar]
- 45.Buschman HP, Marple ET, Wach ML, Bennett B, Schut TC, Bruining HA, Bruschke AV, van der Laarse A, Puppels GJ. Anal Chem. 2000;72(16):3771–5. doi: 10.1021/ac000298b. [DOI] [PubMed] [Google Scholar]
- 46.Antonini E, Brunori M. Hemoglobin and Myoglobin in their Reactions with Ligands. North Holland; Amsterdam, The Netherlands: 1971. [Google Scholar]
- 47.Spiro TG. Biological Applications of Raman Spectroscopy Vol. 3: Resonance Raman Spectra of Heme and Metalloproteins. Wiley; New York: 1988. [Google Scholar]
- 48.Eaton WA, Hanson LK, Stephens PJ, Sutherland JC, Dunn JBR. J Am Chem Soc. 1978;100:4991–5003. [Google Scholar]
- 49.Zachariah E, Bankapur A, Santhosh C, Valiathan M, Mathur D. J Photochem Photobiol B. 2010;100(3):113–6. doi: 10.1016/j.jphotobiol.2010.05.009. [DOI] [PubMed] [Google Scholar]
- 50.Liu R, Zheng L, Matthews DL, Satake N, Chan JW. Appl Phys Lett. 2011;99:043702-1-3. [Google Scholar]
- 51.Shaklai N, Yguerabide J, Ranney HM. Biochemistry. 1977;16(25):5585–92. doi: 10.1021/bi00644a031. [DOI] [PubMed] [Google Scholar]
- 52.Shaklai N, Yguerabide J, Ranney HM. Biochemistry. 1977;16(25):5593–7. doi: 10.1021/bi00644a032. [DOI] [PubMed] [Google Scholar]
- 53.Garrett RH, Grisham CM. Biochemistry. 4. Brooks/Cole; Boston: 2010. [Google Scholar]
- 54.Spiro TG, Strekas TC. J Am Chem Soc. 1974;96(2):338–45. doi: 10.1021/ja00809a004. [DOI] [PubMed] [Google Scholar]
- 55.Wood BR, McNaughton D. Biopolymers. 2002;67(4–5):259–62. doi: 10.1002/bip.10120. [DOI] [PubMed] [Google Scholar]
- 56.Jorgensen S, Poulsen HE. Acta Pharmacol Toxicol (Copenh) 1955;11(3):223–43. doi: 10.1111/j.1600-0773.1955.tb00222.x. [DOI] [PubMed] [Google Scholar]
- 57.Jorgensen S. Acta Pharmacol et Toxicol. 1955;11:265–276. [PubMed] [Google Scholar]
- 58.Jorgensen S, Poulsen HE. Acta Pharmacol Toxicol (Copenh) 1955;11(3):287–94. doi: 10.1111/j.1600-0773.1955.tb00228.x. [DOI] [PubMed] [Google Scholar]
- 59.Boulieu R, Bory C, Baltassat P, Gonnet C. Anal Biochem. 1983;129(2):398–404. doi: 10.1016/0003-2697(83)90568-7. [DOI] [PubMed] [Google Scholar]
- 60.Kojima T, Nishina T, Kitamura M, Kamatani N, Nishioka K. Clin Chem. 1986;32:287–290. [PubMed] [Google Scholar]
- 61.Harmsen E, de Jong JW, Serruys PW. Clin Chim Acta. 1981;115(1):73–84. doi: 10.1016/0009-8981(81)90108-x. [DOI] [PubMed] [Google Scholar]
- 62.Himmel HM, Sadony V, Ravens U. J Chromatogr. 1991;568(1):105–15. doi: 10.1016/0378-4347(91)80344-c. [DOI] [PubMed] [Google Scholar]
- 63.Liu Z, Li T, Wang E. Analyst. 1995;120(8):2181–4. doi: 10.1039/an9952002181. [DOI] [PubMed] [Google Scholar]
- 64.Sawa R, Yoneyama Y, Otsubo Y, Suzuki S, Kubonoya K, Power GG, Araki T. J Clin Endocrinol Metab. 1997;82(12):4028–31. doi: 10.1210/jcem.82.12.4403. [DOI] [PubMed] [Google Scholar]
- 65.Farthing D, Sica D, Gehr T, Wilson B, Fakhry I, Larus T, Farthing C, Karnes HT. J Chromatogr B Analyt Technol Biomed Life Sci. 2007;854(1–2):158–64. doi: 10.1016/j.jchromb.2007.04.013. [DOI] [PubMed] [Google Scholar]
- 66.Boulieu R, Bory C, Baltassat P, Gonnet C. J Chromatogr. 1982;233:131–40. doi: 10.1016/s0378-4347(00)81739-9. [DOI] [PubMed] [Google Scholar]
- 67.Yamamoto T, Moriwaki Y, Takahashi S, Nasako Y, Yamakita J, Hiroishi K, Higashino K. Anal Biochem. 1995;227(1):135–9. doi: 10.1006/abio.1995.1262. [DOI] [PubMed] [Google Scholar]
- 68.O’Connor MC, Harkness RA, Simmonds RJ, Hytten FE. Br J Obstet Gynaecol. 1981;88(4):381–90. doi: 10.1111/j.1471-0528.1981.tb01001.x. [DOI] [PubMed] [Google Scholar]
- 69.Abe M, Kitagawa T, Kyogoku Y. J Chem Phys. 1978;69:4526–4534. [Google Scholar]
- 70.Hu S, Smith KM, Spiro TG. J Am Chem Soc. 1996;118:12638–12646. [Google Scholar]
Associated Data
This section collects any data citations, data availability statements, or supplementary materials included in this article.