Abstract
Through microfluidic interrogation we analyzed real-time calcium responses of HEK293 cells stimulated with short pulses of the M3 muscarinic receptor ligand carbachol in two different concentration regimes. Lower ligand concentrations elicit oscillatory calcium signals while higher concentrations trigger a rapid rise that eventually settles down at a steady-state slightly above pre-stimulus levels, referred to as an acute signal. Cells were periodically pulsed with carbachol at these two concentration regimes using a custom-made microfluidic platform, and the resulting calcium signals were measured with a single fluorescent readout. Pulsed stimulations at these two concentration regimes resulted in multiple types of response patterns that each delivered complementary information about the M3 muscarinic receptor signaling pathway. These multiple types of calcium response patterns enabled development of a comprehensive mathematical model of multi-regime calcium signaling. The resulting model suggests that dephosphorylation of deactivated receptors is rate limiting for recovery of calcium signals in the acute regime (high ligand concentration), while calcium replenishment and IP3 production determine signal recovery in the oscillatory regime (low ligand concentration). This study not only provides mechanistic insight into multi-regime signaling of the M3 muscarinic receptor pathway, but also provides a general strategy for analyzing multi-regime pathways using only one fluorescent readout.
Introduction
Due to the complexity of cell signaling pathways, multiple response patterns need to be measured in order to enable direct reconstruction of signaling pathway architecture and responses. Temporally-patterned stimulation, aided in part by the advent of microfluidic technology (1–3), combined with live cell imaging of cellular signaling pathways has become an instrumental approach for elucidation of pathway architectures and responses. Analysis of signaling dynamics upon application of multiple precisely-timed pulses of chemical stimulation has led to the discovery of feedback mechanisms (4–6), placed constraints on molecular parameters (7), uncovered phenotypic switching phenomena (8) and extrinsic noise (9), and enabled tracking of receptor phosphorylation (10). Periodic stimulation has also been employed in the context of manipulating intracellular signals (11–14), an attractive method for controlling signaling pathways whose information is frequency encoded (15, 16).
Recently, we reported that a single fluorescent readout of calcium can be used to obtain two novel measures of calcium responses, the phase locking ratio and sub-threshold spikes, using temporally patterned microfluidic receptor stimulation (17). The phase locking ratio is a measure of the fraction of time that a system responds to a periodic stimulus. For the aforementioned study, periodic pulses of carbachol elicited calcium responses, but not always in a 1:1 ratio; in some cases, the number of calcium responses was less than the number of periodic carbachol pulses, indicative of skipped signals. These skipped signals were at times manifested as sub-threshold spikes, which represented calcium responses that were a small fraction of their average amplitude. We further showed that these two calcium response patterns, when compared with computational model predictions, are useful for efficiently discriminating among multiple plausible signaling pathway architectures. In our current study, we hypothesized that use of two very different levels of stimulation could elicit calcium responses with rate limiting steps at different parts of the signaling pathway; in doing so, we could potentially further enhance the number of available types of response patterns for elucidating signaling mechanisms, as compared to focusing on response patterns only at low concentrations.
Signaling through the G-protein coupled M3 muscarinic receptor was used for this study. In this signaling pathway, calcium signals exhibit two distinct signaling regimes when addressed with its ligand carbachol (18, 19). At low carbachol concentrations, cells generally exhibit oscillatory calcium signals, whereby the calcium levels rise and fall with fairly regular periodicity; as the carbachol concentration increases, the frequency of these oscillations generally increases. At high carbachol concentrations, cells generally exhibit acute responses, whereby the calcium levels rapidly rise to a peak and subsequently diminish to a new steady-state level, slightly above that of pre-stimulus levels. We subsequently refer to these regimes as the oscillatory and acute signaling regimes, respectively.
Our starting point for signaling pathway elucidation was the in silico model of calcium signaling shown previously to be the best available for describing carbachol stimulated calcium oscillations in HEK 293 cells (17). This in silico model, however, had only been validated at lower stimulation concentrations of the oscillatory regime. Thus, when we performed microfluidic interrogation of this signaling pathway in the higher concentration acute regime, we uncovered discrepancies between experimental observations and the in silico model. This discrepancy provided the opportunity to interrogate additional mechanisms. Specifically, we newly incorporated receptor desensitization terms into the previous model, and the desensitization parameters were constrained based on experimental observations of intracellular calcium released in response to pulsed stimulation at high ligand concentrations. This paper describes how the revised in silico model was obtained and how it can account for a wide range of signaling responses in both the acute and oscillatory calcium signaling regimes. Furthermore, we describe how the expanded in silico model suggests that distinct underlying mechanisms regulate the recovery responses of the two regimes.
Results
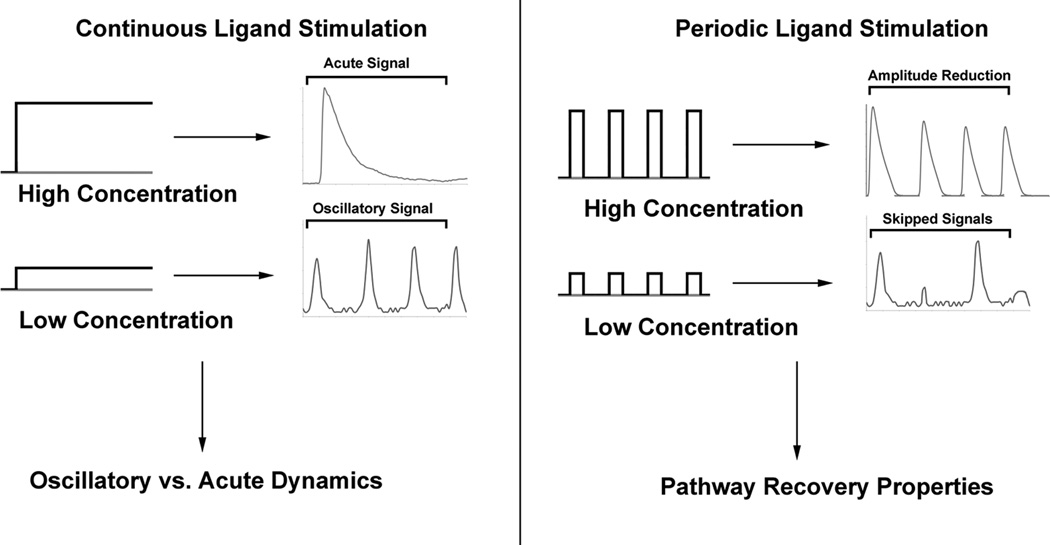
Depending upon the concentration of carbachol, HEK293 cells expressing the M3 muscarinic receptor exhibit either an oscillatory (low carbachol) or acute (high carbachol) intracellular calcium response under continuous exposure (Fig. 1). We thus refer to the carbachol concentration range that elicits oscillatory responses as the ‘oscillatory regime’, and the concentration range that elicits acute responses as the ‘acute regime’. In order to gain mechanistic insight into the properties of these calcium signaling regimes, we turned to mathematical modeling. We evaluated our previously developed in silico oscillatory calcium model (12, 17) to determine whether it could also account for experimentally observed calcium signaling responses in the acute regime (20–22). We hypothesized that we could use responses in the acute regime as distinct types of responses to supplement previous observations in the oscillatory calcium signaling regimes in order to further expand our mathematical model of calcium signaling and constrain molecular mechanisms (Fig. 1).
Fig. 1.
Pulsatile stimulation in both the acute and oscillatory regime provide experimental calcium responses critical for mechanism elucidation, in addition to previously characterized responses under continuous stimulation in the two regimes. Left- subjecting cells to continuous ligand stimulation at different concentrations can reveal the presence of multiple signaling regimes: oscillatory and acute. Right- Exposing cells to periodic ligand stimulation can reveal the recovery properties of pathway signaling regimes not observable with continuous stimulation alone. Recovery properties are represented by a reduction of the amplitude of responses in later stimulation pulses in the acute regime, and skipped signals in the oscillatory regime.
Previously, we characterized the following responses in the oscillatory regime: 1) increases in oscillation frequency with increases in ligand concentration 2) phase-locking ratio (the number of system responses divided by the number of stimulation events) 3) sub-threshold spikes (calcium oscillation spikes that do not reach their full height), as has been observed experimentally (17). Experiments in the acute regime provided three additional types of responses: 1) bounded responses upon exposure to high ligand concentrations 2) response saturation with increasing ligand concentrations 3) increased calcium signal attenuation under periodic stimulation for increasing ligand concentrations. It is the use of these latter three responses in combination with the first three that enables mechanistic insight into both the oscillatory and acute regimes of calcium signaling.
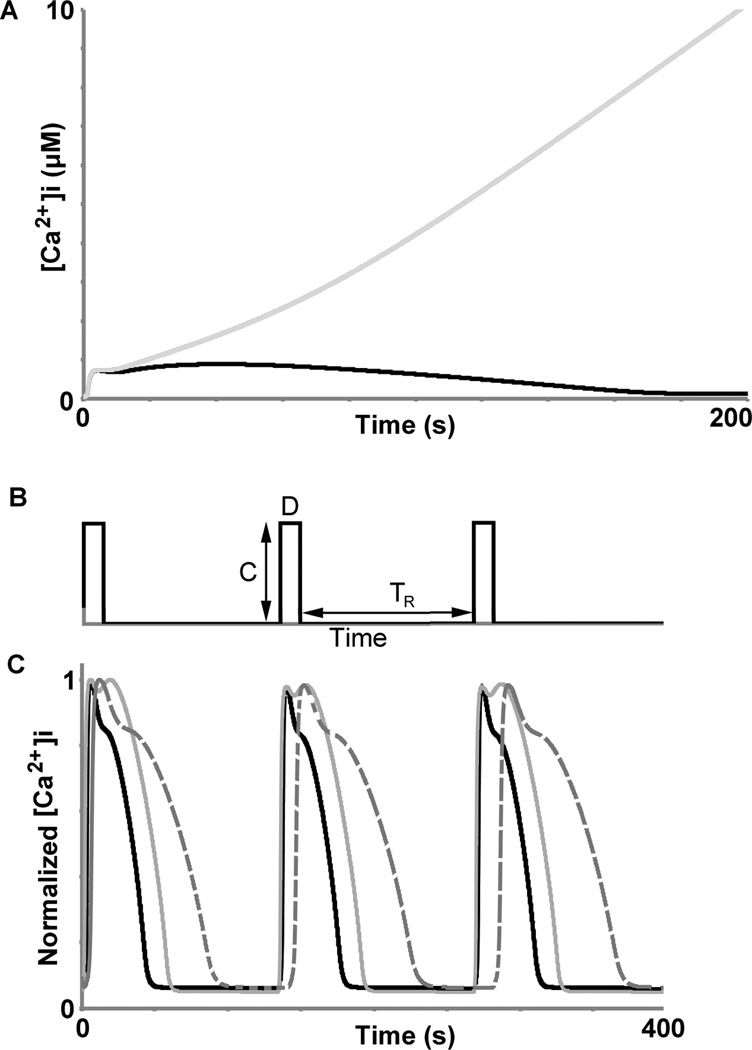
While the previous model (12, 17) was able to generate acute responses under continuous stimulation, it had several key short-comings. One limitation of the model was that it could not reproduce acute signaling upon exposure to very high, continuous ligand stimulation (in the millimolar range) (Fig. 2a); the model exhibited rapidly increasing calcium levels (beyond physiological concentrations), which differed from the typical acute responses observed in experiments with HEK293 cells (Fig. 1). Similarly, the model was unable to reproduce saturated signal amplitudes with increasing ligand concentrations as previously reported for these systems (22). These results suggested that mechanisms for bounding the calcium response upon exposure to high ligand concentrations were not present in the model.
Fig. 2.
A) Receptor phosphorylation keeps the calcium signal bounded. Our calcium model (without receptor phosphorylation) exhibited a continuously increasing calcium response upon continuous stimulation with 10 mM of ligand (light gray); however, upon addition of receptor phosphorylation, the model showed a bounded response (black) under the same stimulation. B) Periodic stimulation conditions are described by three parameters: ligand concentration (C), stimulation duration (D), and rest period between stimulation events (TR). C) The calcium signals in our original model, which does not feature receptor phosphorylation, do not exhibit calcium amplitude attenuation, in contradiction with our experimental data in Table 1. Light gray trace: C = 500 nM, D = 6 s, TR = 128 s; dark gray dotted trace: C = 100 nM, D = 6 s, TR = 64 s; black trace: C = 100 nM, D = 6 s, TR = 128 s. Calcium levels for the three traces were normalized to their maximum values; the blue trace was also normalized by time to enable easy visual comparison of peak values between the three conditions. Figure 4C depicts responses predicted by the model that features receptor phosphorylation and matches experimental observations.
Another model limitation was revealed when the system was subjected to periodic stimulation in the acute regime (Fig. 2b, similar to the analysis used by Maurya et al. (21) based upon data from the Alliance for Cellular Signaling (23)). When exposed to periodic stimulation (Fig. 2b), the model exhibited acute calcium responses that did not diminish in amplitude over time, even when larger ligand concentrations were applied (Fig. 2c), contrary to previous experimentally observed results (21, 23) and our own experimental results (Table 1). These predicted, unbounded signals indicated that the model was lacking a mechanism for attenuating calcium signals during stimulation.
Table 1.
Periodic stimulation parameters used experimentally to analyze calcium amplitude recovery properties on the single cell level: concentration (C), stimulation duration (D), and rest period between stimulation pulses (TR). Three pulses were applied to cells and their peak calcium amplitudes were measured, similar to the in silico results shown in Fig. 2c and Fig. 4c; the last two peaks were compared to the first by taking the ratio, represented by Amplitude Ratio 1 and 2, respectively. The effect of concentration (2nd row) and rest period (3rd row) on calcium amplitude recovery were assessed. Values in parenthesis represent the standard deviation. All conditions were tested in at least duplicate, with between ~15–25 cells represented in each run.
| Periodic Stimulation conditions | Amplitude Ratio 1 | Amplitude Ratio 2 |
|---|---|---|
| C = 100 nM, D = 24 s, TR = 128 s | 1.008 (0.097) | 0.99 (0.0918) |
| C = 500 nM, D = 24 s, TR = 128 s | 0.917 (0.075) | 0.889 (0.082) |
| C = 100 nM, D = 24 s, TR = 64 s | 0.9 (0.149) | 0.88 (0.148) |
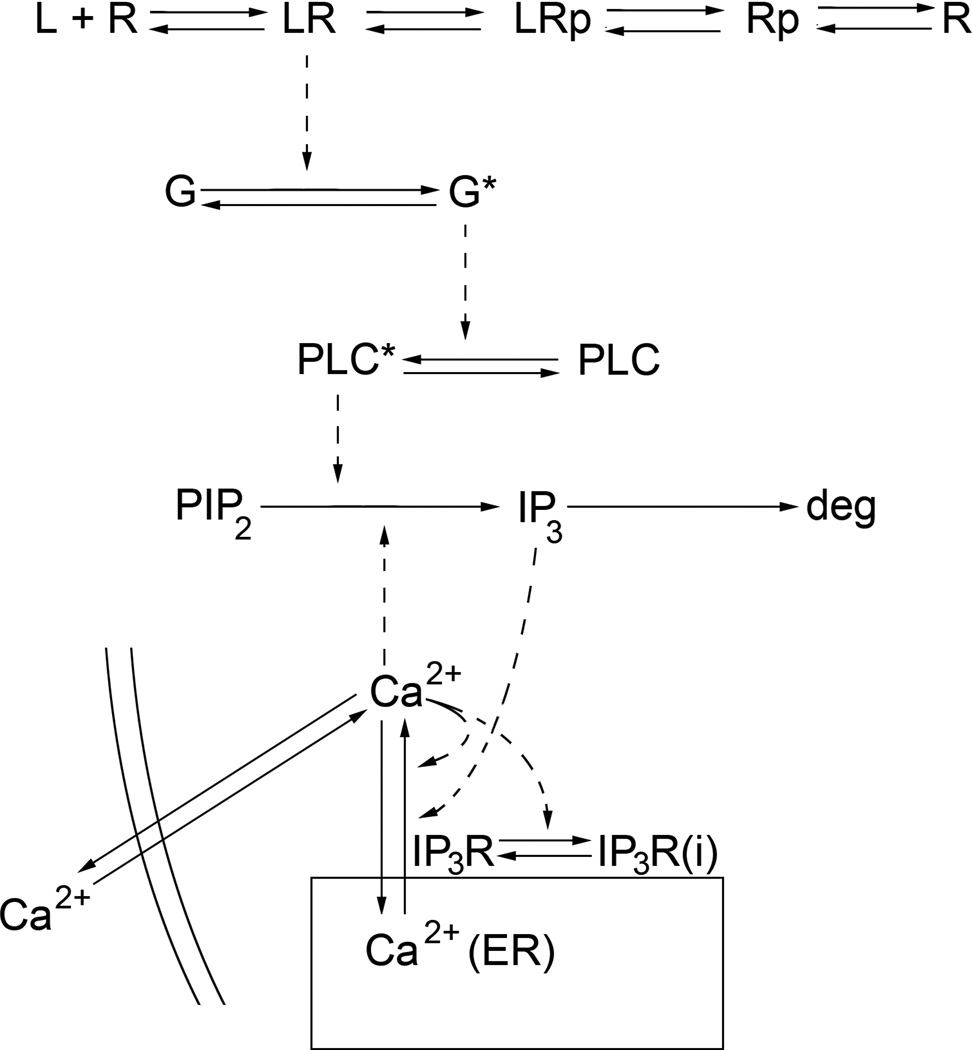
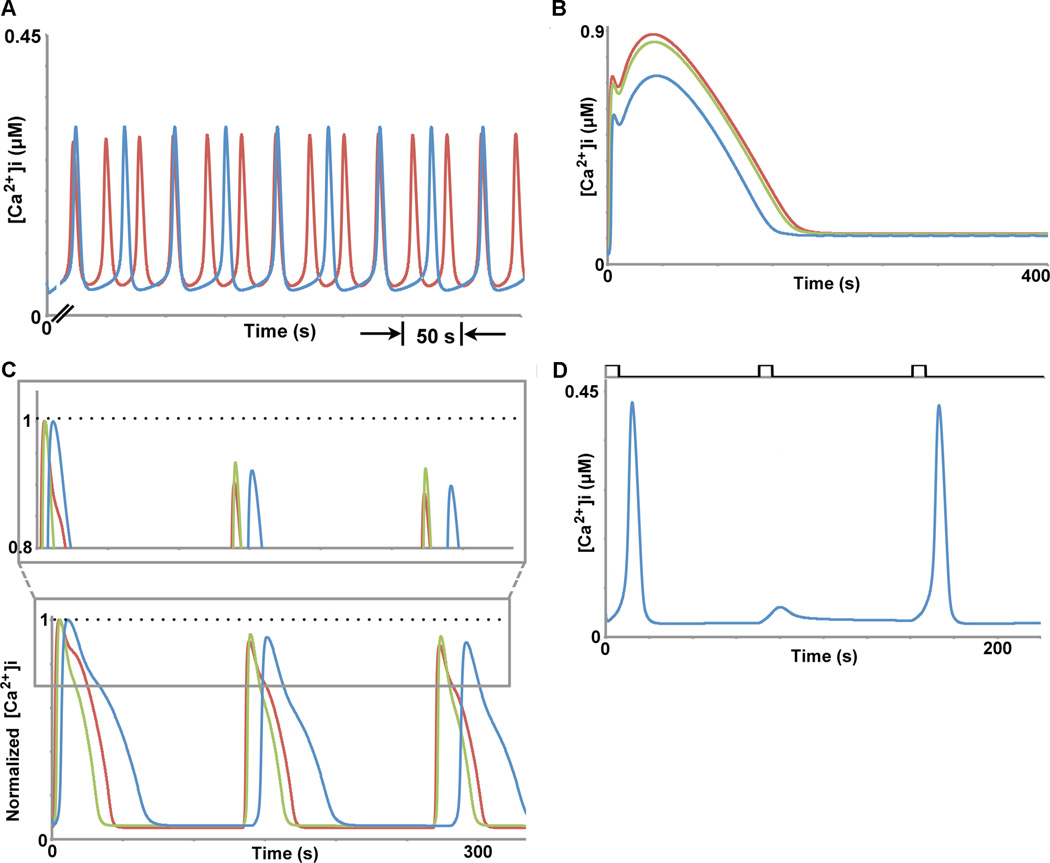
To account for these experimental observations of the G-protein pathway, we added receptor phosphorylation dynamics based on literature data (10, 20, 21), resulting in a plausible in silico model that could describe both acute and oscillatory regime dynamics (Fig. 3). The incorporation of receptor phosphorylation into the in silico model enabled recapitulation of experimental observations even at very high ligand concentrations (Fig. 2a, Fig. 4). Importantly, the new model retained oscillatory regime responses observed in previous experiments (12, 17, 24, 25) (Fig. 4a,d). Thus, receptor phosphorylation provided a mechanism for buffering signaling activity at high ligand concentrations without dramatically affecting signaling properties at low ligand concentrations, as will be discussed in more detail below. We note that receptor phosphorylation, an important mechanism that is well-described in molecular biology literature, is generally not featured in calcium signaling models. Thus, while we acknowledge that other mechanisms may contribute to bounding acute calcium signals, recapitulation of both the acute and oscillatory regime responses in a single in silico model represents a significant enhancement. Of more broad implication, these findings portray that the same signaling pathway readout (e.g. intracellular calcium concentration) can be used to constrain distinct parameter sets within a signaling pathway model by looking at responses at two different signaling regimes (e.g. acute versus oscillatory regime).
Fig. 3.
Schematic of the enhanced mathematical model used to represent the Gq-mediated calcium signaling pathway. Solid arrows represent either translocation or conversion reactions, while dashed lines represent enzymatic reactions. L = ligand (ligand), R = receptor, p = phosphorylated, G* = activated Gqprotein, PLC* = activated phospholipase C, PIP2 = Phosphatidylinositol 4,5-bisphosphate, IP3 = inositol triphosphate, deg = degradation, IP3R = “open” IP3 receptor, IP3R(i) = inactivated IP3R, Ca2+(ER) = endoplasmic reticulum calcium. Release of calcium from the ER is mediated by the IP3Rs; the fraction of “open” IP3Rs dictates the amount of calcium released from the ER.
Fig. 4.
Behaviors of the enhanced mathematical model that includes receptor phosphorylation dynamics. A) With continuous low ligand concentration stimulation, the model exhibits calcium oscillations whose frequency increases with increasing ligand concentrations (blue = 5 nM, red = 10 nM). B) With continuous high ligand concentration stimulation, the model exhibits acute responses, whose amplitude increases and then saturates with increasing ligand concentrations (blue = 100 nM, green = 500 nM, red = 10 µM). C) Our enhanced model can also qualitatively capture the response of calcium under the periodic stimulation conditions presented in Table 1. Red trace: C = 500 nM, D = 6 s, TR = 128 s; blue trace: C = 100 nM, D = 6 s, TR = 64 s; green trace: C = 100 nM, D = 6 s, TR = 128 s. The grey boxed area is shown in more detail above the full simulation to accentuate the differences in amplitude between each of the periodic stimulation conditions mentioned above. Times and amplitudes have been normalized to enable easy visual comparison, as in Fig. 2c. D) The enhanced model produces phase-locked calcium signals and sub-threshold spikes upon periodic stimulation, as observed experimentally (12, 17). Periodic stimulation conditions used here were: C = 10 nM, D = 6 s, TR = 64 s (black pattern above the calcium traces).
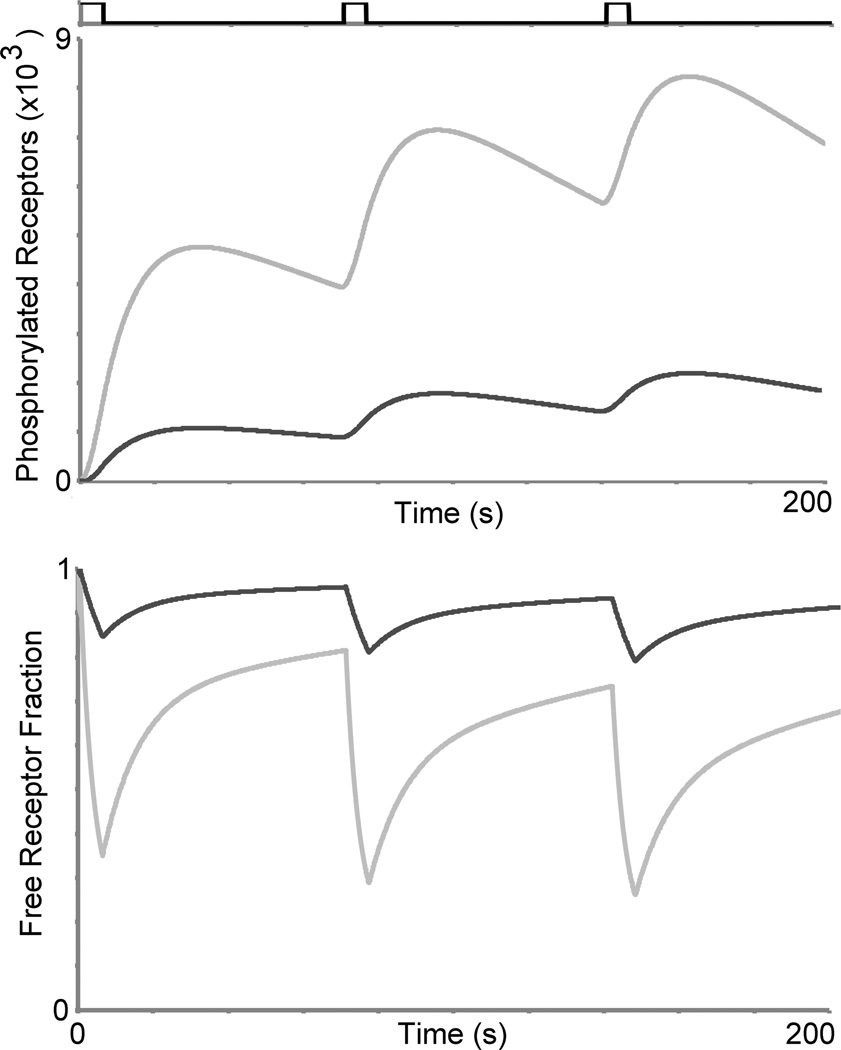
Having determined that the in silico model reproduced key responses in both the oscillatory and acute regimes, we next sought to use the model to provide mechanistic interpretations of calcium signaling in the respective regimes. Analysis of the model indicated that while the acute regime was highly susceptible to receptor phosphorylation (leading to attenuation of calcium signals), the oscillatory regime was not (Fig. 5-top). In the acute regime, the time between periodic stimulation events required to elicit a calcium response of similar amplitude to the first response represents in part the time needed for receptor de-phosphorylation. In our in silico model, we further observed that the fraction of free surface receptors was drastically reduced in the acute regime compared to the oscillatory regime (Fig. 5- bottom) suggesting the distinct role that receptor dynamics play in the respective regimes.
Fig. 5.
Receptor dynamics can explain in part the differences in calcium recovery properties between the acute (light gray trace) and oscillatory regimes (dark gray trace). Top: Upon periodic stimulation, our in silico results indicate that phosphorylated GPCR levels (LRp + Rp) are dramatically higher for the acute regime compared to the oscillatory regime. Bottom: Under the same periodic stimulation conditions, the free surface receptor (R) fractions were drastically lower, and continued to diminish, in the acute regime, compared to the oscillatory regime. Periodic stimulation conditions (represented by the black trace above the graphs): C = 15 nM (oscillatory) 100 nM (acute), D = 6 s, TR = 64 s. These in silico results suggest that the oscillatory regime is not as susceptible to calcium signal desensitization due to receptor phosphorylation compared to the acute regime.
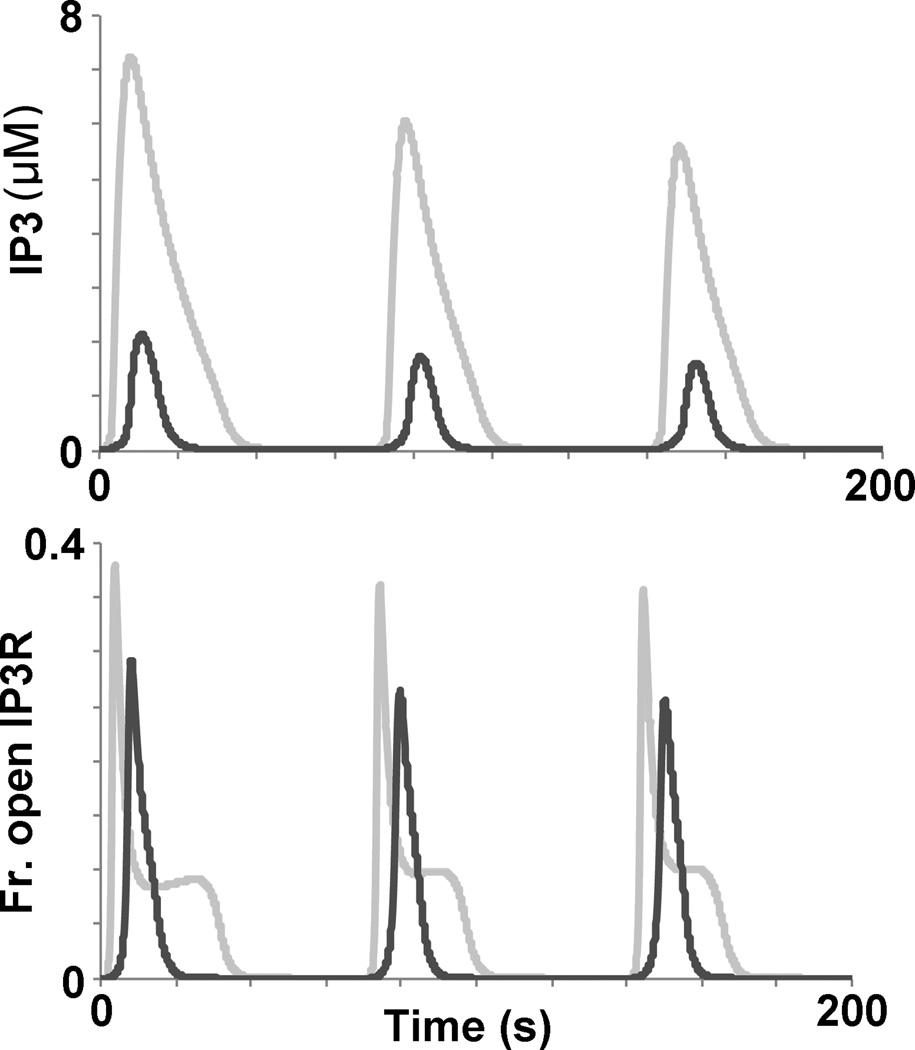
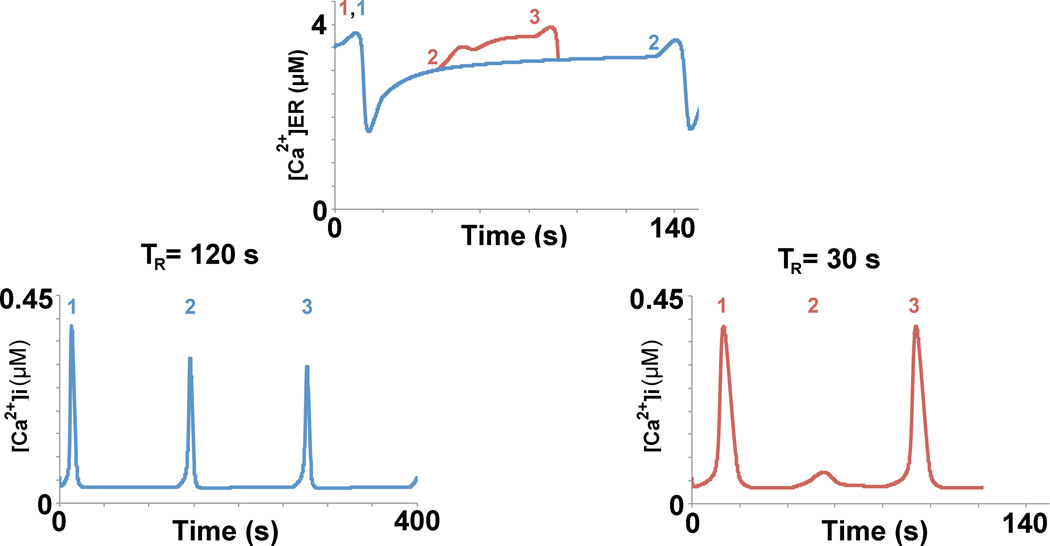
We also used our in silico model to understand the activation and recovery properties of the oscillatory regime. We noted that with periodic stimulation, increases in ligand concentration resulted in greater attenuation of calcium amplitudes in the acute regime (Table 1), whereas increases in ligand concentration increased calcium signal generation in the oscillatory regime (12, 17). According to our in silico model, IP3 dynamics and the fraction of “open” IP3Rs primarily limit calcium activation in the oscillatory regime; here “open” signifies the IP3Rs that are capable of conducting calcium from the ER into the cytoplasm (Fig. 3). The importance of these two components in this context can be appreciated in Fig. 6. In the oscillatory regime, less IP3 is released compared to the acute regime. This diminished IP3 release lowers the fraction of the IP3 receptors remaining in the “open” position, thereby decreasing the amount of calcium released from the ER. For the oscillatory regime, increasing either the stimulation concentration (C) or the stimulation duration (D) results in greater IP3 release, and ultimately a higher fraction of IP3 receptors remaining in the “open” position, resulting in greater calcium release, compared to lower C or D (Fig. 6). Increases in the rest period (TR) also resulted in calcium signal generation because this enables greater time for the ER calcium levels to replenish after a stimulation event (Fig. 7). Failure to properly replenish ER calcium levels contributes to the skipped signals, as observed. Cumulatively, these results provide mechanistic insight for the recovery and activation processes in the oscillatory regime.
Fig. 6.
IP3 levels and the fraction of “open” IP3 receptors provide insight into the activation dynamics of the acute (light gray trace) and oscillatory (dark gray trace) regimes as revealed by periodic stimulation in silico. Top: IP3 levels are dramatically higher for the acute regime compared to the oscillatory regime. Bottom: The fraction of “open” IP3 receptors is greater for the acute regime compared to the oscillatory regime. Periodic stimulation conditions: C = 15 nM (oscillatory) 100 nM (acute), D = 6 s, TR = 64 s.
Fig. 7.
With greater recovery time, ER calcium levels can replenish to a greater extent. The colored numbers above the ER calcium traces represent the time points at which a stimulation event occurred for TR = 30 s (red) and TR = 120 s (blue). When the recovery TR = 30 s, there is not enough ER calcium to provide a full calcium signal, a subthreshold spike results (red ‘2’); after the subthreshold spike, the ER calcium continues to replenish to a sufficient level, at which time the third stimulation event arrives, resulting in a full calcium signal (red ‘3’). When TR is extended to 120 s from 30 s, the ER calcium levels are allowed to fill to a level that is sufficient for eliciting a full calcium signal (blue ‘2’, blue ‘3’ is not depicted in the ER calcium graph).
Discussion
Dissection of cellular signaling pathways is vital for a variety of fields, including drug development (26) and synthetic biology (27). Therefore, enhancement of the number of tools available to enable pathway elucidation is needed. While real-time fluorescent readouts of various molecular species are available (28), only a few readouts can be employed at once due to practical considerations regarding optical setups and fluorescent readout design. Previously, we demonstrated that pulsed ligand stimulation can derive multiple discriminating factors from the same calcium readout in a manner not possible with just continuous stimulation. Here we demonstrate that the utility of a single fluorescent readout can be expanded even further by analyzing multiple signaling regimes. We analyzed the M3 muscarinic receptor mediated calcium signaling pathway in HEK293 cells, which exhibits two signaling regimes: oscillatory and acute (Fig. 1).
Microfluidic interrogation of our cells in the acute regime of calcium signaling revealed discrepancies in our previous in silico model of oscillatory calcium signaling (17) (Fig. 2). These discrepancies led to the observation that our previous in silico model did not have a mechanism for attenuating calcium signals at high ligand concentrations, highlighting the utility of comparing in silico models with guided experiments. We reasoned that receptor phosphorylation was responsible in part for this signal attenuation, as it is known to desensitize the M3 receptor (29). Using rate constants from a previous study of receptor phosphorylation (10), we developed a comprehensive in silico model of calcium signaling (Fig. 3), able to account for dynamic responses in both the acute and oscillatory regimes (Fig. 4). These results highlighted the utility of perturbing systems in different signaling regimes and refining in silico models based upon discrepancies with experiments. The resulting in silico model was then utilized to interpret the various dynamic calcium signaling responses observed both under continuous and periodic stimulation conditions.
Our enhanced in silico model (Fig. 3), elucidated through our two-regime, pulsed stimulation approach, indicated that receptor phosphorylation is a plausible mechanism for the desensitization of calcium signals at higher concentrations, in the acute regime (Fig. 5). As stimulation increases in the acute regime, receptor phosphorylation increases, leading to greater attenuation of calcium signals (Fig. 5). Thus, the acute regime can perhaps be interpreted as a simple GPCR-recovery-limited system: the stimulation concentrations are near saturation levels and the main factor limiting signal generation is the degree of recovery from receptor phosphorylation.
For the oscillatory regime, the stimulation concentrations are sub-saturating and thus receptor phosphorylation is minimal and is not the major limiting factor. Here, calcium signal generation is instead limited by different combination of factors depending on the stimulation pattern. When stimulated at low concentrations (C) or short durations (D) the system becomes activation limited in that the levels of IP3 generated are too low to sufficiently increase the fraction of “open” IP3 receptors (Fig. 6). When stimulation is too frequent, i.e. with too small of a rest period (TR), the system becomes recovery limited although not because of receptor phosphorylation but because there is insufficient time for ER calcium levels to recover (Fig. 7). Since increasing any of C, D, or TR is able to overcome downstream desensitization mechanisms, the oscillatory regime may be considered as being limited by a combination of activation and recovery mechanisms (12, 17, 30).
The results obtained have significance beyond specific insights obtained about the M3 muscarinic receptor signaling pathway. The methods described for using a single fluorescent readout with pulsed microfluidic stimulation at multiple concentration regimes for pathway elucidation should be broadly applicable. While the use of continuous stimulation at different ligand concentrations provides some insight into the saturation and desensitization features, periodic stimulation at different ligand concentrations provides additional insight into the rate-limiting steps, and recovery and activation properties of each regime (Figure 1c). Other dynamic ligand stimulation patterns, such as linear ligand concentration ramp-ups and downs (31–33) and step-ups and downs (14, 34) for example, may provide further means of constraining parameters and offer insight into signaling properties.
Our approach highlights the utility of analyzing signaling dynamics among multiple regimes as compared to a single regime. In this study, we tested experimentally and in silico the effects of ligand concentrations across a fifty fold range to encompass both the acute and oscillatory response regimes. The multi-regime analysis helped to indicate the dominant mechanisms contributing to activation, suppression, and recovery of calcium signals (Fig. 5–7).
Conclusions
As different cell types can have different architectures even for the same signaling pathway, it is beneficial to have efficient ways to constrain mechanistic models to interpret behaviors of pathway response patterns. It is time and resource-intensive, however, to obtain response patterns directly from multiple distinct molecular components within a signaling pathway. To this end, we show how a single pathway response (calcium) can be used to extract mechanistic information about multiple components within a pathway through use of pulsed stimulations and analysis of signaling at two distinct stimulation concentration-dependent signaling regimes.
Methods
Cell Culture, Microfluidics, and Imaging
HEK293 cells were cultured in Dulbecco's Modified Eagle's Medium (DMEM) (Invitrogen) supplemented with 10% Fetal Bovine Serum (FBS) (Gibco), and were maintained at 37°C with 5% CO2 in 6-well plates. 0.25% Trypsin/EDTA (Gibco) was used to detach cells from plates and transfer them to our microfluidic setup (12, 17). These cells stably expressed the human muscarinic acetylcholine M3 receptor and G418 (400µg/ml) was added to the media for selection. Transient transfection with the calcium FRET readout YC3.60 (35) was carried out using Lipofectamine2000 (Invitrogen). Imaging of intracellular calcium signaling and setting up of the microfluidic system was conducted as described in Ref. 9, 13. Using the microfluidic setup, cells were periodically stimulated with the M3 agonist carbachol (Calbiochem).
Mathematical models
We updated our recently-developed calcium model (17) to include receptor phosphorylation dynamics, based upon those described in Ref. 7. We used a Latin Hypercube Sampling (LHS) (36, 37) scheme to determine values of the model parameters related to phosphorylation dynamics that best fit our data, arriving at a set of model parameters that qualitatively produced both oscillatory and acute signaling responses upon continuous and periodic stimulation at ligand concentrations that matched those used experimentally (Fig. S2). Parameters from Ref. 7 were sampled from a normal distribution with standard deviation of 25%. Parameters from the previous model were sampled similarly (17). The final parameter set was chosen when the model qualitatively exhibited all the correct experimentally observed responses in both the oscillatory and acute regimes (as described in the Results section). All models were coded in MATLAB version 7.8.0 (MathWorks Inc, Natick, MA) and the system of ODEs was solved with the stiff solver ode15s. Model equations and parameters are provided in the Supplemental Information.
Supplementary Material
Acknowledgements
We thank the following individuals for their technical assistance and/or helpful comments: Atsushi Miyawaki, Toshiki Matsuoka, Tom Bersano, Khamir Mehta, Djordje Cantrak, and Novica Jankovic. We also thank the following funding sources: Rackham Pre-doctoral Fellowship, the Microfluidics in Biomedical Sciences Training Grant (NIH T32 EB005582), NIH grants GM096040, and EB012579.
Contributor Information
Jennifer J. Linderman, Email: linderma@umich.edu.
Shuichi Takayama, Email: takayama@umich.edu.
References
- 1.Jovic A, Howell B, Takayama S. Timing is everything: using fluidics to understand the role of temporal dynamics in cellular systems. Microfluid. Nanofluid. 2009 Jun;6:717. [Google Scholar]
- 2.Dhumpa R, Roper MG. Temporal gradients in microfluidic systems to probe cellular dynamics: A review. Anal Chim Acta. 2012 Sep 19;743:9. doi: 10.1016/j.aca.2012.07.006. [DOI] [PMC free article] [PubMed] [Google Scholar]
- 3.LeDuc PR, Messner WC, Wikswo JP. How Do Control-Based Approaches Enter into Biology? Annu Rev Biomed Eng. 2011;13:369. doi: 10.1146/annurev-bioeng-071910-124651. [DOI] [PubMed] [Google Scholar]
- 4.Bennett MR, et al. Metabolic gene regulation in a dynamically changing environment. Nature. 2008 Aug;454:1119. doi: 10.1038/nature07211. [DOI] [PMC free article] [PubMed] [Google Scholar]
- 5.Mettetal JT, Muzzey D, Gomez-Uribe C, van Oudenaarden A. The frequency dependence of osmo-adaptation in Saccharomyces cerevisiae. Science. 2008 Jan;319:482. doi: 10.1126/science.1151582. [DOI] [PMC free article] [PubMed] [Google Scholar]
- 6.Ashall L, et al. Pulsatile stimulation determines timing and specificity of NF-kappaB-dependent transcription. Science. 2009 Apr 10;324:242. doi: 10.1126/science.1164860. [DOI] [PMC free article] [PubMed] [Google Scholar]
- 7.Hersen P, McClean MN, Mahadevan L, Ramanathan S. Signal processing by the HOG MAP kinase pathway. Proc. Natl. Acad. Sci. U. S. A. 2008 May;105:7165. doi: 10.1073/pnas.0710770105. [DOI] [PMC free article] [PubMed] [Google Scholar]
- 8.Nakamura N, Yamazawa T, Okubo Y, Iino M. Temporal switching and cell-to-cell variability in Ca2+ release activity in mammalian cells. Mol. Syst. Biol. 2009 Mar;5 doi: 10.1038/msb.2009.6. [DOI] [PMC free article] [PubMed] [Google Scholar]
- 9.Tay S, et al. Single-cell NF-kappa B dynamics reveal digital activation and analogue information processing. Nature. 2010 Jul 8;466:267. doi: 10.1038/nature09145. [DOI] [PMC free article] [PubMed] [Google Scholar]
- 10.Vayttaden SJ, et al. Quantitative Modeling of GRK-Mediated beta 2AR Regulation. PLoS Comput. Biol. 2010 Jan;6 doi: 10.1371/journal.pcbi.1000647. [DOI] [PMC free article] [PubMed] [Google Scholar]
- 11.Russo G, di Bernardo M, Sontag ED. Global Entrainment of Transcriptional Systems to Periodic Inputs. PLoS Comput. Biol. 2010 Apr;6 doi: 10.1371/journal.pcbi.1000739. [DOI] [PMC free article] [PubMed] [Google Scholar]
- 12.Jovic A, et al. Hi-Fi transmission of periodic signals amid cell-to-cell variability. Molecular BioSystems. 2011 Jan 7;7:2238. doi: 10.1039/c1mb05031a. [DOI] [PMC free article] [PubMed] [Google Scholar]
- 13.Mondragon-Palomino O, Danino T, Selimkhanov J, Tsimring L, Hasty J. Entrainment of a Population of Synthetic Genetic Oscillators. Science. 2011 Sep;333:1315. doi: 10.1126/science.1205369. [DOI] [PMC free article] [PubMed] [Google Scholar]
- 14.Kuczenski B, Ruder WC, Messner WC, LeDuc PR. Probing Cellular Dynamics with a Chemical Signal Generator. PLoS One. 2009 Mar;4:8. doi: 10.1371/journal.pone.0004847. [DOI] [PMC free article] [PubMed] [Google Scholar]
- 15.Dolmetsch RE, Xu KL, Lewis RS. Calcium oscillations increase the efficiency and specificity of gene expression. Nature. 1998 Apr 30;392:933. doi: 10.1038/31960. [DOI] [PubMed] [Google Scholar]
- 16.White MRH, Spiller DG. Is frequency-encoding of information a major theme in cellular processes? Cell Cycle. 2009 Sep 1;8:2677. [PubMed] [Google Scholar]
- 17.Jovic A, et al. Phase-locked signals elucidate circuit architecture of an oscillatory pathway. PLoS Comput Biol. 2010;6:e1001040. doi: 10.1371/journal.pcbi.1001040. [DOI] [PMC free article] [PubMed] [Google Scholar]
- 18.Davis RJ, Challiss RAJ, Nahorski SR. Enhanced purinoceptor-mediated Ca2+ signalling in L-fibroblasts overexpressing type 1 inositol 1,4,5-trisphosphate receptors. Biochem. J. 1999 Aug 1;341:813. [PMC free article] [PubMed] [Google Scholar]
- 19.Xu X, et al. Promiscuous coupling of receptors to Gq class alpha subunits and effector proteins in pancreatic and submandibular gland cells. J. Biol. Chem. 1998 Oct 16;273:27275. doi: 10.1074/jbc.273.42.27275. [DOI] [PubMed] [Google Scholar]
- 20.Maurya MR, Subramaniam S. Kinetic model for calcium dynamics in RAW 264.7 cells: 1. Mechanisms, parameters, and subpopulational variability. Biophys. J. 2007 Aug;93:709. doi: 10.1529/biophysj.106.097469. [DOI] [PMC free article] [PubMed] [Google Scholar]
- 21.Maurya MR, Subramaniam S. Kinetic model for calcium dynamics in RAW 264.7 cells: 2. Knockdown response and long-term response. Biophys. J. 2007 Aug;93:729. doi: 10.1529/biophysj.106.097501. [DOI] [PMC free article] [PubMed] [Google Scholar]
- 22.Bao XR, Fraser IDC, Wall EA, Quake SR, Simon MI. Variability in G-Protein-Coupled Signaling Studied with Microfluidic Devices. Biophys. J. 2010 Oct 20;99:2414. doi: 10.1016/j.bpj.2010.08.043. [DOI] [PMC free article] [PubMed] [Google Scholar]
- 23.T. A. f. C. S. (AfCS) 2006 http://www.signaling-gateway.org/. [Google Scholar]
- 24.Prank K, et al. Precision of intracellular calcium spike timing in primary rat hepatocytes. Systems Biology. 2005 Mar;2:31. doi: 10.1049/sb:20050002. [DOI] [PubMed] [Google Scholar]
- 25.Schofl C, et al. Temporal Patterns of Alpha(1)-Receptor Stimulation Regulate Amplitude and Frequency of Calcium Transients. Am J Physiol. 1993 Oct;265:C1030. doi: 10.1152/ajpcell.1993.265.4.C1030. [DOI] [PubMed] [Google Scholar]
- 26.Persidis A. Signal transduction as a drug-discovery platform. Nat. Biotechnol. 1998 Nov;16:1082. doi: 10.1038/3553. [DOI] [PubMed] [Google Scholar]
- 27.Benner SA, Sismour AM. Synthetic biology. Nat. Rev. Genet. 2005 Jul;6:533. doi: 10.1038/nrg1637. [DOI] [PMC free article] [PubMed] [Google Scholar]
- 28.Zhang J, Campbell RE, Ting AY, Tsien RY. Creating new fluorescent probes for cell biology. Nature reviews. Molecular cell biology. 2002 Dec;3:906. doi: 10.1038/nrm976. [DOI] [PubMed] [Google Scholar]
- 29.Willets JM, Challiss RA, Nahorski SR. Endogenous G protein-coupled receptor kinase 6 Regulates M3 muscarinic acetylcholine receptor phosphorylation and desensitization in human SH-SY5Y neuroblastoma cells. The Journal of biological chemistry. 2002 May 3;277:15523. doi: 10.1074/jbc.M111217200. [DOI] [PubMed] [Google Scholar]
- 30.Chay TR, Lee YS, Fan YS. Appearance of phase-locked Wenckebach-like rhythms, devil's staircase and unviersality in intracellular calcium spikes in nonexcitable cell models. J. Theor. Biol. 1995 May;174:21. doi: 10.1006/jtbi.1995.0077. [DOI] [PubMed] [Google Scholar]
- 31.Muzzey D, Gomez-Uribe CA, Mettetal JT, van Oudenaarden A. A Systems-Level Analysis of Perfect Adaptation in Yeast Osmoregulation. Cell. 2009 Jul 10;138:160. doi: 10.1016/j.cell.2009.04.047. [DOI] [PMC free article] [PubMed] [Google Scholar]
- 32.Olofsson J, et al. A chemical waveform synthesizer. Proc. Natl. Acad. Sci. U. S. A. 2005 Jun 7;102:8097. doi: 10.1073/pnas.0500230102. [DOI] [PMC free article] [PubMed] [Google Scholar]
- 33.Chen L, Azizi F, Mastrangelo CH. Generation of dynamic chemical signals with microfluidic C-DACs. Lab on a Chip. 2007;7:850. doi: 10.1039/b706304k. [DOI] [PubMed] [Google Scholar]
- 34.King KR, Wang S, Jayaraman A, Yarmush ML, Toner M. Microfluidic flow-encoded switching for parallel control of dynamic cellular microenvironments. Lab on a Chip. 2008;8:107. doi: 10.1039/b716962k. [DOI] [PubMed] [Google Scholar]
- 35.Nagai T, Yamada S, Tominaga T, Ichikawa M, Miyawaki A. Expanded dynamic range of fluorescent indicators for Ca2+ by circularly permuted yellow fluorescent proteins. Proc. Natl. Acad. Sci. U. S. A. 2004 Jul;101:10554. doi: 10.1073/pnas.0400417101. [DOI] [PMC free article] [PubMed] [Google Scholar]
- 36.Marino S, Hogue IB, Ray CJ, Kirschner DE. A methodology for performing global uncertainty and sensitivity analysis in systems biology. J. Theor. Biol. 2008 Sep;254:178. doi: 10.1016/j.jtbi.2008.04.011. [DOI] [PMC free article] [PubMed] [Google Scholar]
- 37.Kinzer-Ursem TL, Linderman JJ. Both ligand- and cell-specific parameters control ligand agonism in a kinetic model of G protein-coupled receptor signaling. PLoS Comput. Biol. 2007 Jan;3:84. doi: 10.1371/journal.pcbi.0030006. [DOI] [PMC free article] [PubMed] [Google Scholar]
Associated Data
This section collects any data citations, data availability statements, or supplementary materials included in this article.


