Abstract
Quantitative imaging biomarkers are of particular interest in drug development for their potential to accelerate the drug development pipeline. The lack of consensus methods and carefully characterized performance hampers the widespread availability of these quantitative measures. A framework to support collaborative work on quantitative imaging biomarkers would entail advanced statistical techniques, the development of controlled vocabularies, and a service-oriented architecture for processing large image archives. Until now, this framework has not been developed. With the availability of tools for automatic ontology-based annotation of datasets, coupled with image archives, and a means for batch selection and processing of image and clinical data, imaging will go through a similar increase in capability analogous to what advanced genetic profiling techniques have brought to molecular biology. We report on our current progress on developing an informatics infrastructure to store, query, and retrieve imaging biomarker data across a wide range of resources in a semantically meaningful way that facilitates the collaborative development and validation of potential imaging biomarkers by many stakeholders. Specifically, we describe the semantic components of our system, QI-Bench, that are used to specify and support experimental activities for statistical validation in quantitative imaging
Keywords: 3D imaging (imaging three-dimensional), Acceptance testing, Algorithms, Evaluation research, Image libraries, Imaging informatics, Biomedical image analysis, Biostatistics, Evaluation studies, Expert system, Clinical application, Clinical information systems, Clinical use determination, Image analysis, Data mining
Introduction
Ex vivo biomarkers (e.g., genomic, proteomic, etc.) as well as in vivo biomarkers (e.g., imaging) are of particular interest in drug development for their potential to accelerate the drug development pipeline [1, 2]. Various collaborative efforts have been established to coordinate efforts in biomarker discovery and development [3–5]. On the material side, numerous biobanks (e.g., Karolinska Institute Biobank [6], British Columbia BioLibrary [7]) store patient tissue and fluid samples that can later be allotted for ex vivo biomarker research. In addition to biological samples, probes and tracers can also be banked. The Radiotracer Clearinghouse has been developed to broker the sharing of positron emission tomography (PET) and single positron emission computed tomography radiotracers between stakeholders for in vivo biomarker research. On the information side, various databases store information on ex vivo biomarkers (e.g., Early Detection Research Network Biomarker Database [8], Infectious Disease Biomarker Database) [9]. However, information resources for in vivo biomarkers, specifically quantitative imaging biomarkers, are notably lacking [10–20].
A complex array of stakeholders is interested in developing and validating quantitative imaging biomarkers. This includes academic researchers who discover new markers and develop existing ones; biopharmaceutical companies and/or contract research organizations that use them in clinical trials; medical device and software manufacturers that make the methods widely available; consortia and foundations interested in promoting patient interests served by quantitative imaging; and government agencies that regulate and set standards. While there is mutual interest in advancing the science of quantitative imaging biomarkers, there are challenges that hinder their development and validation. These challenges include the large number of resources needed to be integrated, heterogeneity in syntactic and semantic representations of the necessary data, and lack of a medium to harness collaboration between multiple stakeholders working on an imaging biomarker. We are developing an informatics infrastructure to store, query, and retrieve imaging biomarker data across a wide range of different resources in a semantically meaningful way so that many stakeholders may collaborate and benefit. Specifically, we have developed a unique approach to provide these stakeholders with computational and data management resources through our QI-Bench Initiative [21], which provides support for free and open source software to richly specify the clinical context for the quantitative imaging techniques and their use as biomarkers. Testable hypotheses about the efficacy of quantitative imaging biomarkers lead to queries to collect relevant data on which statistical tests may be performed for performance characterization and optimization.
Problem Statement
Quantitative imaging techniques are developed for use in the clinical care of patients and in the conduct of clinical trials. In clinical practice, quantitative imaging may be used to detect and characterize disease before, during, and after a course of therapy, and used to predict the course of disease [22]. In clinical research, quantitative imaging biomarkers are used to define endpoints of clinical trials [23–26]. A precondition for adopting the biomarker in either setting is a demonstration of the ability to standardize the biomarker across imaging devices and clinical centers, and the assessment of the biomarker’s safety and efficacy.
Quantitative imaging techniques also have potential applications in translational research. There is a large and growing body of knowledge at the molecular/cellular and organism level enabling quantitative imaging techniques in computer-aided detection, diagnosis, and targeted therapies [22, 27–30]. Technology linking these levels through the analysis of quantitative imaging and non-imaging data [31], coupled with multi-scale modeling elucidates both pre-symptomatic and clinical disease processes [32–35]. For example, changes in epidermal growth factor receptor can be visualized and quantified through bioluminescence imaging using reconstituted luciferase [8]. PET enables detection and quantification of molecular processes such as glucose metabolism, angiogenesis, apoptosis, and necrosis. The uptake of radiolabelled annexin V by apoptotic and necrotic cells measures apoptosis, necrosis, and other disease processes using PET [36, 37]. Chelated gadolinium attached to small peptides recognizes cell receptors and quantify receptor activities using magnetic resonance imaging techniques. Similarly, microbubbles and nanobubbles attached to antibodies such as anti-P-selectin may be used to image targeted molecules associated with inflammation, angiogenesis, intravascular thrombus, and tumors [30]. Although there is great value in application of quantitative imaging techniques in translational research, few technologies facilitate bridging the two bodies of knowledge: at the molecular/cellular level and at the organism level.
Currently, the application of quantitative imaging techniques presents several challenges:
The lack of a standardized representation of quantitative image features and content [14, 24, 38, 39]. The concept of “image biobanking” as an analog to tissue biobanking has great promise [10, 11]. Tools have become available for handling the complexity of genotype [40–44], and similar advancements are needed to handle the complexity of phenotype, especially as derived from imaging [12–20]. Publicly accessible resources that support large image archives provide little more than file sharing. They have not yet merged into a framework supporting collaboration on quantitative imaging techniques. With tools for automatic ontology-based annotation of datasets coupled with image archives capable of batch selection and processing, quantitative imaging biomarkers will experience increases in capability and adoption analogous to what genetic biomarkers have in molecular biology.
The lack of broad collaboration. The application of quantitative imaging techniques, analysis of the results, and advancement of the field needs collaboration across many relevant stakeholder communities with potentially diverse training and knowledge. Presently, the field is held back by the lack of effective collaboration amongst stakeholders, which necessitates both new technologies and aligned incentives [3, 39, 45–50].
The lack of common language among collaborating stakeholders. The diverse backgrounds of stakeholders using different nomenclatures necessitate the development of standardized ontologies and semantically aware applications.
The large number of resources and data integration. Quantitative imaging techniques are employed on data collected across a large number of image archives. The data integration could be performed across various data types such as imaging, clinical phenotype, molecular data using federated queries, and inferencing to formulate testable hypotheses and associated datasets for validation of novel methods.
The lack of standard terminology and methods for statistical validation techniques. In the past decade, researchers have grappled with emerging high-throughput technologies and the data analysis problems they present. Statistical validation provides a means of understanding the results of high-throughput datasets. Conceptually, statistical validation involves associating the results of data analysis to concepts in an ontology of interest. There is a need to incorporate logical inference with statistical inference in a formalized framework that exploits the complementary features of each.
Statistical hypothesis testing is usually stated along with a characterization of variability under defined scenarios. Determining the clinical relevance of a quantitative imaging readout is a difficult problem. It is important to establish to what extent a biomarker reading is an intermediate endpoint capable of being measured prior to a definitive endpoint that is causally rather than coincidentally related. A logical and mathematical framework is needed to establish how extant study data may be used to establish performance in contexts that have not been explicitly tested.
However, existing capabilities only rarely relate the logical world of ontology development with the biostatistical analyses that characterize performance. In general, existing tools do not permit the extrapolation of statistical validation results along arbitrary ontology hierarchies. Despite decades of using statistical validation approaches, there is no methodology to formally represent the generalizability of a validation activity.
We have addressed these challenges by developing a semantic framework to integrate datasets for statistical validation, and allowing collaboration of multiple stakeholders. Here, we describe the framework of our prototype with emphasis on the semantic components that will support statistical validation.
Method
Our framework will enable domain experts to provide semantically rich specifications (without struggling with unfamiliar knowledge engineering techniques) and to formulate queries based on them to discover and collect reference datasets supporting testable hypotheses (see Fig. 1).
Fig. 1.
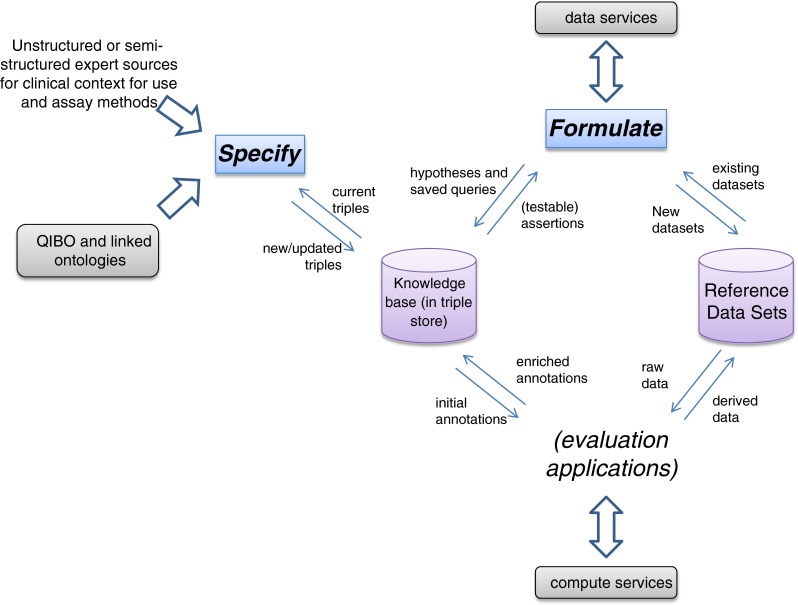
Information flow schematic of specification and characterization activities of QI-Bench
Our approach involves multiple components: (1) an ontology covering the key concepts necessary to specify quantitative imaging techniques and biomarkers, and (2) applications that use it to meet specific use cases. The first application is Specify, which guides the researcher to produce a set of statements specifying a potential biomarker. The second is Formulate, which helps in collecting the datasets supporting his/her hypothesis. Image and statistical analyses comprise additional downstream applications to complete the full scope via Execute (perform batch image analyses), Analyze (statistical analysis of image analyses), and Package (compile evidence for regulatory filing). QI-Bench is deployable either as a web-accessible resource for collaboration or as a local instance used within individual organizations for their own purposes. This paper focuses specifically on the Specify and Formulate portions of the overall system.
The Ontology
Biomedical studies generate rich and diverse types of imaging data, spanning from high-resolution microscopy images to fluorescence imaging to nanoparticle-based imaging. The rich information in imaging extends far beyond the numerical values of the pixels—it involves describing imaging biomarkers that are indicators of the underlying biology of interest. Fully specifying an imaging biomarker involves a series of heterogeneous concepts that span the fields of imaging physics, probe chemistry, molecular biology, quantitation techniques, and more. To provide a means for these descriptions, we have built an ontology—the Quantitative Imaging Biomarker Ontology (QIBO)—as a hierarchical framework of terms that represents concepts in a specific domain as well as key relationships between concepts [51, 52]. This ontological structure is an ideal framework for the integration of heterogeneous and complex knowledge about imaging. By formally defining concepts and synonyms of concepts in the imaging domain, QIBO helps eliminate variation and ambiguity in terminology, and thus can be used to link data and knowledge from different sources (note that RadLex is related but focuses on radiologist interpretations instead [53]). QIBO was built using Web Ontology Language (OWL) in Protégé-OWL, a commonly used ontology authoring tool [54–56]. OWL provides a description logic reasoning capability with highly expressive power. Not only can classes be asserted explicitly in the ontology, but also necessary and sufficient conditions can be defined to specify new classes, where an automated classifier can run to generate an inferred hierarchy. OWL allows for powerful knowledge reasoning, and thus is suitable to convey complexity and richness in imaging biomarker research. QIBO integrates knowledge in different fields represented by several upper classes, including IMAGING SUBJECT, BIOLOGICAL INTERVENTION, IMAGING AGENT, BIOLOGICAL TARGET, IMAGING TECHNIQUE, IMAGING DEVICE, POST-PROCESSING ALGORITHM, INDICATED BIOLOGY, QUANTITATIVE IMAGING BIOMARKER, and BIOMARKER USE.
The Applications
Specify is web-based and helps a researcher to traverse concepts in the ontology according to their relationships (see Fig. 2), to create statements represented as Resource Description Framework (RDF) triples, and to store them in an RDF store. Specify uses NCBO’s BioPortal [57] as its repository of ontologies, including the QIBO and approximately 200 others. BioPortal encapsulates disparate ontologies and related annotated data in one common interface available via Representational State Transfer (REST) Web services [58]. We are building Specify on the top of these services that work with any ontology in BioPortal, including QIBO and those linked through it. As the NCBO’s ontologies are separately curated and updated by the users of BioPortal, Specify’s approach decouples knowledge engineering experts who curate the ontologies from domain experts who utilize the applications in a more user-friendly fashion to support the use of terms and expressions that draw from community efforts to distil medical and technical knowledge.
Fig. 2.
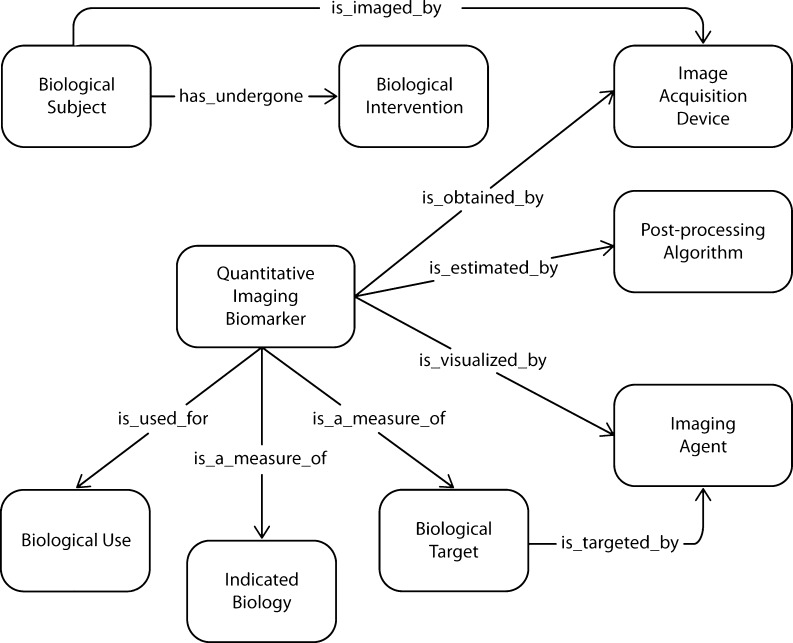
Example concepts (as boxes) and relationships (as arrows) from ontologies used by Specify. The direction of arrows is from a service input to an output object; these relations align with RDF triples generated using Specify
Specify uses QIBO and other ontologies, and translates the above statement to a set of RDF triples to be stored in an RDF triple store. Specify is defined as an implementation of the behavioral model captured in Unified Modeling Language (UML) activity diagram (see Fig. 3).
Fig. 3.
UML Activity Diagram for Specify
In more detail, the typical flow of steps described in the “specify clinical context” and “specify assay method” activities is implemented in the following ontology traversal algorithm:
Allow selection of a term from an ontology (e.g., QIBO). Perform a query to determine its relations (i.e., the relations having this term in their Domain).
- For each such Relation:
- Perform a query to determine what terms are in the Range of the given Relation.
- Prompt the user to select from among the terms (by providing them an automatically generated pick list).
- If the selected term has children in the “is-a” hierarchy, we allow the user to either stop at the term or traverse down the “is-a” hierarchy at their discretion.
- If the term is identified as being searchable in another ontology (i.e., instead of being fleshed out in QIBO), provide the pick list from that ontology (including the ability to select from among the children as desired).
-
i.Store a “triple” with the term of Step 1, the Relation at Step 2, and the selected term of this step (regardless of how deep in the is-a hierarchy they went to select it).
-
i.
- Otherwise, for the selected term in the QIBO we recourse starting again at Step 1 above (which has the effect of navigating the ontology using its relations to enumerate a sequence of terms for disparate concepts via the relations defined for them. Terms and sub-terms are picked from as deep into the hierarchy as desired by the user).
Specify is supported by a front-end that helps the traversal of ontologies that are fetched in real-time from BioPortal and a back-end that stores triples into a knowledge base as terms and their relations are traversed.
This functionality is described via a worked example. Published literature is perhaps the richest source of information associated with quantitative imaging biomarkers, but there is a variety of other documents that contain relevant information. For example, one type of document that is particularly rich in the type of assertions that we are interested in is the Radiology Society of North America’s (RSNA) Quantitative Imaging Biomarker Alliance (QIBA) “Profile” document [59]. These documents address assay methods directly, and serve as a base for linking to clinical context. From this base, assertions may be made in other activities such as biomarker qualification with regulatory agencies.
Using this by way of example, various assertions may be mined from textual statements such as “Measurements of tumor volume”, “Longitudinal changes in tumor volume” and “Tumor response or progression as determined by tumor volume” may be expressed using Specify as triples (see Table 1).
Table 1.
Initial triples using CT volumetry as a response marker in cancer example
| Subject | Predicate | Object |
|---|---|---|
| CT | images | Tumor |
| Volumetry | analyzes | CT |
| LongitudinalVolumetry | estimates | TumorSizeChange |
| TumorSizeChange | predicts | TreatmentResponse |
For each ontology term in the input dataset, we traverse the ontology structure and retrieve the complete listing of paths from the concept to the root(s) of the ontology. We walk through each of these paths, essentially recapitulating the ontology graph. Each term along the path is associated as an annotation to that element identifier in the input dataset to which the starting term was associated with. We refer to this procedure of tracing terms back to the graph’s root as performing the transitive closure over the ontology. In essence, for each child–parent (“is-a”) relationship, we generate the complete set of implied (indirect) annotations based on child–ancestor relationships, by traversing and aggregating along the ontology hierarchy.
This process may be continued, as long as additional information is available, or extended as new information emerges. Continuing our example, such statements as “well-controlled Phase II and III efficacy studies of cytotoxic and selected targeted therapies (e.g., tyrosine kinase inhibitors)” and “cancers of, e.g., lung,” “non-small cell lung cancer,” and “changes in tumor volume can serve as the primary endpoint for regulatory drug approval,” adds to the growing representation (see Table 2).
Table 2.
Knowledge base grows with additional information to form the specification
| Subject | Predicate | Object |
|---|---|---|
| CT | images | Tumor |
| Volumetry | analyzes | CT |
| <compliant > LongitudinalVolumetry | estimates | TumorSizeChange |
| TumorSizeChange | predicts | CytotoxicTreatmentResponse |
| TyrosineKinaseInhibitor | is | CytotoxicTreatment |
| WellControlledPhaseIIandIII EfficacyStudy | uses | CytotoxicTreatmentResponse |
| CytotoxicTreatment | influences | NonSmallCellLungCancer |
| CT | images | Thorax |
| Thorax | contains | NonSmallCellLungCancer |
| RegulatoryDrugApproval | dependsOn | PrimaryEndpoint |
| WellControlledPhaseIIandIII EfficacyStudy | assess | PrimaryEndpoint |
| CT-Volumetry | is | <putative > SurrogateEndpoint |
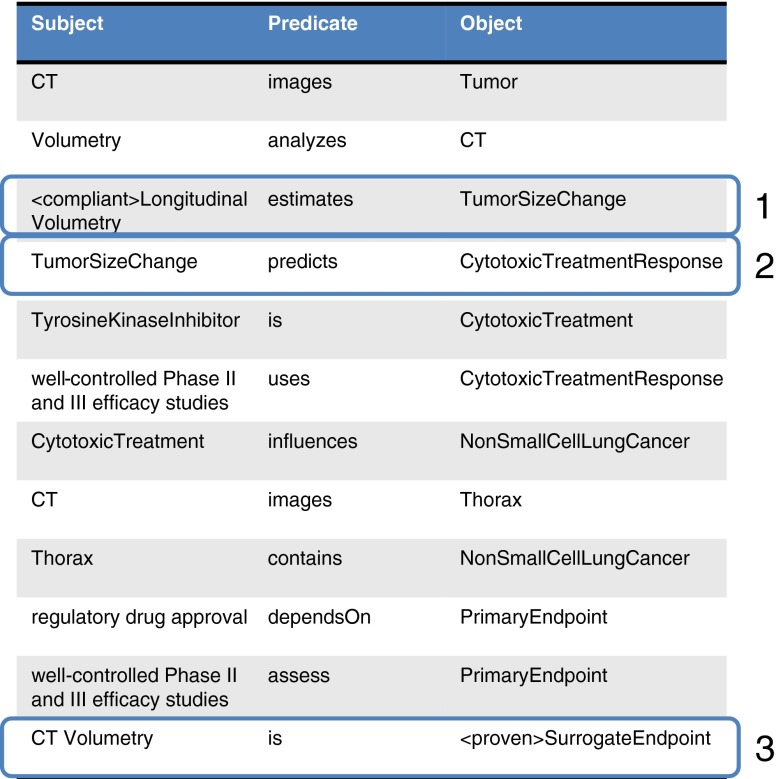
As this process is continued through the curation of additional information from published and other sources, a complete specification for the biomarker emerges. This specification is interpreted as a set of hypotheses that may be tested. Specifically, there are three in our example (see Fig. 4).
Fig. 4.
Triples in the specification imply hypotheses that may have been or ultimately will need to be tested. Hypotheses at level 1 is purely technical; can longitudinal volumetry in fact measure TumorSizeChange, and with what bias and precision? Hypotheses at level two layers a clinical validity assertion on top of that, namely, that CytotoxicTreatmentResponse may be measured on this capability. A hypothesis at level 3 layers a clinical utility on top, namely, that CT volumetry in fact is a surrogate endpoint in the stated clinical context for use
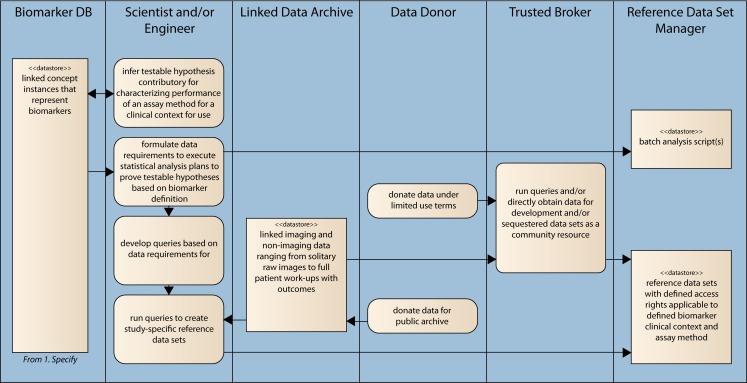
Formulate uses the triples from Specify to generate queries to collect data sets that can be used to test the hypothesis. Formulate traverses the graph defined by the triples to a root-target entity (e.g. CTImage)—and leverages the nodes traversed to construct criteria for the query. These queries are sent to services providing the target entities. Formulate is defined as an implementation of the following behavioral model (see Fig. 5):
Fig. 5.
UML Activity Diagram for Formulate
Data retrieved by Formulate or otherwise directly obtained is organized according to a set of conventions that draws from the popular ISA-Tab model. In order to facilitate the organization of highly complex imaging research data in a form that balances flexibility with the need for standard representation, and in such a way as to enable mixed-discipline research with the sister field of various -omics technologies, an ISA-Tab “like” convention is adopted. Investigation, Study, and Assay are the three key entities around which the ISA-Tab framework is built [60, 61]; these assist in structuring metadata and describing the relationship of samples to data.
Investigation contains all the information needed to understand the overall goals and means used in an experiment; Study is the central unit, containing information on the topic under study, its characteristics, and any treatments applied. Each Study has associated Assay(s), producing qualitative or quantitative data, defined by the type of measurement (i.e., imaging, gene expression, laboratory measurements) and the technology employed (i.e., MRI, high-throughput sequencing, serum creatinine measurements). The hierarchical structure of ISA-Tab enables the representation of studies employing one or a combination of technologies, overcoming the fragmentation of the existing submission formats built for specific types of assay. ISA-Tab complements existing biomedical formats such as the Study Data Tabulation Model [62], endorsed by the Food and Drug Administration (FDA).
The performance of the biomarker is assessed against standard practice as a benchmark, as well as how the marker performs relative to established practice [63]. Data used generally includes results from published literature, retrospectively reanalyzed data from previous clinical trials, and analyzed data from existing ongoing trials.
The triple store is extended to represent these relationships according to Tables 3 and 4.
Table 3.
Discovered data is represented as an extension to the triples that form the specification, linking terms to specific instances
| Subject | Predicate | Object |
|---|---|---|
| A | is | Patient |
| A | isDiagnosedWith | DiseaseA |
| DiseaseA | is | NonSmallLCellLungCancer |
| Pazopanib | is | TyrosoineKinaseInhibitor |
| A | hasBaseline | CT |
| A | hasTP1 | CT |
| A | hasTP2 | CT |
| B | isDiagnosedWith | DiseaseA |
| B | hasBaseline | CT |
| B | hasTP1 | CT |
| A | hasOutcome | Death |
| B | hasOutcome | Survival |
Table 4.
The knowledge base is used to represent linkages between the testable hypotheses and the investigation, study, and assay data that is used to support them
| Subject | Predicate | Object |
|---|---|---|
| ClinicalUtility | is | Investigation URI |
| ClinicalValidity | is | Investigation URI |
| TechnicalPerformance | is | Investigation URI |
| Investigation | has | SummaryStatisticType |
| Investigation | has | Study URI |
| Study | has | DescriptiveStatisticType |
| Study | has | Protocol URI |
| Study | has | Assay URI |
| Assay | has | RawData URI |
These data are extended as necessary to account for annotations and other derived quantities as the process continues (see Fig. 6).
Fig. 6.
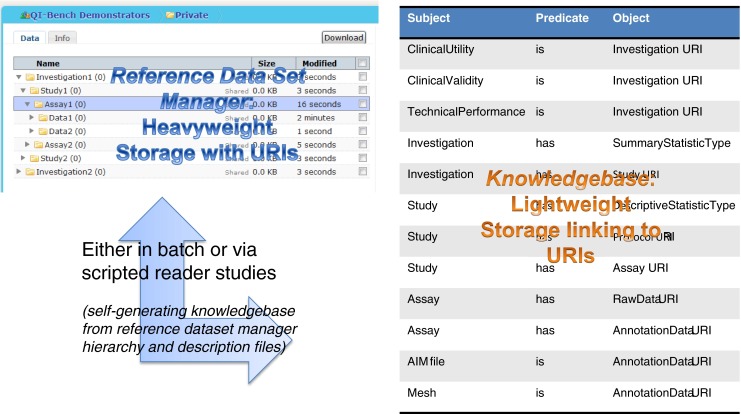
Image annotations and other derived data may be sourced from outside QI-Bench and retrieved using Formulate, or may be generated by functionality that exists within QI-Bench. In either case, storage objects are linked to the knowledge base via uniform resource identifiers within triples
Results
Specify
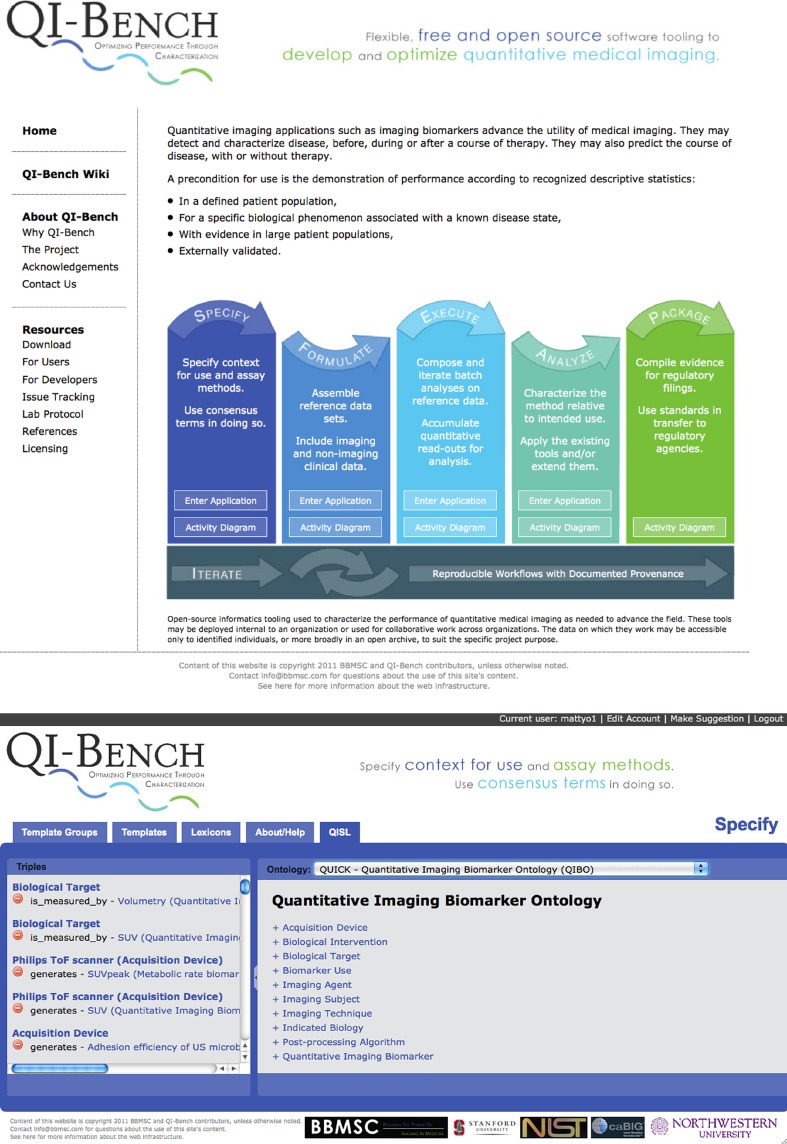
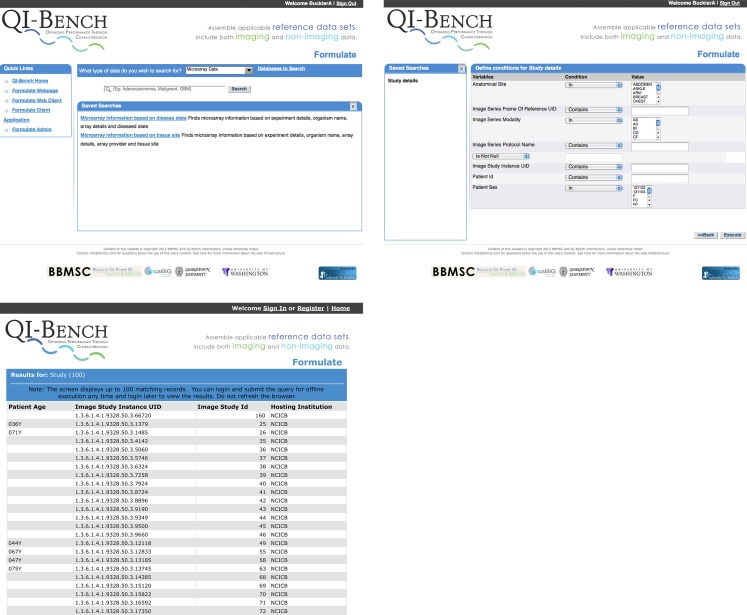
Our current prototype of Specify utilizes REST services (1) to link to ontologies on BioPortal, including QIBO and (2) to create and store triples in a database based on using QIBO to guide a question–answer paradigm for interacting with domain experts. Ultimately, this will be implemented as W3C-compliant SPARQL endpoints. This prototype has been created within the same application code of the Annotation and Image Markup (AIM) Template Builder [64] t (see Fig. 7 right panel).
Fig. 7.
Left panel Access to QI-Bench, which is composed of five applications. The first two—Specify and Formulate—are tightly linked and result in specified reference datasets being collected. Downstream applications include Execute, Analyze, and Package. Right panel The current prototype of Specify includes a question-answer paradigm driven capability using BioPortal to create a triple store
Specify implements the ontology traversal algorithm and creates triples to satisfy the features described in the Methods:
Select an ontology—The first step is to select an ontology from the full set of ontologies stored on BioPortal.
Navigate the ontology hierarchy—When an ontology is selected from the drop down list, the root terms for that ontology appear in the rightmost pane. Using the “+” link to the left of a term, a list of child terms will appear below and to the right of the current term, thus creating a tree structure. By clicking on a term in the hierarchy, the right pane is replaced with the term details, used for triple creation.
Create a triple—With a term selected in the right pane, a list of properties is displayed and the associated Range for that property is show below and to the right of the property. The “+” signs can be used to navigate the hierarchy as before until the correct Term is found in the Range to create the triple. Once the Term is found the “(+)” button can be used to create and store a triple in the database. All stored triples appear in the left-most pane on the screen.
Managing triples—The left pane is used to manage the triple store in the database. Currently, the functionality is to view the triples for the selected ontology and to remove triples from the store by clicking the “(−)” buttons.
We have accessed over 340 ontologies from the existing prototype and exercised the functionality using the relations described in the QIBO in a variety of text-based curation activities (publications and QIBA Profile excerpts) to establish feasibility of the design concept.
Formulate
The current web-based Formulate involves three main components: (1) a set of federated Web data services, (2) an engine to run queries against the Web data services and collect results, and (3) a web application to help create queries and collect the results (Fig. 8). We developed a proof-of-concept based on caB2B (cancer Bench to Bedside) suite; the primary federated query tool that provides secured and semantically enabled query and data integration capabilities leveraging the rich metadata stored in Cancer Data Standards Registry and Repository (caDSR) [65].
Fig. 8.
The current prototype of Formulate, which is presently based on caB2B, involves three main components: (1) a set of federated data services, (2) a query engine to run queries against the data services and collect result, and (3) a web application to help create queries and collect the results
caB2B is composed of three core components: the Web Application, the Client Application and the Administrative Module. The caB2B Web Application provides query templates that allow easy search and retrieval of data (e.g., Biospecimen) from a federation of services such as National Biomedical Imaging Archive (NBIA). The caB2B Client Application enables metadata-based query formulation, storage and execution. The Administrative Module provides a graphical user interface for customizing a local instance of caB2B. In the past, a caB2B-instance is deployed at University of California, Los Angeles and is utilized to discover biospecimens using several pathology and clinical annotations in the Prostate Cancer Specialized Programs of Research Excellence Biospecimen Informatics Network [66] .Our current proof-of-concept Formulate accesses 16 instances of the NBIA [67] and also other caGrid-enabled data services. An example of the output is that we found 3,759 image series from 771 patients over 17 studies of three anatomic regions from one query, which is representative of the power of the current prototype reflecting high recall. Our development roadmap seeks to expand QIBO, tie Specify to Formulate more directly by automating generation of queries to collect data to support hypothesis represented as triples, and extend Formulate’s access beyond the constrained environment of caGrid services (current proof-of-concept) to a wider range of data providers while isolating users from the data provider and their underlying data management system. The details of the development roadmap are discussed next.
Development Roadmap
Expanding QIBO
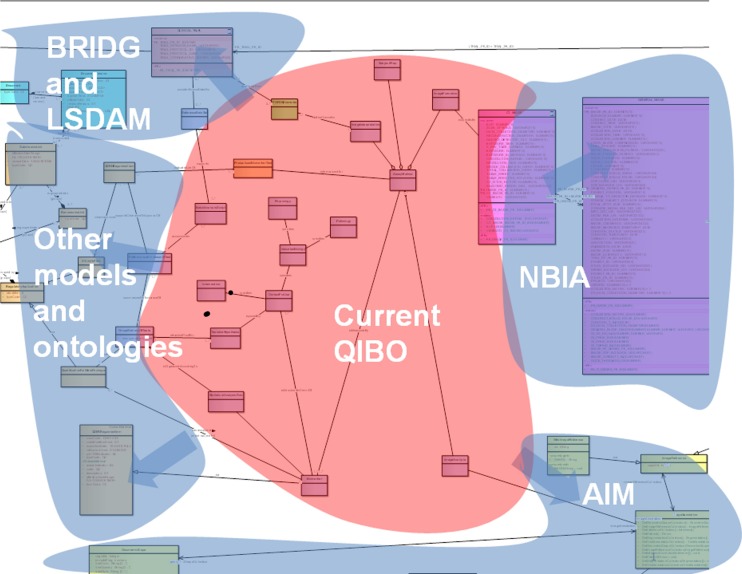
We are presently working to extend QIBO to link to existing established ontologies [68]. Figure 9 identifies related models and ontologies that we link to.
Fig. 9.
Current QIBO concepts are expanded with those from other relevant models according to links we have identified (example UML representation shown behind the colors)
Portions of the current Biomedical Research Integrated Domain Group (BRIDG) and Life Sciences-Domain Analysis Model (LS DAM) conceptual UML models are converted to ontology models in OWL. Use of OWL facilitates harmonization of different knowledge representations, namely UML and OWL, into one form, and further allows us to leverage its broader knowledge representation capability. The UML to OWL conversion is done either manually or automatically depending on how much of the model needs to be converted. Automated conversion would done in two steps: (1) convert current Sparx Enterprise Architect XML Metadata Interchange for BRIDG or LS DAM to Eclipse Modeling Framework (EMF) UML format using a customized version of transform libraries developed as part of the National Cancer Institute (NCI) Semantic Infrastructure project [69, 70]; and (2) export resulting EMF UML into a RDF/OWL representation using TopBraid Composer, a powerful semantic modeling environment [71].
First, we create the means by which QIBO is extended to relate and link to other established ontologies such as the Foundational Medical Anatomy [72], Gene Ontology [73], Systematized Nomenclature of Medicine [74], and RadLex [75]. It also incorporates caTissue [76], caArray [77], NBIA [67] and AIM UML models, associated common data elements (CDEs) and underlying NCI Thesaurus (NCIT) and other ontology concepts. We use NCIT [78] and Metathesaurus with concepts from BRIDG [79] and LS DAM models and other standardized domain ontologies such as from the Open Biological and Biomedical Ontologies Foundry [80]. We incorporate non-imaging data such as clinical outcomes by mapping to concepts from the Patient Outcome Data Service [81]. Thus, we create SPARQL endpoints for discoverable data services, using the semantic annotation based on the CDEs and the underlying controlled terminologies.
Better Integration of Specify and Formulate
With this in place, we bolster the tie from Specify into Formulate to infer testable hypotheses from the specification (e.g., if an assay method is said to be applicable to a clinical context for use, this comprises a hypothesis that could be tested) and to assemble data resources into reference datasets for the purpose of testing those hypotheses. The concepts from the specification (in the triple store) may be interpreted as search fields, for example “to test this hypothesis, data associated with the named clinical context and collected by the named technical assay methods would constitute relevant data for the proof” [13, 68]. QI-Bench’s Formulate application assembles and executes queries that draw from imaging as well as non-imaging data and is based on the RDF SPARQL application above.
Extending Formulate’s Access to more Platforms
The next version of Formulate will leverage design principles and lessons learned from our present proof-of-concept. The federated Web services will be extended to operate upon the QIBO ontology; the query engine will be extended to transform the RDF triples from Specify to machine-interpretable queries invoked against the appropriate Web services; and the Web-enabled application will be extended as necessary to support these extensions.
The federated set of Web services is being extended using Semantic Automated Discovery and Integration Framework (SADI) [82] wrapping data services such as the Multimedia Digital Archiving System (Midas) [83], XNAT [84], and caGrid services such as NBIA, caArray, caTissue, AIM, and PODS. The objects exposed by these services are prioritized based on their alignment with the QIBO concepts and use cases. The alignment is enabled by the rich metadata available for the NCI CBIIT data services through the UML representations of the models exposed by these services and CDE annotations available for them through caDSR. The service inputs and outputs are described semantically using the extended version of QIBO. The accessible and expandable service registry of SADI helps the automated composition of computer-interpretable queries by the query engine. Use of SADI and Semantic Health and Research Environment (SHARE) [85] for scientific use cases has proven to be useful in recent literature [86, 87]. Figure 2 depicts example classes from QIBO (boxes) where the direction of the arrows is from service input to service output (e.g., there is a service that returns Biological Subjects that has undergone certain Biological Interventions).
The query engine is being extended to assemble/transform the set of RDF triples to SPARQL queries. The query engine forms an uninterrupted chain linking the instance of the input class from the ontology to the desired output class and then formulates/invokes necessary SPARQL queries against the Web services deployed in the SADI framework. For this step, the semantic Web query engine SHARE that operates on the SADI framework is evaluated. The collected results are returned to Formulate in RDF/XML (see above). The Web-based Formulate allows users to select the profiles (or set of RDF triplets) created in Specify, execute a query, and retrieve the results in various forms. This application interfaces with the query engine and will have offline (asynchronous) query execution capability. The results are exportable as serialized objects [RDF/XML and comma-separated values (.csv)] and export capabilities could be extended for specific user functionality that we have documented as use cases.
These extensions are being undertaken to represent additional knowledge in the complete framework for the representation of statistical performance data (Figs. 10 and 11).
Fig. 10.
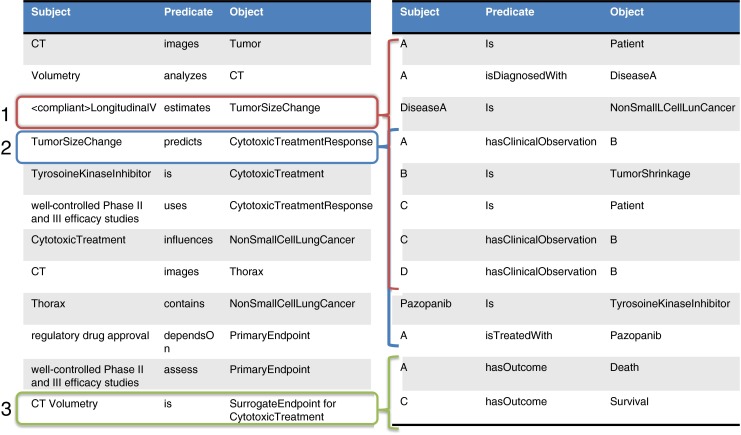
Testable hypotheses link to specific datasets used to test them
Fig. 11.
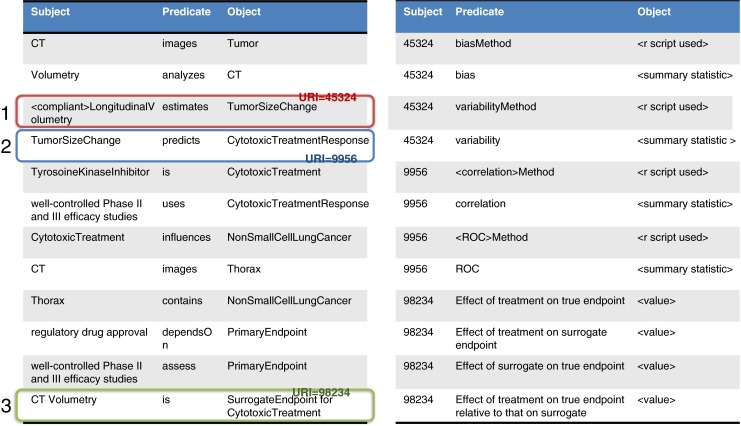
Results of the analyses are then used to annotate the knowledge base using W3C “best practices” for “relation strength” via N-ary relations that link triples where the object of the hypothesis triple links to additional triples that represent the method used as well as the result of the computations
Conclusion
The use of imaging biomarkers occurs at a time when there is a great pressure on the cost of medical services. To allow for maximum speed and economy for the validation process, this strategy is proposed as a methodological framework by which stakeholders may work together. The purpose of this project is to aggregate evidence relevant to the process of implementing imaging biomarkers to allow sufficient quality and quantity of data to be generated to support the responsible use of these new tools in clinical settings. The efficiencies that follow from using this approach could translate into defined processes that can be sustained to develop and refine imaging diagnostic and monitoring tools for the healthcare marketplace to enable sustained progress in improving healthcare outcomes.
As of this writing, QI-Bench has more than 73 registered users and 9 active developers. Our program Wiki has 217 pages with 165 uploaded files, and has been viewed in excess of 64,000 times in the last 9 months. QI-Bench is deployed in two instances at the BBMSC data center, one public facing and one for sponsored projects. These deployments represent 27 studies over 8 separate investigations across four imaging biomarkers in three therapeutic areas (oncology, cardiology, and nephrology) with study data currently comprising 18,000 imaging timepoints over 3,200 experimental subjects (human, animal, and phantom). Portions of QI-Bench have been deployed for the RSNA’s “Quantitative Imaging Data Warehouse” project, and it is presently being deployed at the FDA. We anticipate that the extensions described for Specify and Formulate will greatly expand the utility and applicability of QI-Bench, thus allowing it to grow beyond the promising start it has already experienced.
In summary, there are multiple innovative aspects of the proposed work.
-
I.
We make precise semantic specification uncomplicated for diverse groups of experts that are not skilled proficient in knowledge engineering tools. The key is to bring a level of rigor to the problem space in such a way as to facilitate cross-disciplinary teams to function without requiring individuals to be experts in the representation of knowledge, inferencing mechanisms, or computer engineering associated with grid computing or database query design.
-
II.
We map medical as well as technical domain expertise into representations well suited to emerging capabilities of the semantic web. We provide improved functionality from the currently available infrastructures such as caGrid and data integration approaches supported by these infrastructures such as caB2B. It explores how a linked data interface can be created from an object-oriented data interface based on a UML model, annotated with CDEs according to the ISO-11179 metadata registry meta-model standard. The experience could illuminate best practices for combining a semantic web approach on the data interface layer with a model-driven approach for software development, especially since CDEs are widely used to annotate Case Report Form templates for clinical research.
-
III.
We address the problem of efficient use of resources to assess how far a given biomarker may be generalized across related clinical contexts for use. Determining the biological relevance of a quantitative imaging readout is a difficult problem to solve. For example, if having direct tumor volumetry data in the lung and the pancreas, do these results extend to the liver? First, it is important to establish to what extent an intermediate marker is in the causal pathway to a true clinical endpoint. Second, given the number of permutations that arise with multiple contexts for use, multiple imaging protocols, etc., a logical and mathematical framework is needed to establish how extant study data may be used to establish performance in clinical contexts that were not explicitly part of the original studies. Our system takes advantage of the complementary features of the logical world of ontology as well as those of quantitative biostatistical analyses to characterize diagnostic or prognostic performance. Existing tools do not permit the extrapolation of statistical validation results to related contexts. Our methodology provides a formal representation for how far a validation study or collection of studies may be generalized across contexts, which has so far not been done.
These capabilities are developed in a manner that is accessible to varying levels of collaborative models, from individual companies or institutions to larger consortia or public–private partnerships to fully open public access.
Acknowledgment
This work is supported in part by National Institute of Standards and Technology Measurement Science and Engineering Cooperative Agreement 70NANB10H223 “Informatics Services for Statistically Valid and Clinically Meaningful Development and Performance Assessment of Quantitative Imaging Biomarkers.”
References
- 1.Woodcock J, Woosley R. The FDA critical path initiative and its influence on new drug development. Annu Rev Med. 2008;59:1–12. doi: 10.1146/annurev.med.59.090506.155819. [DOI] [PubMed] [Google Scholar]
- 2.Pien HH, et al. Using imaging biomarkers to accelerate drug development and clinical trials. Drug Discov Today. 2005;10(4):259–266. doi: 10.1016/S1359-6446(04)03334-3. [DOI] [PubMed] [Google Scholar]
- 3.Buckler AJ, et al. A collaborative enterprise for multi-stakeholder participation in the advancement of quantitative imaging. Radiology. 2011;258(3):906–914. doi: 10.1148/radiol.10100799. [DOI] [PubMed] [Google Scholar]
- 4.Shankar LK, et al. Considerations for the use of imaging tools for phase II treatment trials in oncology. Clin Cancer Res: Off J American Assoc Cancer Res. 2009;15(6):1891–1897. doi: 10.1158/1078-0432.CCR-08-2030. [DOI] [PubMed] [Google Scholar]
- 5.Jaffe CC. Measures of response: RECIST, WHO, and new alternatives. J Clin Oncol. 2006;24(20):3245–3251. doi: 10.1200/JCO.2006.06.5599. [DOI] [PubMed] [Google Scholar]
- 6.Karolinska Institutet. http://ki.se/?l=en, 2012: p. accessed 19 November 2012
- 7.The British Columbia BioLibrary. http://www.bcbiolibrary.ca/, Copyright © 2010 BC BioLibrary
- 8.Moncada V, Srivastava S. Biomarkers in oncology research and treatment: early detection research network: a collaborative approach. Biomark Med. 2008;2(2):181–195. doi: 10.2217/17520363.2.2.181. [DOI] [PubMed] [Google Scholar]
- 9.Yang IS, et al. IDBD: infectious disease biomarker database. Nucleic Acids Res. 2008;36(Database issue):D455–D460. doi: 10.1093/nar/gkm925. [DOI] [PMC free article] [PubMed] [Google Scholar]
- 10.Wong D: Liaison Committee Discusses Possible Radiotracer Sharing Clearinghouse, in American College of Neuropsychopharmacology2006
- 11.Wong DF. Imaging in drug discovery, preclinical, and early clinical development. J Nucl Med: Off Pub Soc Nucl Med. 2008;49(6):26N–28N. [PubMed] [Google Scholar]
- 12.Brown MS, et al. Database design and implementation for quantitative image analysis research. IEEE Trans Inf Technol Biomed. 2005;9(1):99–108. doi: 10.1109/TITB.2004.837854. [DOI] [PubMed] [Google Scholar]
- 13.Maier D, et al. Knowledge management for systems biology a general and visually driven framework applied to translational medicine. BMC Syst Biol. 2011;5:38. doi: 10.1186/1752-0509-5-38. [DOI] [PMC free article] [PubMed] [Google Scholar]
- 14.Sheikh HR, Sabir MF, Bovik AC. A statistical evaluation of recent full reference image quality assessment algorithms. IEEE Trans Image Process: Publ IEEE Signal Process Soc. 2006;15(11):3440–3451. doi: 10.1109/TIP.2006.881959. [DOI] [PubMed] [Google Scholar]
- 15.Toyohara J, et al. Evaluation of 4'-[methyl-14C]thiothymidine for in vivo DNA synthesis imaging. J Nuclear Medicine: Off Publ Soc Nucl Med. 2006;47(10):1717–1722. [PubMed] [Google Scholar]
- 16.Yuk SH, et al. Glycol chitosan/heparin immobilized iron oxide nanoparticles with a tumor-targeting characteristic for magnetic resonance imaging. Biomacromolecules. 2011;12(6):2335–2343. doi: 10.1021/bm200413a. [DOI] [PubMed] [Google Scholar]
- 17.Veenendaal LM, et al. In vitro and in vivo studies of a VEGF121/rGelonin chimeric fusion toxin targeting the neovasculature of solid tumors. Proc Natl Acad Sci U S A. 2002;99(12):7866–7871. doi: 10.1073/pnas.122157899. [DOI] [PMC free article] [PubMed] [Google Scholar]
- 18.Wen X, et al. Biodistribution, pharmacokinetics, and nuclear imaging studies of 111In-labeled rGel/BLyS fusion toxin in SCID mice bearing B cell lymphoma. Mol Imaging Biol: MIB: Off Publ Acad Mol Imaging. 2011;13(4):721–729. doi: 10.1007/s11307-010-0391-0. [DOI] [PMC free article] [PubMed] [Google Scholar]
- 19.Wang HH, et al. Durable mesenchymal stem cell labelling by using polyhedral superparamagnetic iron oxide nanoparticles. Chemistry. 2009;15(45):12417–12425. doi: 10.1002/chem.200901548. [DOI] [PubMed] [Google Scholar]
- 20.http://www.ncbi.nlm.nih.gov/books/NBK5330/, Molecular Imaging and Contrast Agent Database (MICAD). 2011 [PubMed]
- 21.QI-Bench, free and open-source informatics tooling used to characterize the performance of quantitative medical imaging. Available from: http://www.qi-bench.org/, accessed August 1, 2012
- 22.Jaffer FA, Weissleder R. Molecular imaging in the clinical arena. JAMA: J American Medical Association. 2005;293(7):855–862. doi: 10.1001/jama.293.7.855. [DOI] [PubMed] [Google Scholar]
- 23.Fleming TR. Surrogate endpoints and FDA's accelerated approval process. Heal Aff. 2005;24(1):67–78. doi: 10.1377/hlthaff.24.1.67. [DOI] [PubMed] [Google Scholar]
- 24.Atkinson, A.J.e.a: Biomarkers and surrogate endpoints: preferred definitions and conceptual framework. Clinical pharmacology and therapeutics 69(3):89–95, 2001 [DOI] [PubMed]
- 25.Katz R. Biomarkers and surrogate markers: an FDA perspective. NeuroRx. 2004;1(2):189–195. doi: 10.1602/neurorx.1.2.189. [DOI] [PMC free article] [PubMed] [Google Scholar]
- 26.Lathia CD, et al. The value, qualification, and regulatory use of surrogate end points in drug development. Clin Pharmacol Ther. 2009;86(1):32–43. doi: 10.1038/clpt.2009.69. [DOI] [PubMed] [Google Scholar]
- 27.Quon A, Gambhir SS. FDG-PET and beyond: molecular breast cancer imaging. J Clin Oncol. 2005;23(8):1664–1673. doi: 10.1200/JCO.2005.11.024. [DOI] [PubMed] [Google Scholar]
- 28.Smith JJ, Sorensen AG, Thrall JH. Biomarkers in imaging: realizing radiology's future. Radiology. 2003;227(3):633–638. doi: 10.1148/radiol.2273020518. [DOI] [PubMed] [Google Scholar]
- 29.Li W, et al. Noninvasive imaging and quantification of epidermal growth factor receptor kinase activation in vivo. Cancer Res. 2008;68(13):4990–4997. doi: 10.1158/0008-5472.CAN-07-5984. [DOI] [PMC free article] [PubMed] [Google Scholar]
- 30.Klibanov AL. Ligand-carrying gas-filled microbubbles: ultrasound contrast agents for targeted molecular imaging. Bioconjugate Chemistry. 2005;16(1):9–17. doi: 10.1021/bc049898y. [DOI] [PubMed] [Google Scholar]
- 31.Hehenberger M: Information Based Medicine: From Biobanks to Biomarkers, 2007, IBM Healthcare & Life Sciences: High Tech Connections (HTC) Forum
- 32.Sadot A, et al. Toward verified biological models. IEEE/ACM Trans Comput Biol Bioinform. 2008;5(2):223–234. doi: 10.1109/TCBB.2007.1076. [DOI] [PubMed] [Google Scholar]
- 33.Cavusoglu E.Z.E.a.M.C: A Software Framework for Multiscale and Multilevel Physiological Model Integration and Simulation, in 30th Annual International IEEE EMBS Conference 2008: Vancouver, British Columbia, Canada [DOI] [PubMed]
- 34.Feng D: Molecular Imaging and Biomedical Process Modeling, in 2nd Asia-Pacific Bioinformatics Conference (APBC2004)2004
- 35.Chen J, et al: How Will Bioinformatics Impact Signal Processing Research? IEEE Signal Processing Magazine p. 16–26, 2003
- 36.Toretsky J, et al. Preparation of F-18 labeled annexin V: a potential PET radiopharmaceutical for imaging cell death. Nucl Med Biol. 2004;31(6):747–752. doi: 10.1016/j.nucmedbio.2004.02.007. [DOI] [PubMed] [Google Scholar]
- 37.Zijlstra, S., J. Gunawan, and W. Burchert, Synthesis and evaluation of a 18F-labelled recombinant annexin-V derivative, for identification and quantification of apoptotic cells with PET. Applied radiation and isotopes : including data, instrumentation and methods for use in agriculture, industry and medicine 58(2): p. 201–7, 2003 [DOI] [PubMed]
- 38.Zhao B, et al. Evaluating variability in tumor measurements from same-day repeat CT scans of patients with non-small cell lung cancer. Radiology. 2009;252(1):263–272. doi: 10.1148/radiol.2522081593. [DOI] [PMC free article] [PubMed] [Google Scholar]
- 39.Buckler AJ, Boellaard R. Standardization of quantitative imaging: the time is right, and 18F-FDG PET/CT is a good place to start. J Medicine: Off Publ Soc Nucl Med. 2011;52(2):171–172. doi: 10.2967/jnumed.110.081224. [DOI] [PubMed] [Google Scholar]
- 40.Creating the gene ontology resource: design and implementation. Genome Res 11(8): p. 1425–33, 2001 [DOI] [PMC free article] [PubMed]
- 41.Ashburner M, et al. Gene ontology: tool for the unification of biology. The Gene Ontology Consortium. Nat Genet. 2000;25(1):25–29. doi: 10.1038/75556. [DOI] [PMC free article] [PubMed] [Google Scholar]
- 42.Romero-Zaliz RC, et al. A multiobjective evolutionary conceptual clustering methodology for gene annotation within structural databases: a case of study on the gene ontology database. IEEE Trans Evol Comput. 2008;12(6):679–701. doi: 10.1109/TEVC.2008.915995. [DOI] [Google Scholar]
- 43.Brazma A, et al. Minimum information about a microarray experiment (MIAME)-toward standards for microarray data. Nat Genet. 2001;29(4):365–371. doi: 10.1038/ng1201-365. [DOI] [PubMed] [Google Scholar]
- 44.Sirota M, et al. Discovery and preclinical validation of drug indications using compendia of public gene expression data. Sci Trans Med. 2011;3(96):96ra77. doi: 10.1126/scitranslmed.3001318. [DOI] [PMC free article] [PubMed] [Google Scholar]
- 45.Buckler AJ, et al. Quantitative imaging test approval and biomarker qualification: interrelated but distinct activities. Radiology. 2011;259(3):875–884. doi: 10.1148/radiol.10100800. [DOI] [PMC free article] [PubMed] [Google Scholar]
- 46.Buckler AJ, et al. Volumetric CT in lung cancer: an example for the qualification of imaging as a biomarker. Acad Radiol. 2010;17(1):107–115. doi: 10.1016/j.acra.2009.06.019. [DOI] [PubMed] [Google Scholar]
- 47.Buckler AJ, et al. The use of volumetric CT as an imaging biomarker in lung cancer. Acad Radiol. 2010;17(1):100–106. doi: 10.1016/j.acra.2009.07.030. [DOI] [PubMed] [Google Scholar]
- 48.Buckler AJ, et al. Datasets for the qualification of volumetric CT as a quantitative imaging biomarker in lung cancer. Opt Express. 2010;18(14):15267–15282. doi: 10.1364/OE.18.015267. [DOI] [PubMed] [Google Scholar]
- 49.Buckler AJ, Schwartz LH, Petrick N, McNitt-Gray M, Zhao B, Fenimore C, Reeves AP, Mozley PD, Avila RS. Datasets for the qualification of CT as a quantitative imaging biomarker in lung cancer. Opt Express. 2010;18(14):16. doi: 10.1364/OE.18.015267. [DOI] [PubMed] [Google Scholar]
- 50.Mozley PD, et al. Change in lung tumor volume as a biomarker of treatment response: a critical review of the evidence. Ann Oncol. 2010;21(9):1751–1755. doi: 10.1093/annonc/mdq051. [DOI] [PubMed] [Google Scholar]
- 51.Liu T, et al: The Imaging Biomarker Ontology: Ontology-based Support for Imaging Biomarker Research, in Society for Imaging Informatics in Medicine 2011 Annual Meeting2011
- 52.Noy NF and DL McGuinness: A Guide to Creating Your First Ontology. Stanford Knowledge Systems Laboratory technical report KSL-01-05 and Stanford Medical Informatics technical report SMI-2001-0880, 2001
- 53.Rubin DL. Creating and curating a terminology for radiology: ontology modeling and analysis. J Digital Imaging Off J Soc Comput Appl Radiol. 2008;21(4):355–362. doi: 10.1007/s10278-007-9073-0. [DOI] [PMC free article] [PubMed] [Google Scholar]
- 54.Rubin DL, Noy NF, Musen MA. Protege: a tool for managing and using terminology in radiology applications. J Digital Imaging Off J Soc Comput Appl Radiol. 2007;20(Suppl 1):34–46. doi: 10.1007/s10278-007-9065-0. [DOI] [PMC free article] [PubMed] [Google Scholar]
- 55.Musen MA. Domain ontologies in software engineering: use of Protege with the EON architecture. Methods Inform Med. 1998;37(4–5):540–550. [PubMed] [Google Scholar]
- 56.Musen MA, et al: PROTEGE-II: computer support for development of intelligent systems from libraries of components. Medinfo. MEDINFO 8 Pt 1: p. 766–70, 1995 [PubMed]
- 57.The National Center for Biomedical Ontology BioPortal. Available from: http://bioportal.bioontology.org/, accessed 27 November 2011
- 58.BioPortal REST services. Available from: http://www.bioontology.org/wiki/index.php/BioPortal_REST_services, accessed 25 November 2011
- 59.QIBA Protocols and Profiles. 2012; Available from: http://www.rsna.org/QIBA_Protocols_and_Profiles.aspx, accessed November 20, 2012
- 60.Open source ISA metadata tracking tools. Available from: http://isa-tools.org/, accessed June 7, 2012
- 61.Sansone SA, et al. The first RSBI (ISA-TAB) workshop: “can a simple format work for complex studies?”. OMICS. 2008;12(2):143–149. doi: 10.1089/omi.2008.0019. [DOI] [PubMed] [Google Scholar]
- 62.Study Data Tabulation Model (SDTM). Available from: http://www.cdisc.org/sdtm, accessed 27 November 2011.
- 63.Sargent DJ, et al. Validation of novel imaging methodologies for use as cancer clinical trial end-points. Eur J Cancer. 2009;45(2):290–299. doi: 10.1016/j.ejca.2008.10.030. [DOI] [PMC free article] [PubMed] [Google Scholar]
- 64.AIM Template Builder Documentation. 2011; Available from: https://wiki.nci.nih.gov/display/AIM/AIM+Template+Builder+Documentation, accessed November 2, 2012.
- 65.Cancer Data Standards Registry and Repository (caDSR). Available from: https://cabig.nci.nih.gov/concepts/caDSR/, accessed 27 November 2011.
- 66.Abstracts: Pathology Informatics 2011 Meeting. 2011; Available from: http://www.jpathinformatics.org/article.asp?issn=2153-3539;year=2011;volume=2;issue=1;spage=43;epage=43;aulast=, accessed November 20, 2012
- 67.National Biomedical Imaging Archive. 2011; Available from: https://cabig.nci.nih.gov/tools/NCIA, accessed 27 November 2011
- 68.Tirmizi SH, et al. Mapping between the OBO and OWL ontology languages. J Biomed Semantics. 2011;2(Suppl 1):S3. doi: 10.1186/2041-1480-2-S1-S3. [DOI] [PMC free article] [PubMed] [Google Scholar]
- 69.Eclipse Modeling Framework Project (EMF). Available from: http://eclipse.org/modeling/emf/, accessed 27 November 2011
- 70.ECCF Transform Plugins for Eclipse. Available from: https://ncisvn.nci.nih.gov/WebSVN/listing.php?repname=seminfrastruc&path=%2Ftrunk%2Feccf%2Feclipse%2Fplugins%2Fgov.nih.nci.si.eccf.transform%2F&rev=280&peg=280, accessed 27 November 2011.
- 71.TopBraid Composer. Available from: http://www.topquadrant.com/products/TB_Composer.html, accessed 27 November 2011
- 72.The Foundational Model of Anatomy ontology (FMA). Available from: http://sig.biostr.washington.edu/projects/fm/AboutFM.html, accessed 27 November 2011
- 73.The Gene Ontology project. Available from: http://www.geneontology.org/, accessed 27 November 2011
- 74.SNOMED Clinical Terms® (SNOMED CT®). Available from: http://www.nlm.nih.gov/research/umls/Snomed/snomed_main.html, accessed 27 November 2011
- 75.RSNA RadLex. Available from: http://www.rsna.org/informatics/radlex.cfm, accessed 27 November 2011
- 76.caTissue Suite. Available from: https://cabig.nci.nih.gov/tools/catissuesuite, accessed 27 November 2011
- 77.caArray—Array Data Management System. Available from: https://cabig.nci.nih.gov/tools/caArray, accessed 27 November 2011
- 78.NCI Thesaurus (NCIt). Available from: http://ncit.nci.nih.gov/ncitbrowser/, accessed 27 November 2011
- 79.Chapman AB, Wei W. Imaging approaches to patients with polycystic kidney disease. Semin Nephrol. 2011;31(3):237–244. doi: 10.1016/j.semnephrol.2011.05.003. [DOI] [PMC free article] [PubMed] [Google Scholar]
- 80.The Open Biological and Biomedical Ontologies. Available from: http://www.obofoundry.org/, accessed 27 November 2011
- 81.Patient Outcomes Service (PODS). Available from: https://wiki.nci.nih.gov/display/caEHR/Patient+Outcomes+Service, accessed 27 November 2011
- 82.Wilkinson M, Vandervalk B, and McCarthy L: The Semantic Automated Discovery and Integration (SADI) Web service Design-Pattern, API and Reference Implementation. Available from Nature Precedings <http://hdl.handle.net/10101/npre.2011.6550.1>. 2011 [DOI] [PMC free article] [PubMed]
- 83.Midas. Available from: http://www.midasplatform.org, accessed October 15, 2012
- 84.XNAT. Available from: http://xnat.org/, accessed November 20, 2012
- 85.Vandervalk BP, McCarthy EL, Wilkinson MD. SHARE: a semantic web query engine for bioinformatics (Defense) Integr VLSI J. 2009;5926:367–369. [Google Scholar]
- 86.Chepelev L, et al. Prototype semantic infrastructure for automated small molecule classification and annotation in lipidomics. BMC Bioinforma. 2011;12(1):303. doi: 10.1186/1471-2105-12-303. [DOI] [PMC free article] [PubMed] [Google Scholar]
- 87.Laurila JB, et al. Algorithms and semantic infrastructure for mutation impact extraction and grounding. BMC Genomics. 2010;11(Suppl 4):S24. doi: 10.1186/1471-2164-11-S4-S24. [DOI] [PMC free article] [PubMed] [Google Scholar]


