Abstract
Usability aspects of different integration concepts for picture archiving and communication systems (PACS) and computer-aided diagnosis (CAD) were inquired on the example of BoneXpert, a program determining the skeletal age from a left hand’s radiograph. CAD-PACS integration was assessed according to its levels: data, function, presentation, and context integration focusing on usability aspects. A user-based study design was selected. Statements of seven experienced radiologists using two alternative types of integration provided by BoneXpert were acquired and analyzed using a mixed-methods approach based on think-aloud records and a questionnaire. In both variants, the CAD module (BoneXpert) was easily integrated in the workflow, found comprehensible and fitting in the conceptual framework of the radiologists. Weak points of the software integration referred to data and context integration. Surprisingly, visualization of intermediate image processing states (presentation integration) was found less important as compared to efficient handling and fast computation. Seamlessly integrating CAD into the PACS without additional work steps or unnecessary interrupts and without visualizing intermediate images may considerably improve software performance and user acceptance with efforts in time.
Keywords: Computer-aided diagnosis, Software integration, Qualitative evaluation, Think-aloud method, User involvement
Background
Certainty and celerity of medical decision making are constitutive criteria for the accurate treatment of patients and cost effectiveness. The use of decision supporting tools such as medical software applications is an appropriate way to improve the decision processes. In diagnostic radiology, computer-based assistance in the interpretation of medical images is of particular value (computer-aided detection/diagnosis, CAD) [1]. The Society of Computer Applications in Radiology named CAD as one out of six crucial interdisciplinary efforts necessary to overcome the problem of data and information overflow in radiology [2]. The integration of the CAD software into picture archiving and communication systems (PACS) is a central requirement and prerequisite for its efficient usage [3]. However, there is a huge gap between the number of CAD systems reported in scientific literature and those routinely used in radiological practice [4].
Insufficient CAD-PACS integration is considered a main cause of this gap [3, 4], where the short comings do not only refer to the technical integration but also to software usability. Usability is defined by an ISO standard as: “The extent to which a product can be used by specified users to achieve specified goals with effectiveness, efficiency, and satisfaction in a specified context of use” (ISO 9241–11:1998, 3.1).
Most of the studies addressing CAD-PACS integration focus on the technical integration, namely, on system interoperability: Zhou et al. [3] addressed CAD-PACS integration focussing on aspects of appropriate data exchange formats and protocols.
Only few studies focus on the aspect of software usability: In a recent investigation, Antani et al. have performed a usability study to determine the need of content-based image retrieval systems in clinical practice, a CAD variant suggesting computerized second opinions based on image similarity measures [5]. Combining expert- and user-based methods, the authors evaluated the system for software errors, its ease of use and its “user readiness,” i.e., the identification of obstacles that hamper practical use of such systems, in general. Contrarily, Bitter et al. [6] use the expert list method, take the accordance, and depart the evaluation in three categories: application developer-oriented evaluation, application user-oriented evaluation, and the time required for the basic application development steps.
However, while an appropriate research design being crucial to address this important aspect [7], studies, which systematically assess usability aspects of CAD-PACS integration, have rarely been published yet.
Aim
The study reported in this paper aims at investigating usability aspects of CAD-PACS integration in the context of bone age determination. The study compares two different variants of CAD-PACS integration in order to compare their effect on the usability of the system in the context of the radiologists’ workflow.
Hypothesis and General Approach
As stated by Doi et al. [4], CAD aims at gaining a “synergistic effect obtained by combining the radiologist’s competence and the computer’s capability.” Therefore, CAD-PACS integration and usability aspects—both fostering a seamless human–computer interaction and workflow integration—can be assumed to play an important role for achieving this synergistic effect. Furthermore, the assistance metaphor of CAD seems to imply a need for transparent and at least partly understandable system behavior in order to convince the assisted radiologists of the reliability and validity of the systems service.
Our study compares integration variants where the integrated CAD-PACS ensemble reports and visualizes more vs. less intermediate steps. Our initial hypothesis assumes the more transparent variant, visualizing intermediate steps, to achieve better usability than the “black box” variant, which presents the final result or recommendation while avoiding to reveal intermediate steps.
The study investigates BoneXpert, a CAD application introduced to suggest a bone age reading based on the patient’s left hand radiograph [8]. Focusing on usability aspects, we design, perform, and evaluate a mixed-methods study combining the acquisition and analysis of both quantitative and qualitative data, which will be adopted to determine the specific usability profiles and differences of the two variants of system integration.
Methods
Clinical Bone Age Assessment
Clinically, determination of skeletal maturity (i.e., bone age assessment, BAA) is required to track endocrine disorders or pediatric syndromes [9, 10] and for forensic age assessment of adolescents and young adults [11, 12]. Based on skeletal radiographs of the left hand, the methods of Greulich and Pyle (GP) [13] or Tanner and Whitehouse (TW) [14] are applied, where qualitative and quantitative comparison to reference images is performed by the radiologist, respectively. More specifically, Tanner and Whitehouse have presented a complex evaluation scheme, where scores are given according to the shape characteristics of individual distal forearm and metacarpal bones and epiphyses, which are then combined numerically into the skeletal age guess. Hence, either the methods are error prone and time consuming, since both require extensive manual interaction of up to 15 min per task.
CAD aims at speeding up the process supporting physicians with automatic image analysis. Beside research-oriented approaches [15–17], a commercial system became recently available providing fully automatic BAA measurement [10]. Using such methods, the radiologist must majorly be provided with system interfaces transferring the images from the PACS into the CAD software and resubmitting the result of automated analysis—after medical verification—into his written reading report.
The BoneXpert Program
Running under Windows XP or Vista, BoneXpert (Visiana, Denmark, Version 1.1.4) is a standalone application to determine the bone age of children [8]. BoneXpert features are GP, TW2, TW3, TW Japan as bone age scales, the ethnicities Caucasian, African-American, Hispanic, Asian (USA and Japan), disorders like short stature and pubertas praecox and more specialties (Table 1). However, it has not been approved for clinical use by the U. S. Food and Drug Administration (FDA).
Table 1.
Feature list of BoneXpert [1]
| Bone age scales | Greulich-Pyle (GP), Tanner-Whitehouse (TW2, TW3, TW-Japan) |
| Bone age range | 2.5–17 years for boys and 2–15 years for girls |
| Ethnicities | Caucasian, African American, Hispanic, Asian (USA and Japan) |
| Disorders | Healthy children, short stature, pubertas praecox |
| Precision SD | 0.00 years, rerating same image |
| 0.20 years, including new X-ray | |
| Accuracy SD | 0.70 years (GP bone age relative to typical manual rater) |
| Sensitivity to image quality | <0.20 years (95 % conf) |
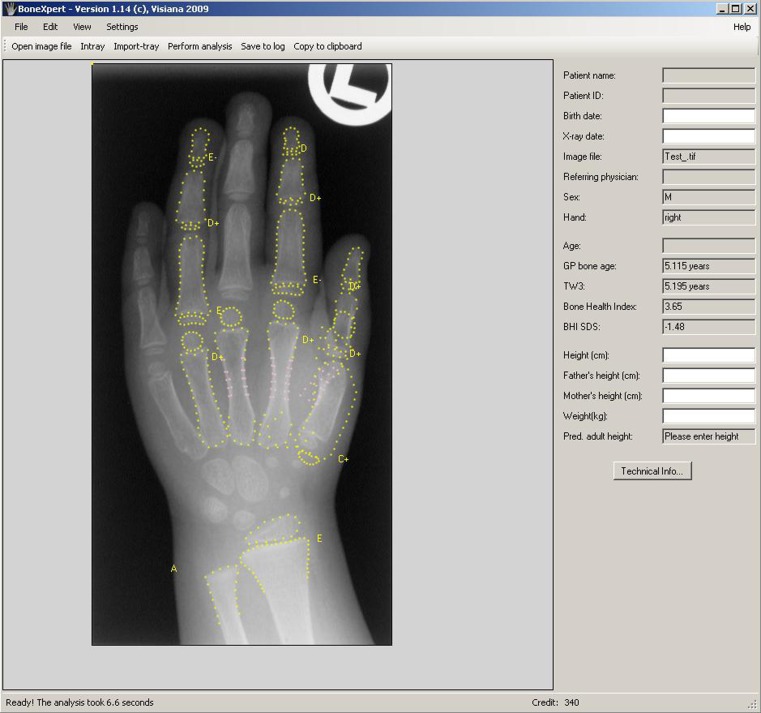
After loading the X-ray into BoneXpert, the analysis is started by clicking “Perform Analysis” (Fig. 1). To load the images, PACS integration of BoneXpert can be achieved in two different ways:
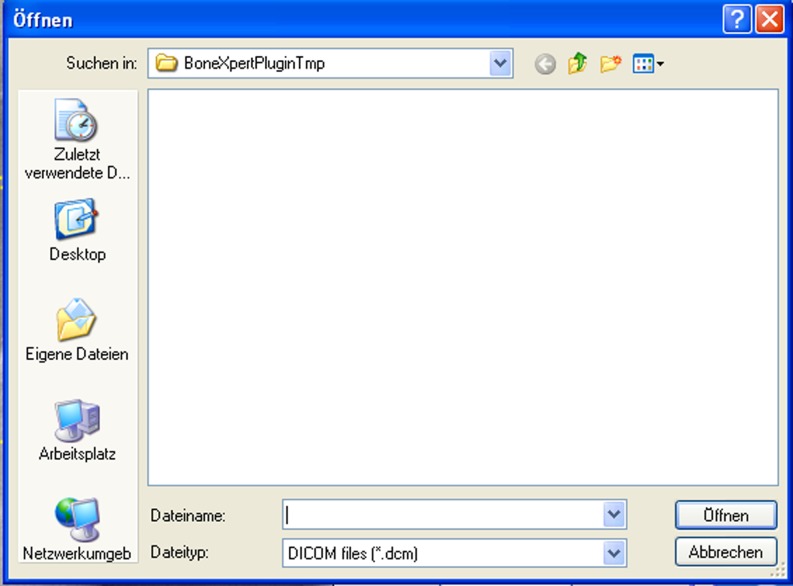
Using BoneXpert Plugin: the images have to be loaded manually via a temporary folder on the hard disk (Fig. 2)
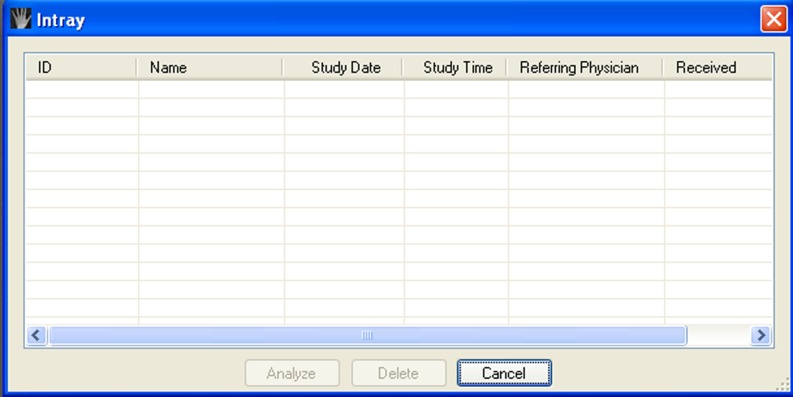
Using BoneXpert Intray: the Digital Imaging and Communication in Medicine (DICOM) protocol is used to feed an intray of images or analysis (Fig. 3).
Fig. 1.
BoneXpert Main Window
Fig. 2.
BoneXpert Plugin Folder
Fig. 3.
BoneXpert Intray
Both methods, however, require manual actions by the physicians: “export”/”DICOM send” and “load file”/”select DICOM,” respectively.
Selection of Evaluation Method
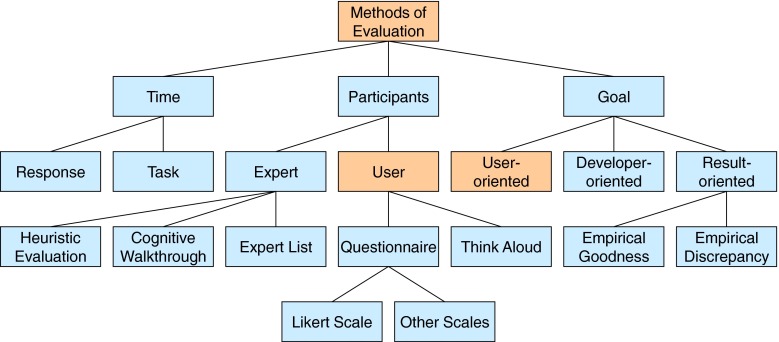
Methodically, evaluation methods in qualitative research can be categorized as “Participants,” “Goal,” and “Time” (Fig. 4). In our case, expert-based methods, including developer- and user-oriented methods, can be excluded because they massively depend on the skills and expertise of the participant experts [6]. The result-oriented methods are more suitable for usability evaluations, not for the evaluation of integration [18] and the time-concentrated methods are remote of an evaluation of applicability, but to perfect the time needed, not the comfort of a user [6, 19, 20].
Fig. 4.
Methods of evaluation
All in all, the user-based methods turn out to be a suitable group of methods. Especially, the involvement of the end users produces good results in assailable evaluation tasks like tested before [5, 21–23]. In this group, think-aloud analysis and questionnaires are suitable methods.
Think-Aloud Method
The think-aloud method assesses end users performing a series of tasks while verbalizing their thoughts. According to Jaspers, think-aloud is a verbal report method from the cognitive psychology that is made up of two [24]:
Collecting think-aloud protocols in a systematic way
Analyzing these protocols.
The evaluators should be a sample of users, representing the expected end users. If there are different types of users, a sufficient number of each user type (approximate eight subjects) should be included in the test sessions. The task examples should be as realistic as possible and representative for end-user performances in daily life situations.
During a test session, the instructor should only intervene when the subject stops talking. At the session, there should be full audio taping and/or video recording of the subject and, if necessary, video recording of the computer screens to document all important information.
Questionnaire
Questionnaires are a rapid, accepted and recognized option to overview people’s sentiments. They are often used for opinion surveys, and there exist a lot of good and bad questionnaires [25]. The typically used rating score at questionnaires is the Likert scale [26]. Sometimes, a group of items is created and scored together [27]. The most important existing questionnaires addressing usability aspects are the Computer Usability Satisfaction Questionnaire (CUSQ), which is answered after a session with the program, software, or website to be evaluated by the end user [28], and ISOMETRICS and ISONORM, which both judge usability of software programs. They are based on the seven basic principles of DIN EN ISO 9241-10, which are:
Suitability for the task
Self-descriptiveness
Controllability
Conformity with user expectations
Error tolerance
Suitability for individualization
and the Software Usability Measurement Inventory (SUMI), a usability questionnaire, which is mostly used for assessing new products during product evaluation, comparing products or versions of products and setting a goal for future application developments [32].
Study Design
The study adopted a mixed-methods approach combining the acquisition and analysis of qualitative and quantitative data as well. Qualitative data are elicited during a thinking-aloud approach. Quantitative data were collected using scaled items contained in a questionnaire As well as time measurements for task solving.
Setting
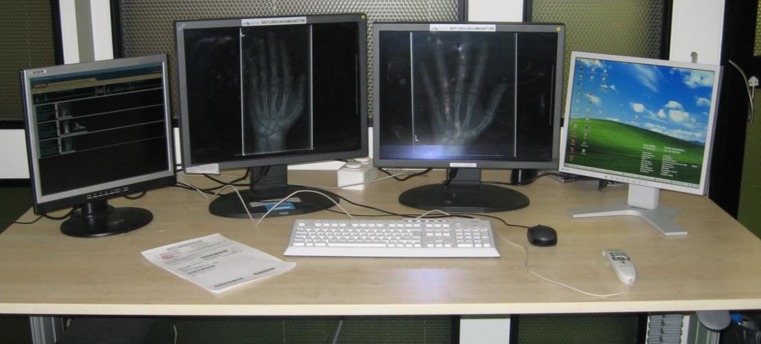
The setting is chosen as realistic as possible: The thinking-aloud sessions are situated in a clinical setting using a typical workplace, where normally radiologists determine the bone age. The workplace contains four computer monitors: The two in the middle support radiographs and the two exterior ones are control processing programs and interfaces (Fig. 5). Normally, the PACS client (iSite Radiology, Version 4.41) opens on the left one, so that consequently BoneXpert can be watched simultaneously on the right one. The workspace is temporarily equipped with the means to record the users’ comments during the thinking-aloud session.
Fig. 5.
Workplace used during the thinking-aloud session
Participants
The user-based approach involves end users only, i.e., radiologists regularly and frequently diagnosing X-rays using the PACS and assisting software modules. In contrast to summative evaluation studies normally involving much larger numbers of participants, usability tests can be successfully carried out with a small number of testers (especially when formatively applied, for instance, in order to improve software solutions): It is stated that the number of participants should not fall below five, while more than eight users would not actually yield more [33]. Since an odd number is preferable, we decided to work with seven participants.
Each usability test is supervised by a person (tester) acquainted to the software and also acquainted to interpret hand radiographs.
Flow of the Study
Data acquisition takes the form of a think-aloud session. The radiologists are asked to analyze hand radiographs in order to determine the bone age. Each session lasts 45 min: The introduction and preliminary tests take about 5 min, the application is tested during the following 30 min, and finally, the answering of the questionnaire takes about 10 min.
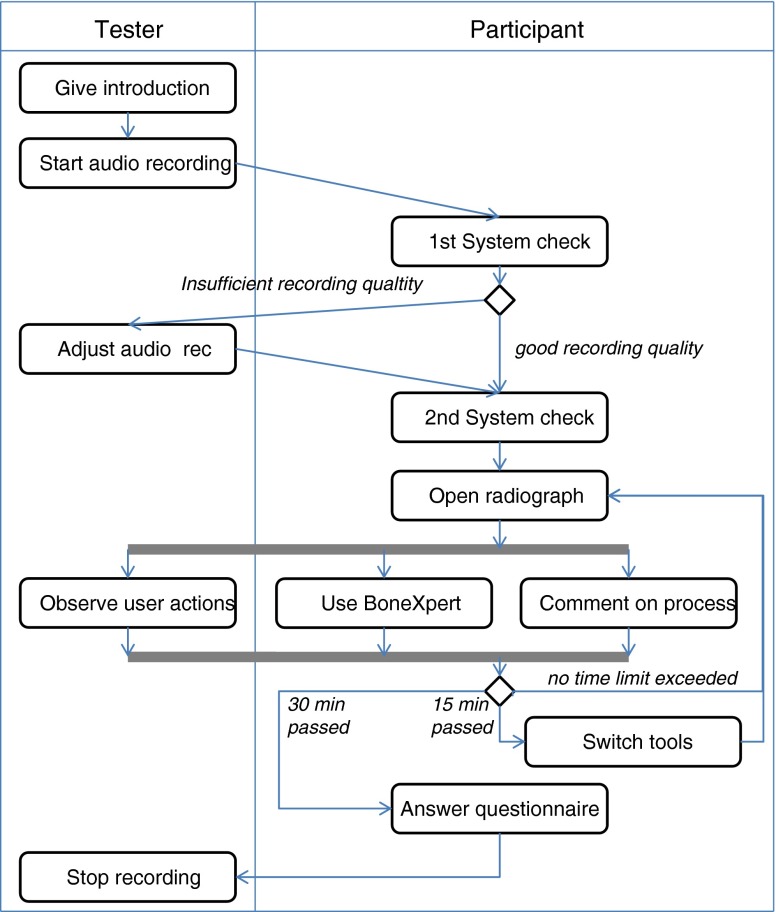
Figure 6 presents an overview of the thinking-aloud session. During the session, the tester follows a strict study protocol based on a written guideline. The tester introduces the participants to the test scenario, checks and eventually adjusts the quality of the audio recording, observes the users’ actions and is able to help in case of technical problems.
Fig. 6.
Process flow of the thinking-aloud session. The process steps, decision forks, and parallel splits are represented by boxes, diamond symbols, and bars, respectively
After two preliminary tests of the basic system functionality, the participants sequentially open and analyze eight hand radiographs. During testing, the probands are advised to talk the whole time as if they would think-aloud. If someone stops talking, he or she is asked to continue by the tester. After finishing the analyses, the participants fill out the questionnaire.
About half of the participants use BoneXpert Plugin for the first 15 min of the analysis; then, they switch to BoneXpert Intray. The other half of the participants start with BoneXpert Intray instead and switch to BoneXpert Plugin. The participants are asked to determine as many as possible hand radiographs in half an hour using BoneXpert as a second opinion.
Information and Material Available During the Session
For their assignment, the participants get an instruction manual, 50 consultation papers with patient data, and the promise to get help on enquiry. The information provided is:
BoneXpert is a software to determine the bone age.
BoneXpert should be available in future.
For testing purposes BoneXpert got installed and integrated at this carrel.
The program is unauthorized in Germany for the exclusive application.
It is an evaluation of the integration.
The dialogue gets recorded.
The introduction given by the testers has been preformulated in order to provide all important information combined with a check list for all important material to be handed out.
Randomization
Randomization is achieved by randomly assigning the participants to the group starting with BoneXpert plugin and the one starting with BoneXpert Intray, respectively.
Questionnaire
In order to foster the participant’s compliance to the test scenario, the questionnaire to be answered after using BoneXpert had to meet special requirements:
All items are to be answered in no more than 15 min, since complete and concise data was needed.
All items focus on integration-related usability instead of covering all aspects of usability.
All items meet high standards of comprehensibility and scale construction.
We therefore identified the following leading usability questionnaires including items, which refer to integration aspects, by a literature research: CUSQ [28], ISOMETRICS [29], ISONORM [30], and SUMI [32]. Starting from these questionnaires an item pool was constructed. The pool was iteratively reduced by (1) selecting items addressing integration aspects, (2) excluding redundant (i.e., very similar) items, and (3) carefully adapting the wording of the items (i.e., by changing “the software” to “BoneXpert”) in order to further avoid any misunderstanding. The final questionnaire consists of 45 scaled items that were dedicated to four categories of integration, namely [34]:
Data integration avoids repeated entry of same data items (e.g., basic patient data that have been already entered into the hospital information system (HIS) is then available in the radiology information system and PACS and does not need to be captured for a second time).
Service integration is achieved if all functions and services can be called from any place or workstation connected within the HIS (e.g., the radiologist can access BAA-CAD directly from his reading workstation).
Presentation integration ensures that all parts and modules of the HIS present data and user interfaces in a consistent and likewise way (e.g., the same symbol and colour indicates the access point to patient basic data in both, the HIS and the CAD system);
Visual integration (context integration) means that a task only needs to be done once in the same workflow (e.g., if the patient was selected in the HIS; he must not be selected again within a called CAD application).
The questionnaire uses Likert-scaled items: Users are asked to assess a given statement (e.g., “Terms are used consistently in BoneXpert and the PACS, respectively.”) by choosing one of the following grades:
- −2
“Strongly disagree”
- −1
“Partly disagree”
- 0
“No decision”
- +1
“Partly agree”
- +2
“Strongly agree.”
In order to enforce the attention of the participants when answering, the set of items contains negative and positive statements concerning usability aspect [e.g., “The programs’ feedback is comprehensible” (positive) vs. “There are too many work steps before starting the analysis” (negative)].
Qualitative Text Analysis
The audio files recorded during the think-aloud session get transcribed and coded. Coding is performed following a bottom–up approach [35]: All text is read twice: In the first run, text passages, which contain statements referring to the usability aspects of BoneXpert are identified, marked, and characterized by keywords. The identification of relevant text passages is based on both syntactic and semantic criteria: In order to preserve the context, we refrain from selecting single words. Instead, text fragments are searched that consist of one or more clauses, a subordinate clause or at least a noun phrase (i.e., quite similar to a referenced quotation in scientific literature). Furthermore, as an additional semantic criterion, the text fragments are required to represent one coherent concept relevant to the subject of the investigation (i.e., one specific aspect, one relevant factor). The keyword assigned to the text passage represents this coherent concept. Afterwards, the keywords are grouped, normalized (in the sense of eliminating synonyms and spelling variants), and assigned to suitable categories. In the second run, this structured set of codes is used to consistently assign all relevant text passages identified before to all suitable codes.
Qualitative text analysis was supported by MAXQDA2 (by VERBI Software-Consult-Sozialforschung GmBH Berlin, Germany).
Quantitative Data Analysis
Descriptive statistics (mean, median, standard deviation, max value, and min value) is calculated for each item of the questionnaire. The answers of items, which contain negative statements to be assessed by the participants (see above), are inverted: Their grades get multiplied by a correction factor of −1. Subsequently, the items are ordered with respect to their mean values. The resulting ranking represents a spectrum of usability aspects, which reaches from aspects positively rated by the users to aspects found increasingly problematic. Box plots are generated in order to give a compact visualization of the results.
For generating descriptive statistics and box plots we used The R Project (v2.11.1—available at http://www.r-project.org/) and RStudio (v9.96—available at http://www.rstudio.org).
Results
Participants
Following the study design radiologists routinely diagnosing radiographs using the PACS were included: All subjects (N=7) were selected from the residency program at University Hospital Aachen, Dept. of Diagnostic Radiology, Aachen, Germany, with 1 up to 4 years of experience in paediatric radiology. The number of radiographs proceeded by the participants during the think-aloud session ranged from 12 to 14 per person.
Qualitative Data
Based on the transcripts of the audio files and the subsequent coding process, a total of 111 text passages was selected and assigned to keywords (codes) following the two-step procedure described in “Methods.” Transcribing and coding of the seven records took about 40 h. The selected passages contained the relevant statements of the participants addressing usability aspects of BoneXpert, integrated into the diagnostic workflow using the two different modules for CAD-PACS integration.
Table 2 gives an overview of the code system derived by the qualitative analysis and the number of statements assigned to each code.
Table 3.
Average degrees of parts of integration
| Data integration | N | Minimum | Maximum | Mean | SD |
|---|---|---|---|---|---|
| BoneXpert Intray better (Q 16) | 7 | −2 | 2 | 0.43 | 1.718 |
| BoneXpert Plugin better (Q 45) | 7 | −2 | 2 | −0.57 | 1.618 |
There were ten statements concerning program failures, which included one indicating a complete program abortion during the test, seven script errors (where the program informed the user about malfunctioning of specific steps) and two problems concerning user authorization. The following code categories of Table 2 (namely “Direct analysis,” “Image handling,” and “BoneXpert”) address aspects of BoneXpert-PACS integration and the specific usability of the BoneXpert module. 16 statements voted strongly for an immediate analysis of the images, which would not require the user to trigger the sending of X-rays to the BoneXpert module and to close their personal folder in order to avoid access conflicts by the program. Another 14 statements expressed problems concerning the DICOM-list to be used each time an X-ray is selected and handed over to the BoneXpert module (focusing on short-comings of the sorting of list entries). The 20 statements assigned to the category “Image handling” similarly address integration problems, here concerning the steps necessary to prepare and hand over an image to the BoneXpert module. In these statements, the visualization of intermediate image processing results, outlining the bones, epiphyses, and other annotations in different styles and colors (Fig. 1) was repeatedly commented as superfluous.
Quantitative Data
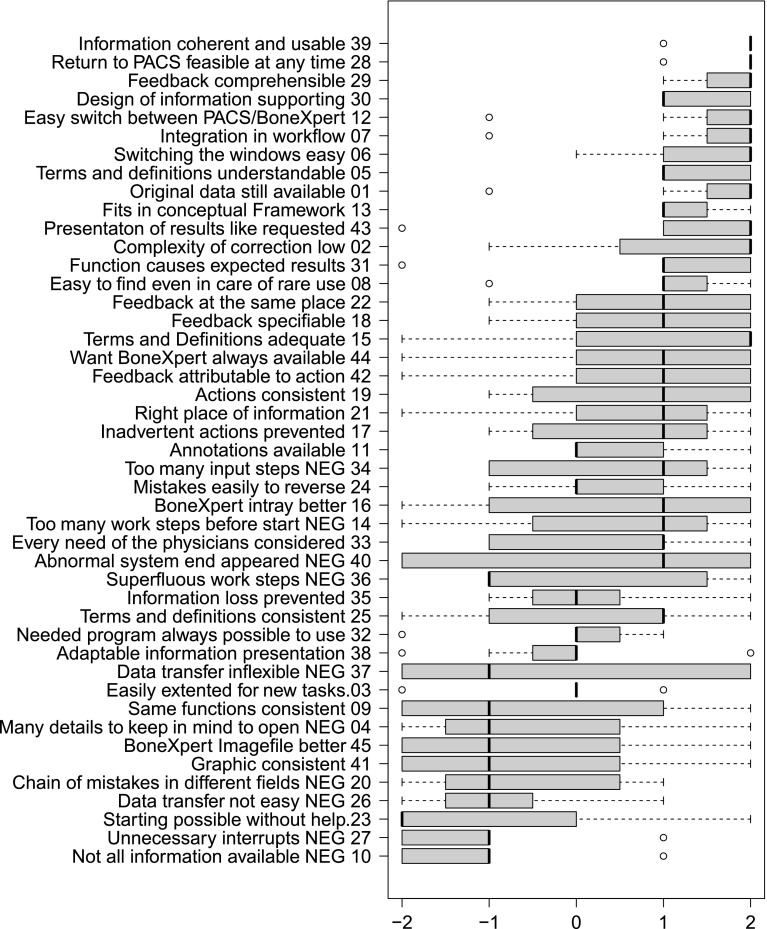
Figure 7 gives an overview of the answered items of the questionnaire. As stated in the methods section above, the items were ordered by the mean values of the Likert-scale, which yielded a ranking ranging from positive aspects of BoneXpert to severe usability problems.
Fig. 7.
Answers to the questionnaire: The x-axis corresponds to the scale of the items (−2 “completely disagree” to 2 “completely agree”). The boxplots show the median, lower/upper quartiles, maximal values, and minimal values. The items of the questionnaire were ordered by their mean values; the original position is given by the numbers at the end of the labels. In case of negatively formulated items (indicated by “NEG”), results were inverted
As can be seen from the boxplots, the participants saw no problems in understanding the terminology, results and feedback used/produced by BoneXpert and had no problems integrating the CAD module in their workflow (items 39, 29, 30, 07, 05, 13). They appreciated the practically unhampered access to the PACS (items 28, 12, 06) and the constant availability of the original patient data and radiographs (item 01). The results produced met the expectations of the radiologists (items 43, 31) and the necessary functions could be found when needed, even in the case of rare use (item 08).
The other end of the spectrum indicates some severe usability problems: Not all necessary information was available (item 10); there were unnecessary interrupts of the workflow induced by the program and problems with the data transfer between PACS and BoneXpert (items 26 and 27). The graphical output produced by the program and the effects of using the same function were rated as partly inconsistent (item 41). The participants could not intuitively start working without help (item 23) and the program increased the cognitive load (item 04). Finally, errors could be propagated through the workflow and lead to unexpected errors in different areas (item 20).
As far as data integration is concerned, there were some positive results, e.g., item 13, stating that the program fits in its conceptual framework, but most of the items yielded no clear decision of the participants against or in favor of the respective statement. The same holds for the other three categories functional integration, presentation integration, and visual integration.
Item 16 explicitly addressed the preference of the user according to the type of integration offered by the two different BoneXpert modules. Item 45 repeated this issue, but here with inverted meaning, confirming the finding that there was a slight preference for the BoneXpert Intray module (Table 3).
Table 2.
Code system derived from the user comments during the thinking-aloud session
| Code category | Aspect addressed | Support |
|---|---|---|
| Error messages | Complete system failure | 1 |
| Error concerning user authorization | 2 | |
| Unexpected script error | 7 | |
| Direct analysis | Problems concerning localization of BoneXpert-Pluging working directory | 16 |
| Problems concerning the DICOM-List | 14 | |
| Image handling | Necessity of image alignment (rotation) | 1 |
| Use of BoneXpert Intray | 10 | |
| Handling of BoneXpert Imagefile | 7 | |
| Unspecified | 2 | |
| BoneXpert | Problems concerning maximization of program window | 1 |
| Problems concerning internet connection | 1 | |
| Unexpected zooming effect | 1 | |
| User instruction | 1 | |
| General feedback on BoneXpert | 9 | |
| Insufficient visibility of the image | 1 | |
| Unclear cause of uncertainty | 10 | |
| Meaning/localization of buttons | 14 | |
| Readability of BoneXpert output | 7 | |
| Program termination (BoneXpert remains open) | 1 | |
| Comparison | BoneXpert first, then book | 1 |
| Book first, the BoneXpert | 2 | |
| Method | Method of bone age determination used by BoneXpert | 2 |
Column “Code category” contains a general classification of the codes; “Aspect addressed” contains the primary codes characterizing the original user statements; “Support” contains the number of user statements assigned to the respective code
Discussion
During the test sessions, the probands expressed several times the wish for a direct analysis, which means, when they execute BoneXpert, it shall analyze the bone age of the selected hand radiograph directly. Contrarily, both versions of CAD-PACS integration necessitate to load/select the files form folders or intray lists, and click the “analyze” button repeatedly. A version of integration without visualization of BoneXpert result window, which just expends the bone age, would solve this problem. This solution also would avoid the problems with the file directory tree and the data sheet of DICOM files.
All in all, the results of the questionnaire support this important result of the qualitative data analysis: CAD should be technically integrated into the PACS/clinical workplace as seamlessly as possible (see, e.g., the items concerning superfluous work steps, difficult data transfer, and unnecessary interrupts) without visualization of intermediate processing steps. Thus, the recommended version of BoneXpert’s integration is a version without visualization and suggested fewer clicks, disregarding the differences between the Plugin and the Intray methods. The failure indications show which errors are to eliminate before a complete version should be provided. However, a clear preference for one of the both variants of integration was not identified.
According to this final finding, a third integration variant of BoneXpert has been developed in the meantime allowing the automatic processing or radiographs in batch mode without displaying the intermediate processing result. This will foster applicability and acceptance for clinical routine.
We placed the study in a strictly realistic clinical context, which we regard as a major strength of the experimental setup. The participants had to perform routine tasks in a routine setting and the findings of the study are, therefore, likely to apply to similar real world situations. Of cause, it is not justified to generalize the results to different types of radiological diagnostics without considering possible similarities of the radiologist’s workflow.
Furthermore, all participants had more than 1 year of experience in the special field of pediatric radiology and roughly the same level of expertise concerning bone age assessment. It has been previously observed and reported that the level of clinical expertise alters the diagnostic process and the related pattern of examination [36, 37]. While being closely linked to the diagnostic workflow, usability problems may occur only on a special level of expertise. The participants of this study can be assumed to have homogenously reached an intermediate to high level of expertise in the investigated field. Thus, the findings are not likely to apply to other levels of expertise and almost certainly not to novices.
As an additional aspect associated with the examination patterns reported in the literature [36, 37], the future design of CAD needs to improve usability by observing and then taking into account special workflow or examination patterns in order to align the radiologist’s workflow and the CAD services offered.
Future CAD applications can be expected to increasingly adopt web-based technology, which facilitates the dissemination and maintenance of the respective CAD functions. Data and functional integration could be based on Web Service technology (e.g., using the Simple Object Access Protocol). Nonetheless, while representing rather a design decision than a technological problem, the general alternative between “black box” integration and the transparent visualization of intermediate steps will not disappear by applying these new technologies.
The different handling of emerging problems depends on the massive differences in the participant’s computer experience. Difficulties with basic computer skills in health care professionals are mentioned earlier and a problem, to be reckoned with by programmers [5]. The user-specific methods of using BoneXpert are really different because some test persons first watch BoneXpert’s result and then verify it, which actually saves time in some determinations of bone age, and the other watch BoneXpert’s result after analyzing themselves. In no case, the latter mentioned have modified their own performance if the results disaccorded.
With respect to the mixed-methods approach of the usability study, it can be stated that the results of the questionnaire and those of the qualitative text analysis are consistent. Due to the small number of participants, the quantitative data can just be used to analyze some errors and not without fail the gravest mistakes or most annoying ones, while the free text questions only partially compensate this. The qualitative analysis of the think-aloud records gives detailed information about special problems, and the results are expedient and precise. In combination with notes taken during the test session from the interviewer, it can detect all grave errors and the most important disaffections of the end users despite a low number of test sessions [38].
Limitations
While the number of seven participants perfectly fits into the range recommended for (formative) usability studies, it is clearly too small for carrying out statistical tests. Thus, quantitative data analysis had to be restricted to descriptive statistics only and, therefore, could not produce statistical significance.
In one case, the test session was disturbed by abnormal program termination. The situation was not reproducible. The error messages were recorded and annotated with the type of integration for detailed technical analysis. It turned out that program termination was a singular event and could not be explained by the different variants of system integration: It never reappeared in other test cases during the study, and no other participant experienced a similar event. Facing various possible explanations for the program termination ranging from hardware problems to failures of the operation system—all independent from the CAD application and details of the CAD-PACS integration—the event was excluded from the analysis.
Conclusion
A user-centered evaluation study was performed comparing two variants of CAD-PACS integration. The study design combines the think-aloud method with a structured questionnaire designed to analyze the four levels of integration, data, function, presentation, and context. The systematic design supports generalization.
We conclude that visualization of image processing intermediate results, which aims at providing transparency and trust to the physicians, may significantly hamper the workflow and is considered less important for routine integration of medical image processing software into a PACS environment.
This may indicate a paradigm shift for medical image analysis. Ten years ago, visualizing the steps of image processing have been assumed superior to the black box model and making automated computation of images needed to be made transparent to the physicians for trusting them [38, 39, 40]. Nowadays, since performance evaluation of medical image processing is focused on physicians with vs. physicians without supporting software, rather than physician vs. the software [41], the “black box” model of medical image processing may become in the focus again [42].
Acknowledgment
This work has been supported in part by the German Research Foundation (Deutsche Forschungsgemeinschaft DFG), grant no: Le 1008/9. We would like to thank Jonas Apitzsch, Philipp Bruners, Christoph Grouls, Peter Isfort, Edith Mulders, Tobias Penzkofer, and Cedric Plumhans for participating in the user study.
Contributor Information
Ina Geldermann, Email: ina.geldermann@rwth-aachen.de.
Christoph Grouls, Email: cgrouls@ukaachen.de.
Christiane Kuhl, Email: ckuhl@ukaachen.de.
Thomas M. Deserno, Phone: +49-241-8088793, FAX: +49-241-803388793, Email: deserno@ieee.org
Cord Spreckelsen, Email: cord.spreckelsen@rwth-aachen.de.
References
- 1.Clarke JR. Appendicitis: the computer as a diagnostic tool. Int J Technol Assess Health Care. 2009;5:371. doi: 10.1017/S0266462300007431. [DOI] [PubMed] [Google Scholar]
- 2.Andriole KP, Morin RL, Arenson RL, Carrino JA, Erickson BJ, Horii SC, et al. Addressing the coming radiology crisis—the Society for Computer Applications in Radiology transforming the radiological interpretation process (TRIP) initiative. J Digit Imaging. 2004;17:235–243. doi: 10.1007/s10278-004-1027-1. [DOI] [PMC free article] [PubMed] [Google Scholar]
- 3.Zhou Z, Liu BJ, Le AH. CAD-PACS integration tool kit based on DICOM secondary capture, structured report and IHE workflow profiles. Comput Med Imaging Graph. 2007;31:346–352. doi: 10.1016/j.compmedimag.2007.02.015. [DOI] [PubMed] [Google Scholar]
- 4.Doi K. Computer-aided diagnosis in medical imaging: historical review, current status and future potential. Comput Med Imaging Graph. 2007;31:198–211. doi: 10.1016/j.compmedimag.2007.02.002. [DOI] [PMC free article] [PubMed] [Google Scholar]
- 5.Antani S, Xue Z, Long LR, Bennett D, Ward S, Thoma GR. Is there a need for biomedical CBIR systems in clinical practice? Outcomes from a usability study. Proc SPIE. 2011;7967:8. [Google Scholar]
- 6.Bitter I, Van Uitert R, Wolf I, Ibanez L, Kuhnigk J-M. Comparison of four freely available frameworks for image processing and visualization that use ITK. IEEE Trans Vis Comput Graph. 2007;13:483–493. doi: 10.1109/TVCG.2007.1001. [DOI] [PubMed] [Google Scholar]
- 7.Mayring P: Einführung in die qualitative Sozialforschung: Eine Anleitung zu qualitativem Denken. ed 5. Weinheim, Beltz Verlag, 2002.
- 8.Thodberg H: www.bonexpert.com. Available from: http://www.bonexpert.com/index.php. Accessed 21 Aug 2012
- 9.Gilsanz V, Ratib O. Hand Bone Age. A Digital Atlas of Skeletal Maturity. Berlin: Springer; 2005. [Google Scholar]
- 10.Thodberg HH. Clinical review: an automated method for determination of bone age. J Clin Endocrinol Metab. 2009;94:2239–2244. doi: 10.1210/jc.2008-2474. [DOI] [PubMed] [Google Scholar]
- 11.Schmeling A, Lockemann U, Olze A, Reisinger W, Fuhrmann A, Püschel K, Geserick G: Forensische Altersdiagnostik bei Jugendlichen und jungen Erwachsenen. Dtsch Arztebl 101(18=: A 1261–1265, 2004
- 12.Schmitt R, Lanz U. Diagnostic Imaging of the Hand. Stuttgart: Thieme; 2008. [Google Scholar]
- 13.Greulich WW, Pyle SI. Radiographic Atlas of Skeletal Development of the Hand and Wrist. 2. Stanford: Stanford University Press; 1961. [Google Scholar]
- 14.Tanner JM, Whitehouse RH, Cameron N, Marshall WA, Healy MJR, Goldstein H. Assessment of Skeletal Maturity and Prediction of Adult Height (TW2 method) London: Academic; 1975. [Google Scholar]
- 15.Pietka E, Gertych A, Pospiech S, Cao F, Huang HK, Gilsanz V. Computer-assisted bone age assessment: image preprocessing and epiphyseal/metaphyseal ROI extraction. IEEE Trans Med Imaging. 2001;20:715–729. doi: 10.1109/42.938240. [DOI] [PubMed] [Google Scholar]
- 16.Gertych A, Zhang A, Sayre J, Pospiech-Kurkowska S, Huang HK. Bone age assessment of children using a digital hand atlas. Comput Med Imaging Graph. 2007;31:322–331. doi: 10.1016/j.compmedimag.2007.02.012. [DOI] [PMC free article] [PubMed] [Google Scholar]
- 17.Harmsen M, Fischer B, Schramm H, Seidl T, Deserno TM: Support vector machine classification based on correlation prototypes applied to bone age assessment. IEEE Trans Inf Technol Biomed, 2013. doi:10.1109/TITB.2012.2228211 [DOI] [PubMed]
- 18.Zhang YJ: A review of recent evaluation methods for image segmentation. Proceedings of the Sixth International Symposium on Signal Processing and Its Applications. IEEE, Kuala Lumpur, Malaysia, 2001, pp 148–151.
- 19.Nielsen J: Response Time Limits. http://www.useit.com/papers/responsetime.html. Accessed cited 21Aug 2012
- 20.Mueller H: Efficient Access Methods for Content-Based Image Retrieval with Inverted Files. Proc SPIE 3846:461–472, 1999.
- 21.Abe H, MacMahon H, Engelmann R, Li Q, Shiraishi J, Katsuragawa S, et al. Computer-aided diagnosis in chest radiography: results of large-scale observer tests at the 1996–2001 RSNA scientific assemblies. Radiographics. 2003;23:255–265. doi: 10.1148/rg.231025129. [DOI] [PubMed] [Google Scholar]
- 22.Shah SGS. Robinson I: Benefits of and barriers to involving users in medical device technology development and evaluation. Int J Technol Assess Health Care. 2007;23(1):131–137. doi: 10.1017/S0266462307051677. [DOI] [PubMed] [Google Scholar]
- 23.Shah SGS, Robinson I, AlShawi S. Developing medical device technologies from users’ perspectives: a theoretical framework for involving users in the development process. Int J Technol Assess Health Care. 2009;25:514. doi: 10.1017/S0266462309990328. [DOI] [PubMed] [Google Scholar]
- 24.Jaspers MWM. A comparison of usability methods for testing interactive health technologies: methodological aspects and empirical evidence. Int J Med Inform. 2009;78:340–353. doi: 10.1016/j.ijmedinf.2008.10.002. [DOI] [PubMed] [Google Scholar]
- 25.Raab-Steiner E, Benesch M. Der Fragebogen?: Von der Forschungsidee zur SPSS-Auswertung. UTB: Wien; 2008. [Google Scholar]
- 26.Friedmann HH, Amoo T: Rating the rating scales. J Mark Manage 9:114–123, 1999
- 27.Färber M, Hummel F, Gerloff C, Handels H. Virtual reality simulator for the training of lumbar punctures. Methods Inf Med. 2009;48:493–501. doi: 10.3414/ME0566. [DOI] [PubMed] [Google Scholar]
- 28.Lewis JR. IBM computer usability satisfaction questionnaires: psychometric evaluation and instructions for use. Int J Hum Comput Interact. 1995;7:57–78. doi: 10.1080/10447319509526110. [DOI] [Google Scholar]
- 29.Willumeit H, Hamborg K, Gedinga G: Fragebogen zur Evaluation von graphischen Benutzungsschnittstellen (Kurz-Version), Version 2.01, 1997.
- 30.Prümper J: Fragebogen ISONORM. http://www.ergo-online.de/site.aspx?url=html/software/verfahren_zur_beurteilung_der/fragebogen_isonorm_online.htm. Accessed 21 Aug 2012
- 31.Gediga G, Hamborg K-C. IsoMetrics: Ein Verfahren zur Evaluation von Software nach ISO 9241/10. In: Hollingm H, Gediga G, editors. Evaluationsforschung. Göttingen: Hogrefe; 1999. [Google Scholar]
- 32.Kirakowski J, Corbett M. SUMI: the Software Usability Measurement Inventory. Br J Educ Technol. 1993;24:210–212. doi: 10.1111/j.1467-8535.1993.tb00076.x. [DOI] [Google Scholar]
- 33.Nielsen J, Landauer TK: A mathematical model of the finding of usability problems. New York: ACM Press, 1993, 206–213.
- 34.Lehmann TM. Digitale Bildverarbeitung für Routineanwendungen?: Evaluierung und Integration am Beispiel der Medizin. Wiesbaden: Dt. Univ.-Verl; 2005. [Google Scholar]
- 35.Flick U: Qualitative Sozialforschung: eine Einführung. Reinbek bei Hamburg, Rowohlt-Taschenbuch-Verl., 2007.
- 36.Crowley RS, Naus GJ, Stewart J, 3rd, Friedman CP. Development of visual diagnostic expertise in pathology—an information-processing study. J Am Med Inform Assoc. 2003;10:39–51. doi: 10.1197/jamia.M1123. [DOI] [PMC free article] [PubMed] [Google Scholar]
- 37.Roa-Peña L, Gómez F, Romero E. An experimental study of pathologist’s navigation patterns in virtual microscopy. Diagn Pathol. 2010;5:71. doi: 10.1186/1746-1596-5-71. [DOI] [PMC free article] [PubMed] [Google Scholar]
- 38.Britto MT, Jimison HB, Munafo JK, Wissman J, Rogers ML, Hersh W. Usability testing finds problems for novice users of pediatric portals. J Am Med Inform Assoc. 2009;16:660–669. doi: 10.1197/jamia.M3154. [DOI] [PMC free article] [PubMed] [Google Scholar]
- 39.Gee JC: Performance evaluation of medical image processing algorithms. SPIE 3979:19–27, 2000
- 40.Lehmann TM, Meinzer HP, Tolxdorff T. Advances in biomedical image analysis—past, present and future challenges. Methods Inf Med. 2004;43:308–314. [PubMed] [Google Scholar]
- 41.Bellazzi R, Diomidous M, Sarkar IN, Takabayashi K, Ziegler A, McCray AT. Data analysis and data mining: current issues in biomedical informatics. Methods Inf Med. 2011;50:536–544. doi: 10.3414/ME11-06-0002. [DOI] [PMC free article] [PubMed] [Google Scholar]
- 42.Mitchell JA, Gerdin U, Lindberg DAB, Lovis C, Martin-Sanchez FJ, Miller RA, et al. 50 years of informatics research on decision support: what’s next. Methods Inf Med. 2011;50:525–535. doi: 10.3414/ME11-06-0004. [DOI] [PubMed] [Google Scholar]


