

Abstract
Diabetic maculopathy is one of the retinal abnormalities in which a diabetic patient suffers from severe vision loss due to the affected macula. It affects the central vision of the person and causes blindness in severe cases. In this article, we propose an automated medical system for the grading of diabetic maculopathy that will assist the ophthalmologists in early detection of the disease. The proposed system extracts the macula from digital retinal image using the vascular structure and optic disc location. It creates a binary map for possible exudate regions using filter banks and formulates a detailed feature vector for all regions. The system uses a Gaussian Mixture Model-based classifier to the retinal image in different stages of maculopathy by using the macula coordinates and exudate feature set. The evaluation of proposed system is performed by using publicly available standard retinal image databases. The results of our system have been compared with other methods in the literature in terms of sensitivity, specificity, positive predictive value and accuracy. Our system gives higher values as compared to others on the same databases which makes it suitable for an automated medical system for grading of diabetic maculopathy.
Keywords: Diabetic maculopathy, Exudates, Macula, Feature extraction, Gaussian mixture model
Introduction
One of the common diseases all over the world is diabetes in which the lack of insulin causes high blood sugar in humans. Long-term diabetes also affects the human retina resulting in a condition known as diabetic retinopathy (DR). This condition damages the retinal blood vessels causing them to leak which ultimately leads to blindness. The patients of different types of diabetes develop some form of retinopathy after 20 years of this chronic disease. DR of any stage develops in nearly all of the patients having diabetes of type 1 and about 60 % of the patients with diabetes of type 2 [1]. The percentage of diabetes patients is high in almost every region of the world especially in industrialized countries which makes a high chance of DR sufferers.
There are several stages of DR such as nonproliferative DR (NPDR), proliferative DR (PDR) and maculopathy or macular edema (ME). NPDR is known as background DR, whereas PDR and ME are the advance stages of DR [1]. Diabetic patient can have different signs of retinopathy such as microaneurysms, hard exudates, haemorrhage and cotton wool spots (CWS) at different stages of DR. Microaneurysms are weak dark red spots developed on blood vessels that bulge outward. They are the first detectable change in the retina due to diabetic retinopathy. Haemorrhage is usually round or oval in shape and formed by the rupture of microaneurysms. They are also dark red in colour and can be located within the mid-retina. Hard exudates and CWS are collectively known as exudates. Hard exudates are yellowish deposits of protein present in the retina. CWS are the soft exudates which are white and fluffy lesions. Diabetic maculopathy or ME is a condition in which the macula is surrounded by the exudates and a patient’s central vision is affected. Figure 1 shows the main component of human retina and also the exudates present on the surface of the retina.
Fig. 1.

Main components of the human retina along with exudates
Diabetic maculopathy occurs if exudates appear on or near the macula affecting central vision. The central portion of the retina which is usually darkest and rich in cones is called the macula (Fig. 1). The macula is accountable for the clear, sharp and detailed vision [1]. The center of the macula is called fovea which is responsible for very fine details in the image (Fig. 1). The significance of detecting the macula is that it is used for the early detection of various diseases. ME is one of the common sight-threatening conditions among diabetic patients in which the fluid rich in fat leaks out of damaged blood vessels and gets deposited near the macula and leads to distorted central vision. The human visual loss can be prevented by early screening and diagnosis of diabetic maculopathy. The two types of macular edema are non-clinically significant macular edema (non-CSME) and clinically significant macular edema (CSME). Non-CSME is a mild form of maculopathy in which there are no symptoms of the disease because the locations of exudates are at a distance from the fovea and the central vision is not affected. CSME is the severe form of maculopathy in which the exudates leak out and get deposited very close to or on the fovea affecting central vision of the eye [2]. Irrespective of diabetic retinopathy, long-term diabetic patients have chances of developing diabetic maculopathy. Figure 2 shows retinal images with different stages of maculopathy.
Fig. 2.

Stages of diabetic maculopathy: a healthy retinal image, b non-CSME retinal image, c CSME retinal image
This article consists of five sections. “Related Work” section explains the related work with respect to diabetic maculopathy. The proposed system and its complete explanation are given in the “Proposed Methodology” section. The “Experimental Results” section represents the standard retinal image databases which we have used to evaluate the proposed system. The experimental and comparative results of the proposed system using different evaluation parameters and databases are also elaborated in this section followed by discussion and conclusion in the last section.
Related Work
Automated detection of diabetic maculopathy is vital for the early cure of the disease. Maculopathy occurs when exudates appear near or on the macula, and detection of macula and exudates is important to construct an automated system for maculopathy. There are various computerized methods in the literature which are proposed for the detection of diabetic maculopathy.
Exudates are the basic cause of ME, and the first step in automated diagnosis of ME is the detection of exudates. Niemeijer et al. [3] proposed machine learning-based supervised algorithm for automated detection of exudates. KNN classifier was used for the training and testing of feature set of exudates. In [4], the top-down and bottom-up strategies for the detection of lesions are proposed. The improved Fuzzy C-Means along with SVM classifier were utilized by them for the detection of exudates. Acharya et al. [5] proposed a higher order spectra (HOS)-based method for the identification of exudates. Features are extracted through HOS which are then fed to SVM classifier. The next step in automated detection of maculopathy is to identify the location of the macula in retinal image to check the severity of the disease. In [6], the authors have proposed a method for fovea detection based on matching correlation together with typical fovea characteristics. This technique was tested on some local dataset, and the sensitivity and specificity were found to be 80.4 and 99.1 %, respectively. Tan et al. [7] proposed a macula detection technique by detecting a region in the retina having low pixel intensity. The algorithm makes use of the height of optic disc computed by ARGALI method to define ROI for macula. The algorithm has an accuracy of 98.8 %.
A number of complete systems for maculopathy detection are also been proposed by different authors. Shahawy et al. [8] proposed a method for segmentation of diabetic macular edema in fluorescein angiograms. The proposed method is based on modeling the macular image in early time frame using 2D Gaussian surfaces which is then subtracted from the late time frame image to enhance the macular edema regions. The resulting difference image is segmented using Gaussian Mixture Model (GMM) classification algorithm. The proposed method gives good results on local dataset. In [9], the diabetic macular edema is classified in which marker-controlled watershed transformation is used for exudates’ feature extraction. The exudates from the fundus image are extracted, and their location along with marked macular regions is utilized for the classification of macular edema into different stages. The method was tested on MESSIDOR database, and the sensitivity is found to be 80.9 % and specificity of 90.2 %. Deepak et al. [10] proposed a method for automatic assessment of macular edema using a supervised learning approach to capture the global characteristics in fundus images. Disease severity is assessed using a rotational asymmetry metric (motion pattern) by examining the symmetry of macular region. The method is tested on publicly available databases like diaretdb0, diaretdb1, MESSIDOR and DMED. The accuracy for the maculopathy detection is found to be 81 %. A method for classification of exudative maculopathy using FCM clustering and artificial neural networks is proposed in [11]. The authors have reported sensitivity of 92 % and specificity of 82 % on some local dataset. In [12], the automated system for grading of diabetic maculopathy is proposed. The macula is localized, and hard exudates are detected using clustering and mathematical morphological techniques. Based on the location of the exudates, the severity level of diabetic maculopathy is defined in a marked region of the macula in abnormal fundus image. The method is tested on local dataset, and the sensitivity and specificity were found to be 95.6 and 96.15 %, respectively.
Two major issues with most of the algorithms mentioned above are the appearance of false positive regions for exudates as well as for macula, and secondly, most of them have used a few retinal images to evaluate their system. In this article, we present a system to overcome both of these issues to improve the overall accuracy of system for a large number of retinal images. The proposed system is novel in a sense that it uses a new method for candidate exudate detection for identification of diabetic maculopathy. Our proposed system for grading of diabetic maculopathy comprises of several stages. First, the preprocessing of fundus image is required to eliminate the noise and to remove background from the fundus image. The system then extracts macula and candidate exudate regions using vascular structure and filter bank, respectively. A Bayesian decision-based GMM classifier is used for detection of maculopathy which grades the input retina image using macular coordinates and feature vector for each exudate region. We perform a thorough evaluation of the proposed system using two standard retinal image databases using different performance evaluation parameters.
Proposed Methodology
Automated screening of human retina and detection of early signs can save patients’ vision so it is important to develop CAD systems for retinal diseases. In this article, we present a complete system for grading of maculopathy to save sudden vision loss. The proposed system consists of preprocessing, macula and exudates detection, feature extraction and finally grading of maculopathy using a GMM-based classifier. The algorithms improve the quality of automated system by eliminating blood vessels and optic disc pixels to ensure the reduction in false positives and a detailed feature set for accurate detection of exudates. Figure 3 shows the complete flow diagram of our system starting from input retinal image to its final grading.
Fig. 3.

Flow diagram of our proposed system
Preprocessing
The acquired retinal image contains extra background pixels especially in the case of MESSIDOR images which are not required for further processing and add more time in overall processing. The purpose of preprocessing is to remove the background by differentiating between background and foreground pixels. Once the background is detected, the smallest window containing the foreground pixels is retained by eliminating all other unnecessary pixels. A mean and variance-based segmentation method for background estimation, and ratio of Hue and Intensity channel for noise detection are used in preprocessing. The details of these methods are given in [13].
Candidate Exudates’ Detection
Exudates are the bright lesions which appear on the surface of the retina if the leaking blood contains fats and proteins along with water. Their occurrence is a main threat to vision especially when they occur near or on the macula. The presence of optic disc (OD) makes it difficult for an automated system to detect exudates with high accuracy. The proposed system detects and removes OD pixels for accurate detection of exudates. The following steps are used for candidate exudate detection:
Take preprocessed image as an input and apply morphological closing to remove the effect of blood vessels and dark lesions. A circular structuring element with radius of 9 pixels is used for morphological closing.
-
Apply adaptive contrast enhancement technique to improve the contrast of exudates on retinal surface by using a w x w sliding window with assumption that w is large enough to contain a statistical representative distribution of the local variation of exudates [14].
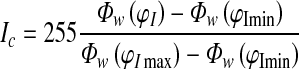
1 Where I is the output of the first step and Φw is an exponential sigmoid function of a window size. φImax and φImin are maximum and minimum intensity values of closed green channel image, respectively
-
Create filter bank using Gabor-based kernel given in Eq. 2
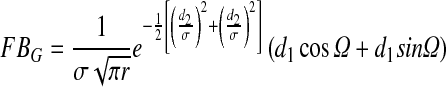
2 Where σ, Ώ and r are the standard deviations of Gaussian, spatial frequency and aspect ratio, respectively. θ is the orientation of filter and d1 = xcosθ + ysinθ and d2 = −xsinθ + ycosθ [14]. Gabor kernel-based filter bank is used here as it can be modeled to represent a wide range of shapes by changing its parameters. Here, we have used σ = 2 and 5 against four different orientations which are π/4, π/2, 3π/4 and π to generate eight different Gabor-based filters. These eight filters are then convolved with contrast enhanced image using Eq. 3 to get response of each filter. Each response is added, and finally, the maximum response value for each pixel is saved to get enhanced bright regions from retinal image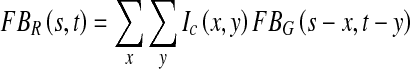
3 Create a binary map containing candidate exudates’ region by applying adaptive threshold value T which is calculated using OTSU algorithm [15].
Detect OD using averaging and Hough transform given in [16] and remove all OD pixels from binary map.
Macula Detection
Macula detection is an important module for developing the computerized system for the grading of diabetic maculopathy. It is the macular area of the eye that is affected in diabetic maculopathy upsetting the central vision of the eye and in severe cases leading to blindness. The technique which we have used for macula detection is described in [17]. In this technique, the macula is first localized with the help of localized OD and enhanced blood vessels [18]. Finally, the macula is detected by taking the distance from the center of optic disk along with enhanced blood vessels image to locate the darkest pixel in this region, and making clusters of these pixels. The largest cluster formed is the macula [17]. Figure 4 shows the outputs of different modules, i.e. preprocessing, exudates and macula detection.
Fig. 4.

a Original retinal image, b preprocessing mask, c OD detection, d filter bank response, e binary map for exudates, f macula detection
Feature Extraction
The candidate exudate region detection phase extracts as many possible regions as it can for possible exudates. The threshold value is deliberately kept low so that not a single pixel containing exudate will be missed at that stage. We remove the spurious pixels or non-exudate regions in classification stage. Exudates appear as bright yellow spots with variable size and shape, but they have strong and sharp edges. If a retinal image χ contains k potential candidate regions, then the set representation for an image χ is χ = {v1, v2, v3,…..vk}. For an automated system to distinguish between exudate and non-exudate regions, a feature set is formed for each candidate region. Each object or candidate exudate region is considered as a sample for classification and represented by a feature vector containing m features, i.e. for a sample candidate region v from an image χ, the feature vector is v = {f1, f2, f3,…..fm}. The description of features we used for classification of exudate and no exudate regions is as following:
Area (f1) is the count of number of pixels in candidate exudate region and defined as the sum of all pixels in candidate region.
Compactness (f2) is measure of shape defined as C = p2/(4πA), where p and A are the perimeter length and area of candidate region, respectively.
Mean intensity (f3) is the mean intensity value of contrast enhanced green channel for all pixels within the candidate region.
Mean hue (f4), mean saturation (f5) and mean value (f6) for each candidate region are calculated in order to differentiate exudate and non-exudate regions on the basis of their colour properties.
Mean gradient magnitude (f7) for edge pixels is computed to differentiate between strong and blur edges.
Entropy (f8) value of all pixels in square region including candidate region pixels and its neighbouring pixels.
Energy (f9) is calculated by summing the intensity values of all pixels within the candidate region and dividing it by the total number of candidate region pixels.
Third moment (f10) value of all pixels in square region including candidate region pixels and its neighbouring pixels. It is the measure of skewness.
Gaussian Mixture Model
In candidate lesion detection, the threshold value for lesion segmentation was deliberately kept low to ensure that as many lesions as possible would be detected. The spurious candidates will be removed in classification. In order to classify candidate region as exudate and non-exudate region, we use a Bayesian classifier using Gaussian functions known as Gaussian Mixture Model (GMM) [19]. The reason for choosing GMM-based classifier is that the feature space is not really linearly separable which makes the use of neural network or SVM-based classifier less suitable. GMM gives us good results as it bases on the distribution of data and does not try to find actual decision boundary.
We define two classes such as R1 = (exudate region) and R2 = (non-exudate region). A supervised classification method is used for final classification by dividing the dataset into training and testing subsets randomly. The classifier is trained using the training dataset with labeled lesions, and we used Bayes decision rule to obtain a decision rule based on estimates from the training set. Bayes decision rule is stated as [20].
 |
4 |
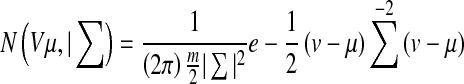
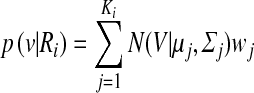
Where p(v|Ri) is the class conditional Probability Density Function (pdf) also known as likelihood, and P(Ri) is the prior probability of class Ri which is calculated as the ratio of class Ri samples in the training set. The class conditional pdf of the feature vector for different classes is computed using multivariate Gaussian pdf [20]
 |
5 |
where v and μ are feature vectors containing m number of features and mean vector containing mean of each feature, respectively. Σ is a m × m covariance matrix. In our case, m = 10. We model the class conditional pdfs as linear combination of weighted Gaussian functions to represent the likelihood of a GMM using Eq. 4.
 |
6 |
where ĸi is the number of Gaussian mixtures used for Bayesian classification, and p(v|Ri) is an m-dimensional Gaussian distribution of weight ωj and Ri = (R1, R2) are the two classes used in proposed system. Equations 3 and 4 show the likelihoods for a single Gaussian distribution and GMM, respectively.
GMM is normally characterized as a classifier having a halfway between purely nonparametric and parametric models. It provides a fast testing at the cost of a more expensive training phase. Although nonparametric techniques do not enforce any constraints on underlying data, still they are complex in computations. On the other hand, GMM guarantees a fast testing stage independent of number of training samples and depends only on the chosen value of ĸ.
We apply Expectation Maximization (EM) to search for an optimal value of ĸ which optimizes the accuracy of GMM using different validation sets randomly extracted from classified training data. The EM is an iterative method which chooses the optimal value of ĸ by finding the local maximum value of GMM pdf for training data. EM finds such value of ĸ for which mixture of ĸ-weighted Gaussians can represent the data accurately. The proposed system uses EM with supervised learning in which we use a priori knowledge to guide the training process. This supervised estimation has a benefit over unsupervised as in unsupervised, EM expects the availability of a large number of data to estimate the parameters. EM learning for GMM includes learning of mixture weights ω and parameters for different values of ĸ. It consists of two steps, i.e. estimation and maximization. In the first step, EM estimates the probability of each point that which Gaussian has generated it, and in the second step, it modifies the parameters to maximize the likelihood of data.
Once the classifier has detected all exudates and macula, the system will grade the input image as healthy, non-CSME and CSME based on the location and distance between the macula and exudates if present in retinal image. Table 1 shows the three conditions which have been used to grade the input image into different stages of maculopathy.
Table 1.
Conditions for grading of diabetic maculopathy
| Grade | Condition | Class |
|---|---|---|
| 0 | No exudate present | Healthy |
| 1 | A few exudates present and distance between macula and exudates >one papilla diameter | Non-CSME |
| 2 | Exudates present and distance between macula and exudates ≤one papilla diameter | CSME |
Experimental Results
Material
In order to evaluate algorithms for automated screening and diagnosis of DR, some of benchmark databases are publicly available. The purposes of these databases are to check the validity of automatic screening of DR and to compare the results with existing techniques. We have used two standard retinal image databases here, i.e. MESSIDOR [21] and STARE [22].
MESSIDOR database has been established to facilitate computer-aided DR lesion detection especially to grade ME. The database is collected using TopCon TRC NW6 Non-Mydriatic fundus camera with 45° field of view (FOV) and resolutions of 1,440 × 960, 2,240 × 1,488 or 2,304 × 1,536 with 8 bits per colour plane. It contains a total of 1,200 images which are divided into three sets of 400 images, and each set is further divided into four parts to facilitate thorough testing. Each set contains an Excel file with medical findings which can be used for testing purposes. One of the oldest and mostly used retinal image databases is the STARE dataset which was designed for structured analysis of retina [22]. There are a total of 81 retinal images which are acquired using TopCon TRV 50 retinal camera with 35° FOV out of which 30 are from healthy retinal and the remaining 50 contain different lesions related to DR. The dataset was firstly used by Hoover et al. to validate their algorithms and to report their quantitative results. The database contains RBG images with 8 bit per channel and of size 700 × 605. Figure 5 shows several retinal images taken randomly from these two databases.
Fig. 5.

Rows 1 and 2 contain different retinal images from STARE and MESSIDOR databases, respectively
Results
The evaluation of automated medical systems is very important and should be done carefully. We have used two standard retinal image databases as mentioned earlier for thorough evaluation and validity of the proposed system. A total of 1,281 retinal images with different resolution, lesions and with a lot of variations are used. Figures 6 and 7 show the pictorial results of the proposed system for randomly chosen images from STARE and MESSIDOR databases. Figure 6 shows highlighted exudates present on the surface of the retina along with a marked macular region for different retinal images. Figure 7 shows different retinal images classified as healthy, non-CSME and CSME by the classifier.
Fig. 6.

Exudates and macula detection: first row, images with highlighted exudates; second row, image with marked macula
Fig. 7.

Maculopathy detection. First row, healthy retinal images; second row, non-CSME or grade 1 images; third row, CSME or grade 2 images
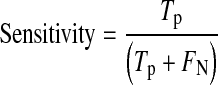
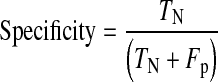
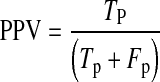
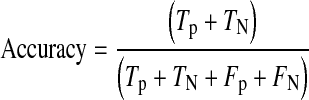
For detailed statistical evaluation, the performance of proposed system is measured using sensitivity, specificity, positive predictive value (PPV) and accuracy as figures of merit. Sensitivity is true positive rate and specificity is true negative rate. These parameters are calculated using Eqs. 7, 8, 9 and 10, respectively.
 |
7 |
 |
8 |
 |
9 |
 |
10 |
Where
Tp are true positives means exudate regions correctly classified.
TN are true negatives means nonexudate regions correctly classified.
Fp are false positives means non-exudate regions wrongly classified as exudate regions.
FN are false negatives means exudate regions wrongly classified as non-exudate regions.
Table 2 shows the comparison of our proposed system with existing methods in the literature for exudate detection in terms of sensitivity, specificity and accuracy. The results show that our proposed method achieved high values of sensitivity, specificity and accuracy as compared to other methods using MESSIDOR and STARE databases. This improvement especially in terms of PPV is supported by accurate lesion detection stage and causing lower number of false positives due to removal of spurious regions especially OD pixels. Another reason for the improvement is the use of detailed feature set and classifier for the detection of exudates which was not used by the above-mentioned authors. The macula detection phase in the proposed system extracted the macular region correctly in 1,164 images out of a total of 1,200 images and in 79 images out of 81 for MESSIDOR and STARE databases, respectively. It achieved an accuracy of 97.53 % as compared to Sagar et al. [23] and Lu et al. [24] who previously achieved 96 and 95.4 %, respectively, for STARE database.
Table 2.
Performance comparison of proposed system with existing systems for exudate detection
| Method | Sensitivity (%) | Specificity (%) | PPV (%) | Accuracy (%) |
|---|---|---|---|---|
| Sinthanayothin et al. [6] | 88.5 | 99.7 | – | – |
| Walter et al. [28] | 92.74 | 100 | 92.39 | – |
| Ahmed et al. [26] | 94.90 | 100 | 92.01 | – |
| Osareh et al. [29] | 93 | 94.1 | – | 93.4 |
| Haniza et al. [27] | 94.25 | 99.2 | 78.65 | – |
| Akram et al. [30] | – | – | – | 94.73 |
| Proposed Method | 97.06 | 98.55 | 97.65 | 97.83 |
The variation in the accuracy of the system is highlighted with the help of receiver operating characteristics (ROC) curve which shows a relation between true positive rate (sensitivity) and false positive rate (1-specificity). Figure 8 shows ROC curves for grading of maculopathy using MESSIDOR and STARE databases. The system achieves 0.96076 and 0.97633 as area under the ROC curves for MESSIDOR and STARE databases, respectively. The variations in image resolution are more in MESSIDOR as compared to STARE causing a bit lower accuracy for MESSIDOR database.
Fig. 8.

ROC curves for proposed system using STARE and MESSIDOR databases
The comparison of complete system for grading of maculopathy is given in Table 3. The validity of our system is clearly highlighted here even with a use of large number of images. Some other methods given in [12, 25] and [11] have reported sensitivity values of 95.6, 95 and 92 %, respectively, but they have used locally gathered retinal images for testing purposes.
Table 3.
Comparison of our proposed method with existing techniques for grading of maculopathy
| Author | Technique | Database | Sensitivity (%) | Specificity (%) | Accuracy (%) |
|---|---|---|---|---|---|
| Lim et al. [9] | Marker controlled watershed transform | MESSIDOR | 80.9 | 90.2 | – |
| Deepak et al. [10] | Rotational asymmetric motion pattern | MESSIDOR | 95 | 90 | – |
| DMED | 100 | 74 | |||
| Aquino et al. [31] | Image processing | MESSIDOR | – | – | 96.51 |
| Proposed method | Filter bank and GMM | MESSIDOR | 95.6 | 98.2 | 97.3 |
| STARE | 97.2 | 98.32 | 97.89 |
Conclusion
Diabetic maculopathy is an advance level of retinal abnormalities which may be present in diabetes sufferers. This may cause total blindness if not detected and treated in time. In this article, we presented a computerized medical system for automated screening of diabetic maculopathy. The proposed system performed retinal image analysis for grading of maculopathy using GMM-based classifier. Our proposed system consisted of preprocessing, exudates region detection followed by macula detection. The exudate detection stage created a binary map of candidate regions using a filter bank. A detailed feature set based on properties of exudates is created for each candidate region. The GMM classifier first detected true exudate regions based on feature set, and then using coordinates of macula and the distance of exudates from macula, the classifier graded the input image into three categories, i.e. healthy, non-CSME and CSME.
The evaluation of the proposed system is done using two standard retinal image databases, i.e. MESSIDOR and STARE. The STARE database has been used by a number of authors to represent the performance of exudate detection, and our system has achieved a higher value of 95.56 % for PPV as compared to 79 and 83.3 % which were achieved by Ahmed et al. [26] and Haniza et al. [27], respectively. The proposed system has detected the exudate and macula with accuracies of 97.83 and 97.36 %, respectively, and achieved an accuracy of 97.6 % for grading of maculopathy.
The performance of our system is improved as compared to previously published methods due to our emphasis on every stage of system for example the removal of OD pixels to reduce the number of false regions, accurate blood vessel extraction prior to macula detection, use of sound feature set with the help of good descriptors and finally a reliable GMM-based classifier. We have also tried SVM for classification, but it gave us low accuracy of 94.37 % as compared to 97.38 % of GMM. The efficiency of proposed system can be improved further by using a more accurate method for macula detection which we have left here as our future work. Still, the results have demonstrated that the proposed system can be used in an automated medical system for grading of diabetic maculopathy.
Acknowledgments
Conflict of Interest
The authors declare that they have no conflict of interest.
Contributor Information
Anam Tariq, Phone: +92-333-6913921, FAX: +92-512-304729, Email: anam.tariq86@gmail.com.
M. Usman Akram, Email: usman@bahria.edu.pk.
Arslan Shaukat, Email: arslanshaukat@ceme.nust.edu.pk.
Shoab A. Khan, Email: kshoab@yahoo.com
References
- 1.Causes and risk factors of diabetic retinopathy. United States National Library of Medicine. 15 September 2009
- 2.Iwasaki M, Inomara H. Relation between superficial capillaries and fovea structures in the human retina. J Investigative Visual Ophthalmology. 1986;27:1698–1705. [PubMed] [Google Scholar]
- 3.Niemeijer M, Ginneken BV, Russell SR, Suttorp-Schulten MS, Abrmoff MD. Automated detection and differentiation of drusen, exudates, and cotton-wool spots in digital color fundus photographs for diabetic retinopathy diagnosis. Invest Ophthalmology Vis Sci. 2007;48(5):2260–2267. doi: 10.1167/iovs.06-0996. [DOI] [PMC free article] [PubMed] [Google Scholar]
- 4.Zhang X, Chutatape O: Top down and bottom up strategies in lesion detection of background diabetic retinopathy. IEEE Computer Society Conference on Computer Vision and Pattern Recognition, 2005, CVPR 2005, 2: pp 422–428
- 5.Acharya UR, Chua CK, Ng EYK, Yu W, Chee C. Application of higher order spectra for the identification of diabetes retinopathy stages. J Med Systems. 2008;32:481–488. doi: 10.1007/s10916-008-9154-8. [DOI] [PubMed] [Google Scholar]
- 6.Sinthanayothin C, Boyce JF, Cook HL, Williamson TH. Automated localisation of the optic disc, fovea, and retinal blood vessels from digital colour fundus images. British J Ophthalmology. 1999;83:902–910. doi: 10.1136/bjo.83.8.902. [DOI] [PMC free article] [PubMed] [Google Scholar]
- 7.Tan NM, Wong DWK, Liu J, Ng WJ, Zhang Z, Lim JH, Tan Z, Tang Y, Li H, Lu S, Wong TY: Automatic detection of the macula in the retinal fundus image by detecting regions with low pixel intensity, International Conference on Biomedical and Pharmaceutical Engineering, ICBPE '09, pp. 1–5, 2009, IEEE, Singapore
- 8.Elshahawy MS, ElAntably A, Fawzy N, Samir K, Hunter M, Fahmy AS: Segmentation of diabetic macular edema in fluorescein angiograms. IEEE International Symposium on Biomedical Imaging: From Nano to Macro, pp. 661–664, 2011, IEEE, Chicago, IL
- 9.Lim ST, Zaki WMDW, Hussain A, Lim SL, Kusalavan S: Automatic classification of diabetic macular edema in digital fundus images. 2011 IEEE Colloquium on Humanities, Science and Engineering (CHUSER), pp. 265–269, 2011, IEEE, Penang, Malaysia
- 10.Deepak KS, Sivaswamy J. Automatic assessment of macular edema from color retinal images. IEEE Transactions on Medical Imaging. 2012;31(3):766–776. doi: 10.1109/TMI.2011.2178856. [DOI] [PubMed] [Google Scholar]
- 11.Osareh A, Mirmehdi M, Thomas B, Markham R: Automatic recognition of exudative maculopathy using fuzzy C-means clustering and neural networks. Proceedings of Medical Image Understanding and Analysis Conference, pp. 49–52, 2001
- 12.Siddalingaswamy PC,Prabhu KG: Automatic grading of diabetic maculopathy severity levels. Proceedings of 2010 International Conference on Systems in Medicine and Biology, pp. 331–334, 2010
- 13.Tariq A, Akram MU: An automated system for colored retinal image background and noise segmentation. IEEE Symposium on Industrial Electronics and Applications (ISIEA 2010), pp. 405–409, 3rd–5th October 2010, Penang, Malaysia
- 14.Akram MU, Tariq A, Anjum MA, Javed MY. Automated detection of exudates in colored retinal images for diagnosis of diabetic retinopathy. OSA J Applied Optics. 2012;51(20):4858–4866. doi: 10.1364/AO.51.004858. [DOI] [PubMed] [Google Scholar]
- 15.Gonzalez RC, Woods RE. Digital Image Processing. 2. Upper Saddle River: Prentice Hall; 2002. [Google Scholar]
- 16.Akram MU, Khan A, Iqbal K, Butt WH: Retinal images: optic disk localization and detection, ICIAR 2010, Part II, LNCS 6112, pp. 40–49, 2010
- 17.Mubbashar M, Usman A, Akram MU: “Automated system for macula detection in digital retinal images”. International Conference on Information and Communication Technologies (ICICT), pp. 1–5, 2011.
- 18.Akram MU, Khan SA: Multilayered thresholding-based blood vessel segmentation for screening of diabetic retinopathy, Engineering with Computer (EWCO), 2012, doi:10.1007/s00366-011-0253-7
- 19.Theodoridis S, Koutroumbas K. Pattern Recognition. 1. Burlington: MA: Academic; 1999. [Google Scholar]
- 20.Duda RO, Hart PE, Stork DG. Pattern Classification. New York: Wiley; 2001. [Google Scholar]
- 21.MESSIDOR: http://messidor.crihan.fr/index-en.php. Accessed 10 January 2013.
- 22.Hoover, STARE database, http://www.ces.clemson.edu/~ahoover/stare/. Accessed 10 January 2013.
- 23.Sagar AV, Balasubramanian S, Chandrasekaran V: Automatic detection of anatomical structures in digital fundus retinal images. Conference on Machine Vision Applications pp. 483–486, 2007
- 24.Lu S, Lim JH: Automatic macula detection from retinal images by a line operator. Proceedings of 2010 IEEE 17th International Conference on Image Processing, pp. 4073–4076, 2010
- 25.Nayak J, Bhat PS, Acharya UR, Lim CM, Kagathi M. Automated identification of diabetic retinopathy stages using digital fundus images. J Medical Systems. 2008;32:107–115. doi: 10.1007/s10916-007-9113-9. [DOI] [PubMed] [Google Scholar]
- 26.Reza AW, Eswaran C, Dimyati K. Diagnosis of diabetic retinopathy: automatic extraction of optic disc and exudates from retinal images using marker controlled watershed transformation. J Medical Systems. 2011;35(6):1491–1501. doi: 10.1007/s10916-009-9426-y. [DOI] [PubMed] [Google Scholar]
- 27.Yazid H, Arof H, Mohd Isa H. Automated Identification of exudates and optic disc based on inverse surface thresholding. J Medical Systems. 2012;36(3):1997–2204. doi: 10.1007/s10916-011-9659-4. [DOI] [PubMed] [Google Scholar]
- 28.Walter T, Klein JC, Massin P, Erginay A. A contribution of image processing to the diagnosis of diabetic retinopathy detection of exudates in color fundus images of the human retina. IEEE Transactions on Medical Imaging. 2002;21(10):1236–1243. doi: 10.1109/TMI.2002.806290. [DOI] [PubMed] [Google Scholar]
- 29.Alireza O, Shadgar B, Markham R. A computational-intelligence-based approach for detection of exudates in diabetic retinopathy images. IEEE Transactions on Information Technology in Biomedicine. 2009;13(4):535–545. doi: 10.1109/TITB.2008.2007493. [DOI] [PubMed] [Google Scholar]
- 30.Akram MU, Khan MU. Automated detection of dark and bright lesions in retinal images for early detection of diabetic retinopathy. J Medical Systems. 2012;36(5):3151–3162. doi: 10.1007/s10916-011-9802-2. [DOI] [PubMed] [Google Scholar]
- 31.Aquino A, Gegundez ME, Marin D. Automated optic disc detection in retinal images of patients with diabetic retinopathy and risk of macular edema. International J Biological Life Sciences. 2012;8(2):87–92. [Google Scholar]