

Abstract
Calorie restriction (CR) remains the most robust metabolic intervention to extend lifespan and improve healthspan in several species. Using global and targeted mass spectrometry-based metabolomics approaches, here we show that chronic CR prevents age-related changes in specific metabolic signatures. Global metabolomic analysis using ultra-performance liquid chromatography–tandem mass spectrometry detected more than 7,000 metabolites in sera from ad-libitum-fed young, aged, and aged C57BL/6 mice maintained on 40 % CR. Multivariate statistical analysis of mass spectrometry data revealed a clear separation among the young, aged, and aged–CR mice demonstrating the potential of this approach for producing reliable metabolic profiles that discriminate based on age and diet. We have identified 168 discriminating features with high statistical significance (p ≤ 0.001) and validated and quantified three of these metabolites using targeted metabolite analysis. Calorie restriction prevented the age-related alteration in specific metabolites, namely lysophosphatidylcholines (16:1 and 18:4), sphingomyelin (d18:1/12:0), tetracosahexaenoic acid, and 7α-dihydroxy-4-cholesten-3-one, in the serum. Pathway analysis revealed that CR impacted the age-related changes in metabolic byproducts of lipid metabolism, fatty acid metabolism, and bile acid biosynthesis. Our data suggest that metabolomics approach has the potential to elucidate the metabolic mechanism of CR’s potential anti-aging effects in larger-scale investigations.
Electronic supplementary material
The online version of this article (doi:10.1007/s11357-012-9430-x) contains supplementary material, which is available to authorized users.
Keywords: Metabolomics, Calorie restriction, Aging, Serum, Ultra-performance liquid chromatography, Mass spectrometry
Introduction
Calorie restriction (CR) refers to an intervention involving reduced consumption of a nutritious diet on the order of about 20–50 % below ad libitum (AL) levels. Calorie restriction has proven to be the most robust intervention for both increasing lifespan and improving healthspan across a wide range of species (Smith et al. 2010; Fontana et al. 2010; Masoro 2005; Anderson and Weindruch 2010). Furthermore, well-controlled studies in humans suggest that certain beneficial metabolic effects of CR observed in rodents and other species may be relevant to human physiology (Heilbronn et al. 2006; Racette et al. 2006; Rochon et al. 2011). Epidemiological findings further support the relationship between caloric intake and chronic disease risk factors (Omodei and Fontana 2011). Despite the weight of this evidence, the challenge remains to identify the mechanisms underlying the beneficial effects of CR. To this end, application of the emerging metabolomics technology can be a powerful approach towards achieving this goal.
Global metabolomics is the comprehensive investigation of endogenous metabolites in complex biological specimens and has the potential to identify metabolic pathways and networks altered due to biological effects (Nicholson et al. 1999; Fiehn 2002). Global metabolomics strategies have been widely applied to study cancer, diabetes, neurological diseases, cardiovascular diseases, obesity, effects of nutrition and exercise, and for drug discovery and development (Nagrath et al. 2011; Barderas et al. 2011; Wishart 2008; Rezzi et al. 2007; Kim et al. 2010; Lewis et al. 2010; Huang et al. 2010; Mishur and Rea 2012). This methodology has also been applied in aging studies in several species including Caenorhabditis elegans, fruit fly, rodents, dogs, and humans (Kristal and Shurubor 2005; Mishur and Rea 2012). In mammalian studies, carnitines, fatty acids, and other metabolites associated with energy metabolism, lipid metabolism, nucleic acid metabolism, and oxidative stress were shown to be perturbed with age (Williams et al. 2005; Granger et al. 2007; Lu et al. 2008; Lawton et al. 2008).
Even though metabolomics has been applied to study aging and age-associated diseases (Mishur and Rea 2012), as well as to study effects of specific foods in aging animals (Fu et al. 2011; Yang et al. 2011; Yan et al. 2009), the use of this methodology for studying effects of CR on aging has been limited at best. Comparison of urine metabolomic profiles in dogs (Nicholson et al. 2007) and Sprague–Dawley rats (Zhang et al. 2011) using nuclear magnetic resonance (NMR) and liquid chromatography–mass spectrometry (LC-MS)-based metabolomic strategies, respectively, indicate effects of CR on gut microbiotal metabolism, energy metabolism, and renal activity. In urine, age-related increases in levels of metabolites such alanine and lactate were attenuated in aged dogs on CR (Nicholson et al. 2007) whereas levels of these metabolites were reported to be increased in plasma from aged mice on CR (Selman et al. 2006). Using NMR-based metabolomics, other metabolites found to be present at differential levels in plasma were glucogenic amino acids, cholesterol, and very-low-density lipoproteins, indicating that CR plays a role in hepatic gluconeogenesis, fatty acid metabolism, and lipid biosynthesis (Selman et al. 2006). Studies of aging and CR applying an electrochemical detection method coupled to high-performance liquid chromatography separations for metabolomics have also been described; however, this technology is limited to redox-active compounds and does not provide structural information (Kristal et al. 2007).
In the work herein, we have applied both global and targeted ultra-performance liquid chromatography (UPLC)–tandem MS methods to elucidate discriminatory metabolites related to aging and CR in mouse serum. Blood sera from young AL-fed, aged AL-fed, and aged mice on CR were investigated. The UPLC–tandem MS approach allowed identification, verification and quantification of metabolites altered due to age and affected by CR. Bioinformatics and pathway analysis of the high-density UPLC-MS data allowed identification of associated metabolic pathways as well as specific metabolites. This study illustrates the potential of this approach to determine underlying molecular mechanisms altered by aging and modulated by CR.
Materials and methods
Blood serum collection
Blood serum samples were collected from three groups of female C57BL/6 mice—3-month-old fed ad libitum normal chow diet (Y–AL), 26-month-old fed AL (A–AL), and 26-month-old maintained on chronic CR diet as described previously (Yang et al. 2009). CR was initiated at 14 weeks of age at 10 % restriction, increased to 25 % restriction at 15 weeks, and to 40 % restriction at 16 weeks (A–CR), and then maintained for the rest of life. All CR mice were provided 40 % less diet (NIH31/NIA fortified) by weight compared with AL-fed mice according to the National Institute on Aging (NIA) CR protocol (http://www.nia.nih.gov/research/dab/aged-rodent-colonies-handbook/caloric-restricted-colony). The 3-month-old mice were obtained from the colony maintained at Charles River Labs under contract from the NIA, and the 26-month-old cohort including those maintained under long-term CR was purchased from NIA-aging rodent colony (Harlan Sprague–Dawley, Indianapolis, IN). After arrival, mice were housed four per cage in plastic cages with TekFresh for bedding within a temperature- and humidity-controlled vivarium in the Comparative Biology Core of the Pennington Biomedical Research Center (PBRC), which is a specific-pathogen-free facility. The photocycle was controlled automatically with lights on and off every 12 h, and animals were maintained on their respective diets as listed above. It has been shown previously that single or multi-house mice on CR have no effect on lifespan (Ikeno et al. 2005). The mice were sacrificed 1 week after arrival, and blood was collected by cardiac puncture and stored at –80°C until UPLC-MS. Only female mice were selected for this study, because it has been shown that the direction of change in the metabolite profiles upon CR are gender-specific (Mellert et al. 2011). All protocols were approved by the PBRC Institutional Animal Care and Use Committee (IACUC).
Global metabolomics analysis
Sample preparation
Serum samples were defrosted at 4°C. Each sample was then deproteinized by adding chilled methanol to a 110-μL aliquot of the serum sample (4:1 v/v methanol-to-serum ratio). The mixture was incubated at –20°C for 1 h and centrifuged at 20,800× g for 15 min at 4°C. The supernatant was dried under vacuum and reconstituted in 100 μL of H2O.
UPLC–ESI–qTOF–MS analysis
Blood serum components were separated and analyzed using an ACQUITY UPLC system directly interfaced to an electrospray ionization source of a Synapt HDMS quadrupole time-of-flight (qTOF) MS (Waters Corp., Milford, USA). Ten microliters of sample was loaded on a Waters ACQUITY UPLC BEH C18 1.7 μm, 2.1 × 50-mm column. The mobile phases used were 0.1 % formic acid (solvent A) and 0.1 % formic acid in acetonitrile (solvent B). The separation was performed at 40°C using a gradient program that started with 100 % solvent A for 3 min followed by a linear ramp to 100 % B over 13 min. The flow rate was maintained at 600 μL min–1.
Mass spectra were acquired in the positive ion mode from 50 to 1,000 m/z, with an electrospray voltage of 3 kV, sample cone voltage of 30 V, extraction cone voltage of 2 V, and source temperature of 120°C using MassLynx software (Waters Corp.). All samples were run in triplicate. The mass spectrometer was operated in the MSE mode for the first run and the MS mode (collision energy of 6 V) for the second and third runs. The MSE mode uses an alternating low-energy (collision energy of 6 V) and high-energy (collision energy linearly ramped from 10 to 50 V) 0.08-s scans to acquire data. The collision energy ramp causes fragmentation of molecules as they pass the collision cell. The MSE mode provides precursor and product ion information for every detectable component in the mixture (Bateman et al. 2007). Leucine enkephalin ([M + H]+ 556.2771) was utilized for lock mass correction. Quality control samples consisting of human blood serum (Sigma, St. Louis, Missouri) were analyzed throughout the run to monitor the system’s stability and performance.
Multivariate statistical analysis
LC-MS data analysis was performed using MarkerLynx XS (Waters Corp.). Chromatography and centroided MS data were aligned to generate a single data matrix consisting of retention time, mass-to-charge (m/z), and normalized ion intensity for each detected peak in individual samples. Parameters used to generate the data matrix from smoothed and deisotoped data were as follows: extracted ion chromatogram (XIC) window, 0.03 Da; marker intensity threshold, 30 counts; mass window, 0.03 Da; retention time window, 0.05 min; and automatic peak detection. Principal components analysis (PCA) using Pareto-scaled data was performed to reduce the dimensionality of the data and to reveal any segregation of the three mouse groups in an unsupervised manner. Three PCA analyses were conducted comparing two mouse groups at a time (Y–AL vs. A–AL, A–AL vs. A–CR, and Y–AL vs. A–CR). Supervised projection to latent structures (PLS) and orthogonal projection to latent structures–discriminant analysis (OPLS–DA) were employed to detect features that exhibited the greatest contribution in group discrimination. Lists of features (markers with characteristic retention time and mass-to-charge (m/z) values) which exhibited differential levels between Y–AL and A–AL, A–AL and A–CR, and Y–AL and A–CR were generated and are presented in Electronic supplementary material Tables S-1 and S-2 (online resource). This list was obtained by selecting features with p(corr)[1] ≥ 0.8 and p(corr)[1] ≤ −0.8 in the S-plots obtained from three OPLS–DA analyses which had p values ≤ 0.001 based on Student’s t test for at least one of the comparisons and normalized ion intensities ≥1.0 (arbitrary unit) for at least one group.
Metabolite identification and metabolic pathway analysis
Database searches using METLIN, Madison Metabolomics Consortium Database (MMCD), KEGG, HMDB, Lipidmaps, and Chemspider databases were performed with 5 ppm tolerance for potential identification. Mass Fragment analysis (Waters Corp.) using TOF-transformed and noise-reduced high-energy MS data, elemental composition analysis, isotope modeling (MassLynx), and manual inspection of the high-energy product ion MS data were used to confirm identification obtained from the database search. Mass Fragment is a tool that predicts the structure of fragment ions from a pre-assigned structure of the precursor ion. This allows matching of the theoretical fragment ions with the acquired high energy MS data to aid in the definitive identification of metabolites. This tool also served to eliminate candidate structures that did not give rise to plausible fragment ions matching the acquired high-energy MS data. The Web-based program MassTRIX (Suhre and Schmitt-Kopplin 2008) was utilized to identify metabolic pathways and also to aid in the assignment of chemical identities to the features. MassTRIX translates masses from MS-based metabolomics experiment into identified metabolites on KEGG-based annotated pathways.
Targeted metabolomics analysis
Validation and quantification of selected metabolites
Identification of palmitoyl carnitine (Sigma), oleoyl carnitine (Avanti Polar Lipids), and docosapentaenoic acid (Sigma) were validated using the commercially available standards. Targeted analysis of standards and samples was performed on an Acquity UPLC system directly interfaced to the electrospray ionization source of a Xevo triple quadrupole MS (Waters Corp.). The UPLC conditions (i.e., column, column temperature, mobile phases, gradient program, and flow rate) were identical to the global MS analysis. The mass spectrometer was operated in the positive ion mode, and MS parameters and multiple reaction monitoring (MRM) transitions for all three standards were optimized using direct infusion at a flow rate of 5 μL min−1. The optimized parameters were capillary voltage of 3.5 kV, extraction cone voltage of 3 V, and source temperature of 150°C. Sample cone voltages (CV) and collision energies (CE) for the MRM transitions were as follows: palmitoyl carnitine (400.2 → 85), CV = 30, CE = 25; oleoyl carnitine (426.2 → 85), CV = 32, CE = 26; and docosapentaenoic acid (331.3 → 93), CV = 28, CE = 30. Five microliters of the standard mixtures prepared in water with concentrations ranging from 0.025 to 1.000 ng μL–1 was loaded, separated on the UPLC column, and analyzed using MRM–MS to generate a standard calibration curve for each compound. All three compounds were quantified in 5 μL of the pooled mouse serum for each group using the standard calibration curves.
Results
Our prior studies demonstrated that, compared with AL-fed 24-month mice, animals maintained on chronic CR were substantially protected from age-related thymic involution and T cell senescence (Yang et al. 2009). The sera from these mice were used for metabolomic analyses in the current study to test the hypothesis that chronic CR maintains youthful metabolic signatures in aging.
Global metabolomics analysis
Figure 1 presents representative base peak ion (BPI) chromatograms from deproteinized mouse blood sera of the three groups (3-month-old (Y–AL), 26-month-old (A–AL), and 26-month-old mice on chronic CR diet (A–CR)) analyzed with reverse-phase UPLC–electrospray ionization (ESI)–qTOF in positive ion mode. The relative standard deviations for the variability in retention times in the chromatograms and mass-to-charge (m/z) for specific ions in the spectra across different biological and technical replicates were found to be ≤1 % and ≤0.008 %, respectively. These observations demonstrate instrument stability and reproducibility in separation and detection of metabolites from mouse sera. To further examine the performance of our global metabolomics data acquisition workflow, QC and mouse sera samples were subjected to PCA analysis as shown in Electronic supplementary material Fig. S-1 (online resource). It can be clearly seen that the QC and mouse sera samples occupy a separate metabolic space in the PCA scores plot and have very distinct and reproducible metabolomic profiles. Together with the representative chromatograms (Fig. 1), these results show that metabolite profiles from mouse sera samples regardless of age and diet are overall similar to each other, are distinct compared with human metabolite profiles, and are reproducible.
Fig. 1.

Representative BPI chromatograms (within 8–16 min retention time window) obtained from mouse sera samples analyzed with reverse-phase UPLC–ESI–qTOF operating in positive ionization mode. Arrows point to regions in chromatograms where levels of features were changed with advanced age and partially or completely restored to the young level with CR
To determine if global metabolomic profiles can distinguish between samples based on age and diet, a single data matrix containing retention time, m/z, and normalized intensity of each metabolic feature detected reproducibly was generated using MarkerLynx (Waters Corp.). This analysis resulted in the extraction of 7,343 features from the LC-MS data of mouse sera samples. The number of features detected in our analysis are comparable to other plasma and serum metabolomics studies using this methodology (Denery et al. 2011, Dunn et al. 2011). Unsupervised PCA score plots that show the first (PC1) and second (PC2) components for three pair-wise comparisons (Y–AL vs. A–AL, A–AL vs. A–CR, and Y–AL vs. A–CR) are presented in Fig. 2. These plots show clear differentiation within each comparison. Figure 2a shows that young and old mice fed ad libitum are clearly separated along the vertical component (PC2), suggesting that there are underlying differences in the metabolome with age. The separation between aged mice with and without CR also strongly indicates that the metabolomic pattern is altered by the diet intervention (Fig. 2b). Interestingly, serum metabolic profiles of young mice fed AL and aged mice on CR were also found to be clearly different from each other, suggesting that CR does not result in complete protection from the aging-associated metabolic state (Fig. 2c). In addition, PLS–DA analysis of all three groups also resulted in three distinct clusters occupying separate metabolic spaces in the scores plot (Fig. 2d). Thus, the scatter plots from the PCA analysis clearly show that serum metabolomic profiles have the potential to distinguish groups based on age and/or diet.
Fig. 2.

Unsupervised principal component analysis (PCA) score scatter plots of (a) Y–AL and A–AL, (b) A–AL and A–CR, (c) Y–AL and A–CR, and (d) supervised projection to latent structures–discriminant analysis (PLS–DA) score scatter plot of the three animal groups. Plots show biological and technical replicates (n = 3). Technical replicates of each serum sample formed tight clusters indicating excellent system performance
Two-component OPLS–DA analyses were performed to detect features that contributed most to the discrimination among the three groups. Identification of features that explains the maximum separation between these groups is critical to identify potential mechanisms responsible for the longer lifespan and improved healthspan observed with CR. Loadings S-plots that complement the score plots of OPLS–DA are presented in Fig. 3. Ions with reliability modeled correlation (p(corr)[1]) ≥0.8 and ≤−0.8 were selected from each S-plot as potential markers. These lists of discriminating ions in each comparison were further examined to identify ions that significantly contributed to the separation (p value ≤ 0.001). This value was selected to confidently identify metabolites altered due to CR and age and to decrease the risk of false-positives arising from inherent biological variability. The number of features determined to discriminate Y–AL versus A–AL, A–AL versus A–CR, and Y–AL versus A–CR were 14, 77, and 141, respectively. It should be noted that these features are not necessarily unique to that comparison. A total of 168 features exhibiting discrimination in at least one of the comparisons are summarized in Electronic supplementary material Tables S-1 and S-2 (online resource).These results show that there are a substantial number of potential markers that can discriminate between groups. The number of metabolites detected to be affected by CR is ~5-fold higher than those affected by aging. These results are consistent with gene expression studies examining CR effects in mice as reported in the literature (Lee et al. 2002). In transcriptional profiles of the heart of male B6C3F1 mice, 21 % of genes were found to be affected by CR while only 10 % of genes were affected by aging alone. This observation led Lee and co-workers to conclude that CR can both prevent age-associated alterations in gene expression and also affect expression of genes not affected by aging. This might explain why we also observe more metabolites affected with CR than with age.
Fig. 3.

Loadings S-plots of (a) Y–AL versus A–AL, (b) A–AL versus A–CR, and (c) Y–AL versus A–CR groups from supervised orthogonal projection to latent structures–discriminant analysis (OPLS-DA) showing individual features obtained from the serum samples. Each point on the plot is a feature that is characterized by retention time, mass-to-charge, and intensity
We have identified several discriminatory features largely based on database results and manual inspection of TOF-transformed high-energy product ion spectra (Electronic supplementary material Table S-1; online resource). Additional strategies including spectral matching with reference compounds, mass fragment analysis (Waters Corp.), elemental composition analysis, and isotope modeling were exploited to increase the confidence of the identification. Based on our data, levels of 77 features are altered significantly (p value ≤ 0.001) in aged mice upon subject to CR (A–CR) compared with their age-matched mouse group fed AL (A–AL) (Fig. 4). Interestingly, CR completely or partially restored levels of 15 of these features towards the young phenotype (Fig. 5). These 15 features include lysophosphatidylcholines (16:1 and 18:4), sphingomyelin (d18:1/12:0), tetracosahexaenoic acid, and 7α-dihydroxy-4-cholesten-3-one. Other features with m/z 209.121, 159.068, 363.261, 364.270, 673.528, 536.414, 476.314, 158.119, 759.946, and 339.270 could not be identified definitively in this analysis. However, levels of these metabolic features can be used as a fingerprint to distinguish samples based on age and diet and to study the effect of CR in future studies.
Fig. 4.

Heat map illustrating levels of discriminatory features found in mouse sera from Y–AL, A–AL, and A–CR groups that were responsive to CR. The metabolites are listed in decreasing order based on p value for A–AL vs. A–CR comparison. Shades from red to green represent increasing normalized intensity of ions in mouse sera. Fifteen metabolites whose levels are partially or completely restored by CR are marked
Fig. 5.
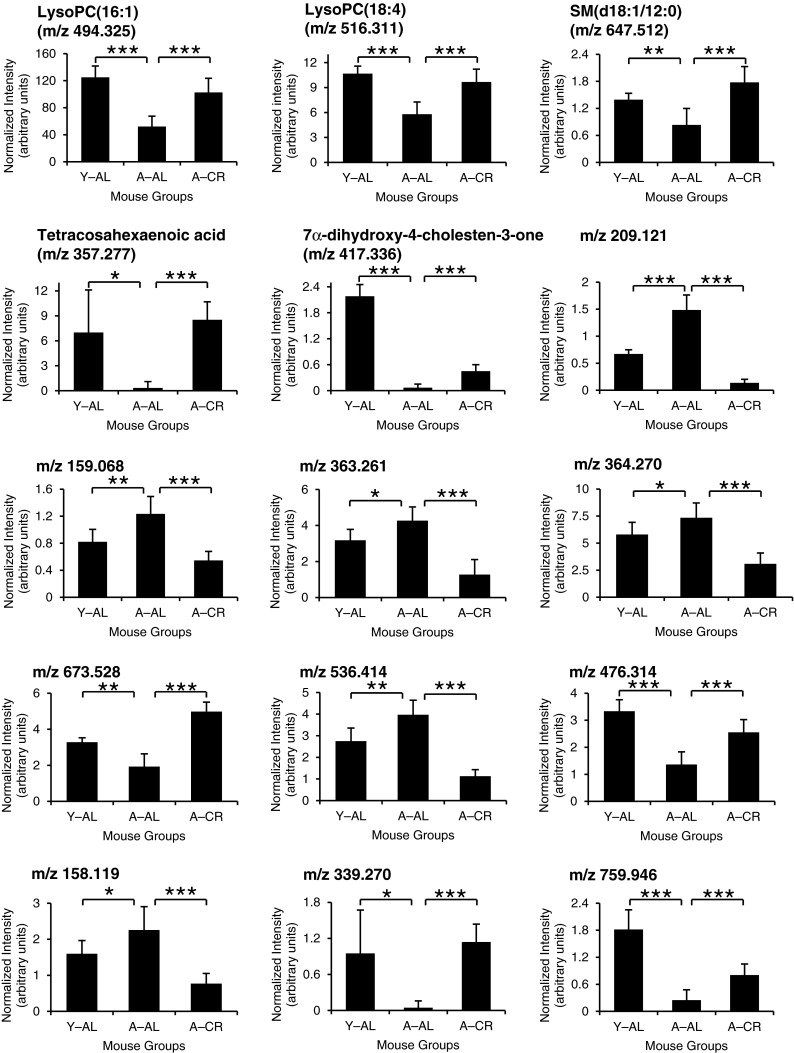
Bar graphs demonstrating relative quantification of the 15 metabolic features that are protected from age-related alteration by CR based on global metabolomics analysis. The error bars are the standard deviation of the mean from results obtained from all biological replicates. Statistical significance values are marked with asterisks as follows: *p < 0.05, **p < 0.01, ***p < 0.001
To identify possible metabolic pathways affected due to CR and age, ions contributing significantly to the separation of the three groups were analyzed and placed into a biological and genomic context using MassTRIX (Suhre and Schmitt-Kopplin 2008). This resulted in the identification of regulated pathways, such as those involved in lipid metabolism (glycerophospholipid metabolism, arachidonic acid metabolism, linoleic acid metabolism, α-linolenic acid metabolism, fatty acid metabolism, and sphingolipid metabolism) and bile acid metabolism (primary bile acid biosynthesis, bile secretion, steroid biosynthesis). Detailed characterization for three of the discriminating metabolites was further carried out by comparison with commercially available authentic standards.
Validation and quantification of metabolites
Validation and quantification of three metabolites identified as oleoyl carnitine, palmitoyl carnitine, and docosapentaenoic acid were performed through targeted MS analysis employing MRM using an UPLC–ESI–triple quadrupole MS. In an ideal case, it would be best to validate as many features as possible using pure standards; however, many of the identified compounds are not commercially available. Nevertheless, the validation and quantification studies presented below for the three selected compounds represent metabolites that increased with CR.
Representative MRM chromatograms for the three metabolites obtained from both the standard solutions and from mouse sera are presented in Fig. 6. Tandem MS (MS/MS) spectra were initially acquired for each of the three compounds and fragmentation patterns were compared with the high-energy spectra from global metabolomics analysis. For palmitoyl and oleoyl carnitine, the characteristic fragment of acylcarnitines at m/z 85 was observed in both MS/MS spectra and in high-energy product ion MS data. For docosapentaenoic acid, product ions arising from the fragmentation of the hydrocarbon chain were evident in both data sets. Even though UPLC conditions used for both global and targeted analyses were identical, the retention times obtained from targeted analysis were shifted from the retention times observed from the global analysis (palmitoyl carnitine, 10.85targeted vs.13.17global; oleoyl carnitine, 11.03targeted vs. 13.28global; and docosapentaenoic acid, 13.14targeted vs.13.84global min). This is because the experiments were carried out on two different UPLC systems and represent differences in connection tubing volume and column to column variability. This retention time shift was further confirmed by spiking the standards in human serum QC samples and by acquiring untargeted MS data (data not shown). As shown in Fig. 6, the retention times for each of the metabolites were identical in both standard solution and in mouse sera samples which further validates the identity of the three features.
Fig. 6.

Validation of representative metabolites (a) oleoyl carnitine (m/z 426.2 → 85), (b) palmitoyl carnitine (m/z 400.2 → 85), and (c) docosapentaenoic acid (m/z 331.3 → 93) in mouse sera using multiple reaction monitoring (MRM) by comparison with authentic standard compounds. These compounds were validated in sera from all three mouse groups, but A–CR sample is presented in the figure. The arrow in (c) points to the peak corresponding to docosapentaenoic acid
Concentration of these compounds in sera from three mouse groups was determined using a standard calibration curve (Fig. 7). Figure 7 also presents relative levels of these compounds based on global analysis. Although global analysis is only capable of relative quantification, the similarity in the trend in levels of the metabolites observed using global and targeted analysis indicates that the former can confidently differentiate the levels even at a first pass in the analysis. This finding has significant implications, because this indicates that relative quantification to differentiate the levels of metabolites by global analysis, especially in cases where formal quantification by targeted analysis cannot be performed, is reliable. In summary, the selectivity of the MRM method allowed the validation of the three markers, while the sensitivity of the method allowed the quantification of the three markers amidst the complexity of the serum matrix.
Fig. 7.

Comparison between global and targeted metabolomics analysis for representative metabolites identified to exhibit discrimination among Y–AL, A–AL, and A–CR mouse groups. The left panel shows the normalized intensities of each metabolite obtained from global metabolomic analysis of mouse serum samples using UPLC–ESI–qTOF. The right panel shows the concentration of each metabolite obtained from targeted analysis of mouse serum samples using multiple reaction monitoring (MRM) on UPLC–ESI–triple quadrupole MS and quantification using standard calibration curves. Bar graphs show the average and standard deviation (error bars) from biological replicates for the global analysis and technical replicates (n = 3) for the targeted analysis. Statistical significance values are marked with asterisks as follows: *p < 0.05, **p < 0.01, ***p < 0.001
Discussion
In the present study, we have utilized a global and targeted metabolomics approach to demonstrate its potential to investigate the effects of CR on aging processes. Serum from three groups of mice (3-month-old fed ad libitum (Y–AL), 26-month-old fed ad libitum (A–AL), and 26-month-old on chronic CR diet (A–CR)) were analyzed using UPLC–tandem MS. Mass spectrometry-based metabolomics methodology was used to take advantage of this technique’s sensitivity, wide dynamic range, selectivity, and capabilities for structural elucidation and quantification. Since blood constituents reflect biological processes occurring simultaneously in the tissues, analyzing metabolite profile of serum provides a unique first insight into the changes that occur due to CR. In addition, blood is readily available and can be obtained in a minimally invasive manner.
Global analysis was performed first to detect as many metabolites as possible without any bias towards specific classes of compounds. Over 7,000 metabolic features were detected in this study. Global analysis also allows measurement of changes in levels of all metabolites simultaneously. Multivariate statistical analysis tools were used to facilitate recognition of 168 features that contributed most significantly to discrimination between Y–AL and A–AL, A–AL and A–CR, and Y–AL and A–CR sample groups. Since many metabolites can have identical mass, database inquiries based on accurate m/z are not sufficient for identification. We therefore utilized high energy data, physico-chemical rules in mass spectrometry combined with mass spectral information from the literature and databases for metabolite identification. Targeted analysis using MRM–UPLC–ESI–MS was used to validate and quantify representative identified metabolites, namely oleoyl carnitine, palmitoyl carnitine, and docosapentaenoic acid. In general, the methodology described, combining both global and targeted metabolomics, allowed us to interrogate the mouse sera metabolic profiles to identify metabolites that can discriminate animals on different diets and ages without prior knowledge of the chemical identity of these targets. Based on identified CR-responsive metabolites, lipid, fatty acid, and bile acid metabolism pathways were identified to be over-represented. These pathways have been shown to play an important role in aging and age-related disorders (Jiang et al. 2011; Cutler and Mattson 2001). Specifically, the sphingosine-linked fatty acids like ceramides serve as “damage-associated molecular patterns” (DAMPs) that are increased in aged tissue and cause inflammatory damage via the activation of Nlrp3 inflammasome (Vandanmagsar et al. 2011; Youm et al. 2012). Our data have revealed specific fatty acids in these pathways for which levels in blood serum may correlate with age-related decline in organ function. These data also indicate that CR may dampen the age-related increase in DAMPs and thus slow age-related organ damage.
Specifically, the age-related decrease in levels of two of the phospholipids, namely lysoPCs (16:1) and (18:4) were completely restored by CR (Figs. 4 and 5). Indeed, it has been shown that the activities of enzymes involved in the deacylation–reacylation cycle in the glycerophospholipid metabolism are altered with aging (Petkova et al. 1986) and CR (Han et al. 2004). This cycle is important for maintaining membrane fluidity by modulating the fatty acid composition of membrane phospholipids (Farooqui et al. 2000). Fatty acid composition of membrane phospholipids in rats has been shown to shift from low to high degree of unsaturation with age, which increases the peroxidizability index whereas membranes from rats on CR, while exhibiting higher levels of essential fatty acids, showed lower levels on a peroxidizability index (Laganiere and Yu 1993). Because membranes with a high index of polyunsaturation have increased susceptibility to oxidation, lipid peroxidation is a common occurrence with aging, releasing oxidation products that contribute to chronic inflammation (Walton et al. 2003; Tahara et al. 2001). Evidence from long-lived animals have shown that the degree of unsaturation in membrane phospholipids is low in these animals compared with short-lived animals and the deacylation–reacylation cycle is implicated in this change in lipid profile (Portero-Otin et al. 2001). Altered desaturase activity involved in fatty acid desaturation pathway was also proposed to account for these observations (Portero-Otin et al. 2001; Laganiere and Yu 1993). Indeed, animals on CR have richer pools of phospholipids that exhibit a reduced degree of unsaturation (Han et al. 2004). Interestingly, consistent with our observations, levels of C16:1 in phospholipids has been found to decrease with advancing age (Laganiere and Yu 1993). Other glycerophospholipids identified in our global studies such as lysoPC (20:5), lysoPC (17:1), and lysoPC (22:4) are involved in lipid metabolism but were not identified to be responsive to CR. This is an important observation which implies that changes in the glycerophospholipid metabolism gives rise to specific serum lipids that change uniquely with CR and can thus be considered useful markers of CR and aging (e.g., lysoPC(16:1) and lysoPC(18:4)).
We have also identified a sterol lipid derivative, 7α-dihydroxy-4-cholesten-3-one, which is involved in bile acid biosynthesis pathway. This metabolite exhibited an age-related decline and was partially restored by CR. In fact, it has been shown that bile acid formation decreases with aging (Einarsson et al. 1985; Parini et al. 1999; Bertolotti et al. 1993). Indeed, activities of 12α-hydroxylase and cholesterol 7α-hydroxylase were found to be reduced with aging in female Sprague–Dawley rats (Ferland et al. 1989) and elderly patients (Bertolotti et al. 1993), respectively. CR was demonstrated to reverse this age-related decline in bile acid formation (Ferland et al. 1989), indicating that CR regulates specific enzymes within this pathway. Indeed, increased attention is being focused on bile acids as major mediators of longevity associated with CR (Roux and Chartrand 2010; Ferbeyre 2010) and also with genetic mutations promoting longevity, such as the dwarf mouse (Gems 2007).
In summary, metabolomic profiles of biological fluids presented here and in the literature using both NMR (Selman et al. 2006; Nicholson et al. 2007) and MS techniques (Zhang et al. 2011) are able to distinguish the aged population against those under CR and can identify discriminating metabolites. However, compared with other studies, the MS-based methodology utilized here detected significantly larger (fivefold) number of CR-responsive metabolites. In addition, we show that levels of 15 age-associated metabolites are completely or partially restored by CR. Our data also suggest that the effect of CR is more pronounced than the influence of aging alone in the serum metabolic profile of mouse. These results are consistent with gene expression studies in heart tissue of male B6C3F1 mice on CR (Lee et al. 2002). However, these results are in contrast with urinary metabolic profiles of dogs (Nicholson et al. 2007) obtained using NMR-based metabolomics strategy, which showed that changes in metabolomic profiles were dominated by age, with only subtle effects produced by CR. However, this CR manipulation was only 25 % reduction from controls compared with mice in our study subjected to 40 % CR. Regardless of the metabolomics strategy used or biological fluid analyzed, the common observation among all metabolomics studies is that CR is associated with lipid and fatty acid metabolism.
Two general limitations of the current state of metabolomics technology are the lack of comprehensive annotated endogenous metabolite databases to aid in identification of as many metabolites as possible and the availability of pure compounds for validation and absolute quantification of identified metabolites. With the growth in the number of metabolomics researchers, both the databases and availability of synthetic compounds is expected to improve in the near future. Definitive identification of as many metabolites as possible will allow more detailed biological interpretation. In addition, another limitation of the current study was that we analyzed only two age groups, 3 and 26 months. Since the 3-month group can be considered mature but still very young, the study would have been strengthened if older mice, e.g., 6 months, could have been examined. Future studies can overcome this limitation by examining three or more age groups to represent a more complete lifespan perspective.
In conclusion, we were able to employ a MS-based global and targeted metabolomics approach to investigate serum metabolomic profiles related to CR and aging. This approach allowed the determination of discriminatory metabolites which were used to identify the metabolic pathways implicated in CR. This report does not intend to be a comprehensive metabolomic analysis of aging and CR, but rather our objective is to describe a methodology with potential for conducting larger scale studies. Identification of differentiating features without definitive identification is relatively straightforward and can be used to distinguish between various sample types and to evaluate CR mimetics. Because the serum metabolome is comprised of the sum of changes from all different tissues, our future studies will focus on use of this methodology to identify tissue specific alterations due to CR and aging. These future studies will also include investigation of effect of CR and aging across various mice strains and age groups.
Electronic supplementary material
(PDF 82 kb)
Acknowledgements
This work was supported by the funding from the Pennington Biomedical Research Foundation. VDD was supported in part by the NIH grants (R01AG31797, R01DK090556) and the Coypu Foundation.
References
- Anderson RM, Weindruch R. Metabolic reprogramming, caloric restriction and aging. Trends Endocrinol Metab. 2010;21:134–141. doi: 10.1016/j.tem.2009.11.005. [DOI] [PMC free article] [PubMed] [Google Scholar]
- Barderas MG, Laborde CM, Posada M, de la Cuesta F, Zubiri I, Vivanco F, Alvarez-Llamas G. Metabolomic profiling for identification of novel potential biomarkers in cardiovascular diseases. J Biomed Biotechnol. 2011;2011:790132. doi: 10.1155/2011/790132. [DOI] [PMC free article] [PubMed] [Google Scholar]
- Bateman KP, Castro-Perez J, Wrona M, Shockcor JP, Yu K, Oballa R, Nicoll-Griffith DA. MSE with mass defect filtering for in vitro and in vivo metabolite identification. Rapid Commun Mass Spectrom. 2007;21:1485–1496. doi: 10.1002/rcm.2996. [DOI] [PubMed] [Google Scholar]
- Bertolotti M, Abate N, Bertolotti S, Loria P, Concari M, Messora R, Carubbi F, Pinetti A, Carulli N. Effect of aging on cholesterol 7 alpha-hydroxylation in humans. J Lipid Res. 1993;34:1001–1007. [PubMed] [Google Scholar]
- Cutler RG, Mattson MP. Sphingomyelin and ceramide as regulators of development and lifespan. Mech Ageing Dev. 2001;122:895–908. doi: 10.1016/S0047-6374(01)00246-9. [DOI] [PubMed] [Google Scholar]
- Denery JR, Nunes AA, Dickerson TJ. Characterization of differences between blood sample matrices in untargeted metabolomics. Anal Chem. 2011;83:1040–1047. doi: 10.1021/ac102806p. [DOI] [PubMed] [Google Scholar]
- Dunn WB, Broadhurst D, Begley P, Zelena E, Francis-McIntyre S, Anderson N, Brown M, Knowles JD, Halsall A, Haselden JN, Nicholls AW, Wilson ID, Kell DB, Goodacre R. Procedures for large-scale metabolic profiling of serum and plasma using gas chromatography and liquid chromatography coupled to mass spectrometry. Nat Protoc. 2011;6:1060–1083. doi: 10.1038/nprot.2011.335. [DOI] [PubMed] [Google Scholar]
- Einarsson K, Nilsell K, Leijd B, Angelin B. Influence of age on secretion of cholesterol and synthesis of bile acids by the liver. N Engl J Med. 1985;313:277–282. doi: 10.1056/NEJM198508013130501. [DOI] [PubMed] [Google Scholar]
- Farooqui AA, Horrocks LA, Farooqui T. Deacylation and reacylation of neural membrane glycerophospholipids. J Mol Neurosci. 2000;14:123–135. doi: 10.1385/JMN:14:3:123. [DOI] [PubMed] [Google Scholar]
- Ferbeyre G. Bile acids in the fountain of youth. Aging. 2010;2:383–384. doi: 10.18632/aging.100169. [DOI] [PMC free article] [PubMed] [Google Scholar]
- Ferland G, Tuchweber B, Perea A, Yousef IM. Effect of aging and dietary restriction on bile acid metabolism in rats. Lipids. 1989;24:842–848. doi: 10.1007/BF02535757. [DOI] [PubMed] [Google Scholar]
- Fiehn O. Metabolomics—the link between genotypes and phenotypes. Plant Mol Biol. 2002;48:155–171. doi: 10.1023/A:1013713905833. [DOI] [PubMed] [Google Scholar]
- Fontana L, Partridge L, Longo VD. Extending healthy life span—from yeast to humans. Science. 2010;328:321–326. doi: 10.1126/science.1172539. [DOI] [PMC free article] [PubMed] [Google Scholar]
- Fu C, Wang T, Wang Y, Chen X, Jiao J, Ma F, Zhong M, Bi K. Metabonomics study of the protective effects of green tea polyphenols on aging rats induced by d-galactose. J Pharm Biomed Anal. 2011;55:1067–1074. doi: 10.1016/j.jpba.2011.03.011. [DOI] [PubMed] [Google Scholar]
- Gems D. Long-lived dwarf mice: are bile acids a longevity signal? Aging Cell. 2007;6:421–423. doi: 10.1111/j.1474-9726.2007.00309.x. [DOI] [PubMed] [Google Scholar]
- Granger JH, Williams R, Lenz EM, Plumb RS, Stumpf CL, Wilson ID. A metabonomic study of strain- and age-related differences in the Zucker rat. Rapid Commun Mass Spectrom. 2007;21:2039–2045. doi: 10.1002/rcm.3059. [DOI] [PubMed] [Google Scholar]
- Han X, Cheng H, Mancuso DJ, Gross RW. Caloric restriction results in phospholipid depletion, membrane remodeling, and triacylglycerol accumulation in murine myocardium. Biochemistry. 2004;43:15584–15594. doi: 10.1021/bi048307o. [DOI] [PubMed] [Google Scholar]
- Heilbronn LK, de Jonge L, Frisard MI, DeLany JP, Larson-Meyer DE, Rood J, Nguyen T, Martin CK, Volaufova J, Most MM, Greenway FL, Smith SR, Deutsch WA, Williamson DA, Ravussin E. Effect of 6-month calorie restriction on biomarkers of longevity, metabolic adaptation, and oxidative stress in overweight individuals: a randomized controlled trial. JAMA. 2006;295:1539–1548. doi: 10.1001/jama.295.13.1539. [DOI] [PMC free article] [PubMed] [Google Scholar]
- Huang CC, Lin WT, Hsu FL, Tsai PW, Hou CC. Metabolomics investigation of exercise-modulated changes in metabolism in rat liver after exhaustive and endurance exercises. Eur J Appl Physiol. 2010;108:557–566. doi: 10.1007/s00421-009-1247-7. [DOI] [PubMed] [Google Scholar]
- Ikeno Y, Hubbard GB, Lee S, Richardson A, Strong R, Diaz V, Nelson JF. Housing density does not influence the longevity effect of calorie restriction. J Gerontol A Biol Sci Med Sci. 2005;60:1510–1517. doi: 10.1093/gerona/60.12.1510. [DOI] [PubMed] [Google Scholar]
- Jiang XC, Goldberg IJ, Park TS. Sphingolipids and cardiovascular diseases: lipoprotein metabolism, atherosclerosis and cardiomyopathy. Adv Exp Med Biol. 2011;721:19–39. doi: 10.1007/978-1-4614-0650-1_2. [DOI] [PubMed] [Google Scholar]
- Kim IY, Jung J, Jang M, Ahn YG, Shin JH, Choi JW, Sohn MR, Shin SM, Kang DG, Lee HS, Bae YS, Ryu do H, Seong JK, Hwang GS. 1 H NMR-based metabolomic study on resistance to diet-induced obesity in AHNAK knock-out mice. Biochem Biophys Res Commun. 2010;403:428–434. doi: 10.1016/j.bbrc.2010.11.048. [DOI] [PubMed] [Google Scholar]
- Kristal BS, Shurubor YI. Metabolomics: opening another window into aging. Sci Aging Knowl Environ. 2005;2005:pe19. doi: 10.1126/sageke.2005.26.pe19. [DOI] [PubMed] [Google Scholar]
- Kristal BS, Shurubor YI, Kaddurah-Daouk R, Matson WR. Metabolomics in the study of aging and caloric restriction. Methods Mol Biol. 2007;371:393–409. doi: 10.1007/978-1-59745-361-5_25. [DOI] [PubMed] [Google Scholar]
- Laganiere S, Yu BP. Modulation of membrane phospholipid fatty acid composition by age and food restriction. Gerontology. 1993;39:7–18. doi: 10.1159/000213509. [DOI] [PubMed] [Google Scholar]
- Lawton KA, Berger A, Mitchell M, Milgram KE, Evans AM, Guo L, Hanson RW, Kalhan SC, Ryals JA, Milburn MV. Analysis of the adult human plasma metabolome. Pharmacogenomics. 2008;9:383–397. doi: 10.2217/14622416.9.4.383. [DOI] [PubMed] [Google Scholar]
- Lee CK, Allison DB, Brand J, Weindruch R, Prolla TA. Transcriptional profiles associated with aging and middle age-onset caloric restriction in mouse hearts. Proc Natl Acad Sci USA. 2002;99:14988–14993. doi: 10.1073/pnas.232308999. [DOI] [PMC free article] [PubMed] [Google Scholar]
- Lewis GD, Farrell L, Wood MJ, Martinovic M, Arany Z, Rowe GC, Souza A, Cheng S, McCabe EL, Yang E, Shi X, Deo R, Roth FP, Asnani A, Rhee EP, Systrom DM, Semigran MJ, Vasan RS, Carr SA, Wang TJ, Sabatine MS, Clish CB, Gerszten RE. Metabolic signatures of exercise in human plasma. Sci Transl Med. 2010;2:33ra37. doi: 10.1126/scitranslmed.3001006. [DOI] [PMC free article] [PubMed] [Google Scholar]
- Lu Y, Jiye A, Wang G, Hao H, Huang Q, Yan B, Zha W, Gu S, Ren H, Zhang Y, Fan X, Zhang M, Hao K. Gas chromatography/time-of-flight mass spectrometry based metabonomic approach to differentiating hypertension- and age-related metabolic variation in spontaneously hypertensive rats. Rapid Commun Mass Spectrom. 2008;22:2882–2888. doi: 10.1002/rcm.3670. [DOI] [PubMed] [Google Scholar]
- Masoro EJ. Overview of caloric restriction and ageing. Mech Ageing Dev. 2005;126:913–922. doi: 10.1016/j.mad.2005.03.012. [DOI] [PubMed] [Google Scholar]
- Mellert W, Kapp M, Strauss V, Wiemer J, Kamp H, Walk T, Looser R, Prokoudine A, Fabian E, Krennrich G, Herold M, van Ravenzwaay B. Nutritional impact on the plasma metabolome of rats. Toxicol Lett. 2011;207:173–181. doi: 10.1016/j.toxlet.2011.08.013. [DOI] [PubMed] [Google Scholar]
- Mishur RJ, Rea SL. Applications of mass spectrometry to metabolomics and metabonomics: detection of biomarkers of aging and of age-related diseases. Mass Spectrom Rev. 2012;31:70–95. doi: 10.1002/mas.20338. [DOI] [PubMed] [Google Scholar]
- Nagrath D, Caneba C, Karedath T, Bellance N. Metabolomics for mitochondrial and cancer studies. Biochim Biophys Acta. 2011;1807:650–663. doi: 10.1016/j.bbabio.2011.03.006. [DOI] [PubMed] [Google Scholar]
- Nicholson JK, Lindon JC, Holmes E. 'Metabonomics': understanding the metabolic responses of living systems to pathophysiological stimuli via multivariate statistical analysis of biological NMR spectroscopic data. Xenobiotica. 1999;29:1181–1189. doi: 10.1080/004982599238047. [DOI] [PubMed] [Google Scholar]
- Nicholson JK, Wang YL, Lawler D, Larson B, Ramadan Z, Kochhar S, Holmes E. Metabonomic investigations of aging and caloric restriction in a life-long dog study. J Proteome Res. 2007;6:1846–1854. doi: 10.1021/pr060685n. [DOI] [PubMed] [Google Scholar]
- Omodei D, Fontana L. Calorie restriction and prevention of age-associated chronic disease. FEBS Lett. 2011;585:1537–1542. doi: 10.1016/j.febslet.2011.03.015. [DOI] [PMC free article] [PubMed] [Google Scholar]
- Parini P, Angelin B, Rudling M. Cholesterol and lipoprotein metabolism in aging: reversal of hypercholesterolemia by growth hormone treatment in old rats. Arterioscler Thromb Vasc Biol. 1999;19:832–839. doi: 10.1161/01.ATV.19.4.832. [DOI] [PubMed] [Google Scholar]
- Petkova DH, Momchilova AB, Koumanov KS. Age-related changes in rat liver plasma membrane phospholipase A2 activity. Exp Gerontol. 1986;21:187–193. doi: 10.1016/0531-5565(86)90072-0. [DOI] [PubMed] [Google Scholar]
- Portero-Otin M, Bellmunt MJ, Ruiz MC, Barja G, Pamplona R. Correlation of fatty acid unsaturation of the major liver mitochondrial phospholipid classes in mammals to their maximum life span potential. Lipids. 2001;36:491–498. doi: 10.1007/s11745-001-0748-y. [DOI] [PubMed] [Google Scholar]
- Racette SB, Weiss EP, Villareal DT, Arif H, Steger-May K, Schechtman KB, Fontana L, Klein S, Holloszy JO. One year of caloric restriction in humans: feasibility and effects on body composition and abdominal adipose tissue. J Gerontol A Biol Sci Med Sci. 2006;61:943–950. doi: 10.1093/gerona/61.9.943. [DOI] [PMC free article] [PubMed] [Google Scholar]
- Rezzi S, Ramadan Z, Fay LB, Kochhar S. Nutritional metabonomics: applications and perspectives. J Proteome Res. 2007;6:513–525. doi: 10.1021/pr060522z. [DOI] [PubMed] [Google Scholar]
- Rochon J, Bales CW, Ravussin E, Redman LM, Holloszy JO, Racette SB, Roberts SB, Das SK, Romashkan S, Galan KM, Hadley EC, Kraus WE. Design and conduct of the CALERIE study: comprehensive assessment of the long-term effects of reducing intake of energy. J Gerontol A Biol Sci Med Sci. 2011;66:97–108. doi: 10.1093/gerona/glq168. [DOI] [PMC free article] [PubMed] [Google Scholar]
- Roux AE, Chartrand P. Bile acids extend longevity beyond calorie restriction. Aging. 2010;2:385–386. doi: 10.18632/aging.100175. [DOI] [PMC free article] [PubMed] [Google Scholar]
- Selman C, Kerrison ND, Cooray A, Piper MD, Lingard SJ, Barton RH, Schuster EF, Blanc E, Gems D, Nicholson JK, Thornton JM, Partridge L, Withers DJ. Coordinated multitissue transcriptional and plasma metabonomic profiles following acute caloric restriction in mice. Physiol Genomics. 2006;27:187–200. doi: 10.1152/physiolgenomics.00084.2006. [DOI] [PubMed] [Google Scholar]
- Smith DL, Jr, Nagy TR, Allison DB. Calorie restriction: what recent results suggest for the future of ageing research. Eur J Clin Invest. 2010;40:440–450. doi: 10.1111/j.1365-2362.2010.02276.x. [DOI] [PMC free article] [PubMed] [Google Scholar]
- Suhre K, Schmitt-Kopplin P. MassTRIX: mass translator into pathways. Nucleic Acids Res. 2008;36:W481–W484. doi: 10.1093/nar/gkn194. [DOI] [PMC free article] [PubMed] [Google Scholar]
- Tahara S, Matsuo M, Kaneko T. Age-related changes in oxidative damage to lipids and DNA in rat skin. Mech Ageing Dev. 2001;122:415–426. doi: 10.1016/S0047-6374(00)00257-8. [DOI] [PubMed] [Google Scholar]
- Vandanmagsar B, Youm YH, Ravussin A, Galgani J, Stadler K, Mynatt RL, Ravussin E, Stephens JM, Dixit VD. The NLRP3 inflammasome instigates obesity-induced inflammation and insulin resistance. Nat Med. 2011;17:179–188. doi: 10.1038/nm.2279. [DOI] [PMC free article] [PubMed] [Google Scholar]
- Walton KA, Cole AL, Yeh M, Subbanagounder G, Krutzik SR, Modlin RL, Lucas RM, Nakai J, Smart EJ, Vora DK, Berliner JA. Specific phospholipid oxidation products inhibit ligand activation of Toll-like receptors 4 and 2. Arterioscler Thromb Vasc Biol. 2003;23:1197–1203. doi: 10.1161/01.ATV.0000079340.80744.B8. [DOI] [PubMed] [Google Scholar]
- Williams RE, Lenz EM, Lowden JS, Rantalainen M, Wilson ID. The metabonomics of aging and development in the rat: an investigation into the effect of age on the profile of endogenous metabolites in the urine of male rats using 1 H NMR and HPLC-TOF MS. Mol Biosyst. 2005;1:166–175. doi: 10.1039/b500852b. [DOI] [PubMed] [Google Scholar]
- Wishart DS. Applications of metabolomics in drug discovery and development. Drugs R&D. 2008;9:307–322. doi: 10.2165/00126839-200809050-00002. [DOI] [PubMed] [Google Scholar]
- Yan S, Wu B, Lin Z, Jin H, Huang J, Yang Y, Zhang X, Shen Z, Zhang W. Metabonomic characterization of aging and investigation on the anti-aging effects of total flavones of Epimedium. Mol Biosyst. 2009;5:1204–1213. doi: 10.1039/b816407j. [DOI] [PubMed] [Google Scholar]
- Yang H, Youm YH, Dixit VD. Inhibition of thymic adipogenesis by caloric restriction is coupled with reduction in age-related thymic involution. J Immunol. 2009;183:3040–3052. doi: 10.4049/jimmunol.0900562. [DOI] [PMC free article] [PubMed] [Google Scholar]
- Yang H, Pang W, Lu H, Cheng D, Yan X, Cheng Y, Jiang Y. Comparison of metabolic profiling of cyanidin-3-O-galactoside and extracts from blueberry in aged mice. J Agric Food Chem. 2011;59:2069–2076. doi: 10.1021/jf1033619. [DOI] [PubMed] [Google Scholar]
- Youm YH, Kanneganti TD, Vandanmagsar B, Zhu X, Ravussin A, Adijiang A, Owen JS, Thomas MJ, Francis J, Parks JS, Dixit VD. The NLRP3 inflammasome promotes age-related thymic demise and immunosenescence. Cell Rep. 2012;1:56–68. doi: 10.1016/j.celrep.2011.11.005. [DOI] [PMC free article] [PubMed] [Google Scholar]
- Zhang Y, Yan S, Gao X, Xiong X, Dai W, Liu X, Li L, Zhang W, Mei C (2011) Analysis of urinary metabolic profile in aging rats undergoing caloric restriction. Aging Clin Exp Res. doi:10.3275/7519 [DOI] [PubMed]
Associated Data
This section collects any data citations, data availability statements, or supplementary materials included in this article.
Supplementary Materials
(PDF 82 kb)