Abstract
Exposure to asbestos fibers increases the risk of mesothelioma in humans. One hypothetical carcinogenic mechanism is that asbestos fibers may directly induce mutations in mesothelial cells. Although the uptake of asbestos fibers by mesothelial cells is recognized, methods for the quantification of the uptake have not been well established. In the present study, we evaluated two distinct methods, using crocidolite fibers and MeT5A mesothelial cells. One method is histological evaluation using the cell-block technique, which allows for the direct cross-sectional observation of cells and fibers. We found the bright field observation with ×1000 magnification (oil-immersion) of the sample with Kernechtrot staining was most suitable for this purpose. The other method is flow cytometric analysis, which permits the evaluation of a much larger number of cells. We observed that the side scatter (SSC) increased with the intracellular fibers, and that the “mean SSC ratio (treated/control)” was useful for quantification. We could collect the cells with abundant internalized crocidolite fibers by sorting. Results of the two methodologies were correlated well in the experiments. The quantities of internalized fibers increased with incubation time and loaded dosage, but they were inversely associated with cellular density in culture.
Keywords: flow cytometry, cell-block, crocidolite, endocytosis, quantitative assessment
Introduction
Asbestos is a naturally occurring mineral that is conventionally divided into two mineralogic groups: the serpentine group, which consists only of chrysotile (white asbestos), and the amphiboles, which include crocidolite (blue asbestos), amosite (brown asbestos), tremolite, anthophyllite, and actinolite. Among the amphiboles, only crocidolite and amosite have been widely utilized.(1) Crocidolite fibers are somewhat brittle but are generally harder and more flexible than fibers of the other amphibole varieties. These straight, needle-like fibers are easily inhaled and will remain in the lungs. Indeed, crocidolite is known to be the most hazardous of all three of the principal commercial types of asbestos (chrysotile, amosite, crocidolite).(2) The associations between asbestos exposure and mesothelioma or lung cancer have been well established in numerous epidemiological investigations.(3,4) Pleural and peritoneal mesotheliomas were reported to be associated with occupational exposures to crocidolite, amosite, and chrysotile. Mesothelioma may also occur among individuals living in the neighborhoods of asbestos factories or crocidolite mines and in persons living with asbestos workers.(5)
To date, three hypotheses regarding the pathogenesis of asbestos-induced malignant mesothelioma have been proposed: (i) the “oxidative stress theory”, (ii) the “chromosome tangling theory”, and (iii) the “theory of adsorption of many specific proteins as well as carcinogenic molecules”.(1) The “chromosome tangling theory” suggests that asbestos fibers enter both the cytoplasm and the nucleus of mesothelial cells and can tangle with chromosomes during cell division. This theory relies on the fact that asbestos fibers (both crocidolite and chrysotile) enter mesothelial cells, a phenomenon that has been observed both in vivo and in vitro.(6–9) Regarding the “oxidative stress theory”, asbestos is known to adsorb DNA and generate 8-hydroxy-2'-deoxyguanosine (8-OHdG) on its surface regardless of its iron content,(10) and it has been demonstrated that internalized crocidolite fibers cause intracellular oxidation and induce DNA strand breaks in mesothelial cells.(11)
In general, foreign bodies of fibrous shape can enter cells via several types of internalization pathways, including penetration without active cellular processes. With respect to crocidolite fibers in particular, it is known that they enter cells being covered by vesicular membrane structures, and F-actin and Rab5A assembly at the fiber has also been observed.(12,13) These findings indicate that crocidolite fibers enter cells by endocytosis.
Crocidolite uptake by mesothelial cells has been regarded as difficult to quantify because of the difficulty in identifying intracellular fibers and distinguishing these fibers from extracellular fibers that lie either atop or underneath the examined cells. And because of this difficulty, the study of the role of crocidolite uptake has been quite limited.(11) In the present study, we evaluated two different methodologies for the quantitative evaluation of crocidolite uptake: the cell-block technique and flow cytometric analysis. With respect to flow cytometry, the side scatter (SSC) parameter has been reported to be useful for detecting nanoparticles in cells.(14,15) In the previous study, we demonstrated that this parameter was also useful for asbestos detection (in its crocidolite, amosite, and chrysotile forms).(12) Here, we studied and established the usefulness of these two methods for the quantitative evaluation of crocidolite uptake by mesothelial cells.
Materials and Methods
Materials
Crocidolite was obtained from the Union for International Cancer Control (UICC; Geneva, Switzerland) and suspended in normal saline (NS) at a concentration of 5 mg/ml. The fibers were sonicated for 1 h and forcibly dispersed by drawing them in and out through a 21-gauge needle attached to a 5–10 ml syringe.
Cell culture and preparation
The MeT5A cell line was obtained from the American Type Culture Collection (Manassas, VA). MeT5A cells were maintained in Medium 199 containing 0.685 mM L-glutamine supplemented with 2.2 g/L sodium bicarbonate, 10 ng/ml epidermal growth factor, 400 nM hydrocortisone, 870 nM human recombinant insulin, 25 mM HEPES, Trace Elements B liquid from Mediatech (Manassas, VA) and 10% FBS under 5% CO2 in air at 37°C.
The incubation time with crocidolite (1, 4 and 24 h), loading crocidolite dosage (1, 3, 5, 10 and 20 µg/cm2), and density of cells (20, 30, 50, 70 and 90%) were varied in each subsequent experiment, while the followings were used as standard condition: (1) MeT5A cells were plated at 2 × 10⁴ cells/cm2 in 6-cm dishes 24 h prior to the incubation with crocidolite, (2) then the cells were incubated with 5 µg/cm2 crocidolite fibers for 2 h in the Medium 199 with 10% serum with the same ingredients described above.
After the incubation with the fibers, the cells were washed 3 times in phosphate-buffered saline (PBS) (D-PBS(−); Wako Pure Chem. Ind. Ltd., Osaka, Japan), and detached with 2.5 mg/ml trypsin and 1 mM EDTA, and then resuspended in the medium (for cell-block) or PBS.
Cell-block technique
To prepare a cell-block sample, we centrifuged the cells that had been resuspended in the medium at 800 rpm (120 × g) for 5 min and replaced the supernatant liquid with 10% neutral buffered formalin (NBF). Next, the cells were embedded in paraffin to be handled as a routine tissue block and sectioned at a thickness of 4 µm. The cell-block sections were stained with hematoxylin-eosin (HE) or Kernechtrot. Kernechtrot-stained sections were used for evaluation (cell counting).
Light microscopy
We used the Olympus BX51 microscope equipped with a UPLFLN 100XOI2 (Olympus, NA = 1.3–0.6, Tokyo, Japan) oil immersion objective. In dark field microscopy (DFM), an oil immersion dark-field condenser U-DCW (Olympus, up to NA 1.2) was used for observation at ×1000 magnification (oil immersion).
As for evaluation with bright field microscopy (BFM), the numbers of cells were counted in 3 randomly selected areas of high power field (HPF) (oil-immersion, ×1000) in each stained section of cell-block specimens, and only clearly identified straight fiber bundles with dark color were taken into account. In each experiment, we classified the cells into the following categories: (1) cells without crocidolite, (2) cells that included less than 5 bundles of crocidolite fibers, and (3) cells that included either 5 or more bundles of crocidolite fibers or clumps of crocidolite. Finally, the numbers of cells in each category were expressed as percentages of the total number of counted cells.
Transmission electron microscopy
Transmission electron microscopy (TEM) images were recorded using a JEM-1400EX transmission electron microscope (JEOL Ltd., Tokyo, Japan) at an acceleration voltage of 100 kV. Ultrathin sections (85 nm) were prepared in epoxy resin by a Reichert ULTRACUTS at ambient temperature. The sections were transferred from water to 200-mesh Cu grids.
Flow cytometry
For flow cytometry, the cells were placed on ice until the analysis. A FACS Calibur (BD Biosciences, San Jose, CA) equipped with a 15-mW, air-cooled argon ion laser excitation light source (488 nm) was used in all of the experiments except for sorting the cells.
In the experiments using a FACS Calibur, all of the observations were obtained at a low flow rate, because the flow rate affects the measurements of flow cytometry. The voltage of the forward scatter (FSC) photodiode detector was set to E-1 with the amplification gain of 7.50 or 8.50 to ensure that all of the signals could be depicted on the data plot. The voltage of the photomultiplier tube power supply for SSC was set to 300 V with the amplification gain as 1.00. Both FSC and SSC were acquired with linear amplification as height signals. The data acquisition and analysis were performed using the Cell-Quest software package (BD Biosciences). The data acquisition stopped when 10,000 events were counted, and the mean of the SSC values was calculated and represented as the “mean SSC ratio (treated/control)”, which was the ratio to the mean of the SSC of the control sample within a range of FSC>200. In each analysis by flow cytometry, we prepared a control sample. The control cells were plated at 2 × 10⁴ cells/cm2 one day before the flow cytometric analysis and grown under the same conditions as the experimental samples of cells.
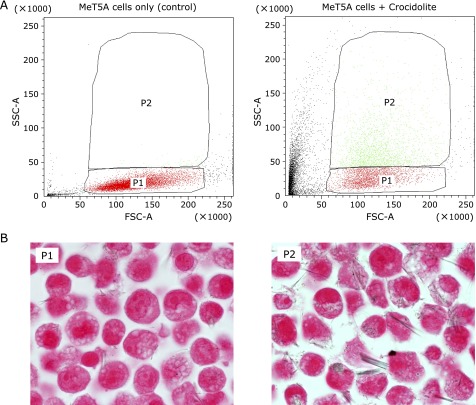
We performed cell-sorting of the MeT5A cells using a FACS Aria II (BD Bioscience). The applied crocidolite dosage was 20 µg/cm2, whereas the other conditions were the same as the standard condition. Data were acquired in linear scale as area signals. Cells with SSC of normal level were defined by gate P1, and cells with increased SSC were defined by gate P2. The cells within gates P1 and P2 were sorted into conical tubes, and made into cell-blocks.
Statistical analysis
Pearson product-moment correlation analysis was performed to evaluate the relationship between the SSC and the loading dosage of crocidolite or the density of the cells. The significances of the correlation coefficients were evaluated by Student’s t tests. p<0.01 was considered statistically significant.
Results
Crocidolite fibers are best observed at ×1000 magnification (bright field, oil immersion) in Kernechtrot staining with light microscopy
We performed cell preparation under the standard conditions described in the Materials and Methods section, and produced cell-block specimens of these cells (Fig. 1A, B, C and D) and the control cells without crocidolite (Fig. 1E and F). We found that crocidolite fibers inside the cells were more easily detected with Kernechtrot staining than with routine HE staining (Fig. 1A and B), because crocidolite fibers with dark color contrasted better on the pink background of Kernechtrot staining than on the dark-purple background of HE staining. In comparison to DFM at the same magnification (×1000, oil immersion), identification of fibers inside cells with BFM was as easy and furthermore counting the number of intracellular fibers and separation of the intracellular fibers from the extracellular ones were easier in BFM with Kernechtrot staining (Fig. 1B, C and D). In DFM, crocidolite fibers contrasted better, but cell boundaries were more obscure, and sometimes cell boundaries appeared bright, which could be mistaken as fibers. (Fig. 1E and F).
Fig. 1.
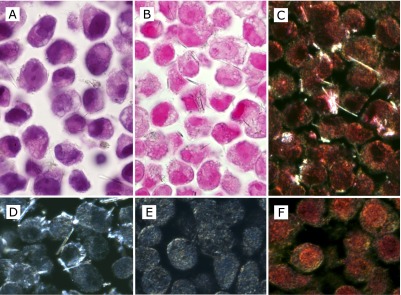
The cell-block sections of MeT5A cells with uptake of crocidolite fibers. Images were taken at ×1000 magnification (oil-immersion). (A, B, C and D) MeT5A cells at 70% confluence were incubated with 5 µg/cm2 crocidolite for 2 h. (E and F) MeT5A cells without crocidolite. Compared with routine HE staining (A), crocidolite fibers can be identified more easily by Kernechtrot staining (B) in bright field observation. By observing the same area of the sample with Kernechtrot staining, crocidolite fibers contrasted better in dark field observation (C), but for identification and counting of intracellular fibers, dark field observation appeared not to have enough advantage even by using unstained sections (D), partly because MeT5Acells themselves without crocidolite fibers showed focal brightness, especially nearby plasma membrane both in the unstained section (E) and in the section with Kernechtrot staining (F).
Transmission electron microscopy revealed that most of the crocidolite fibers formed bundles of various sizes
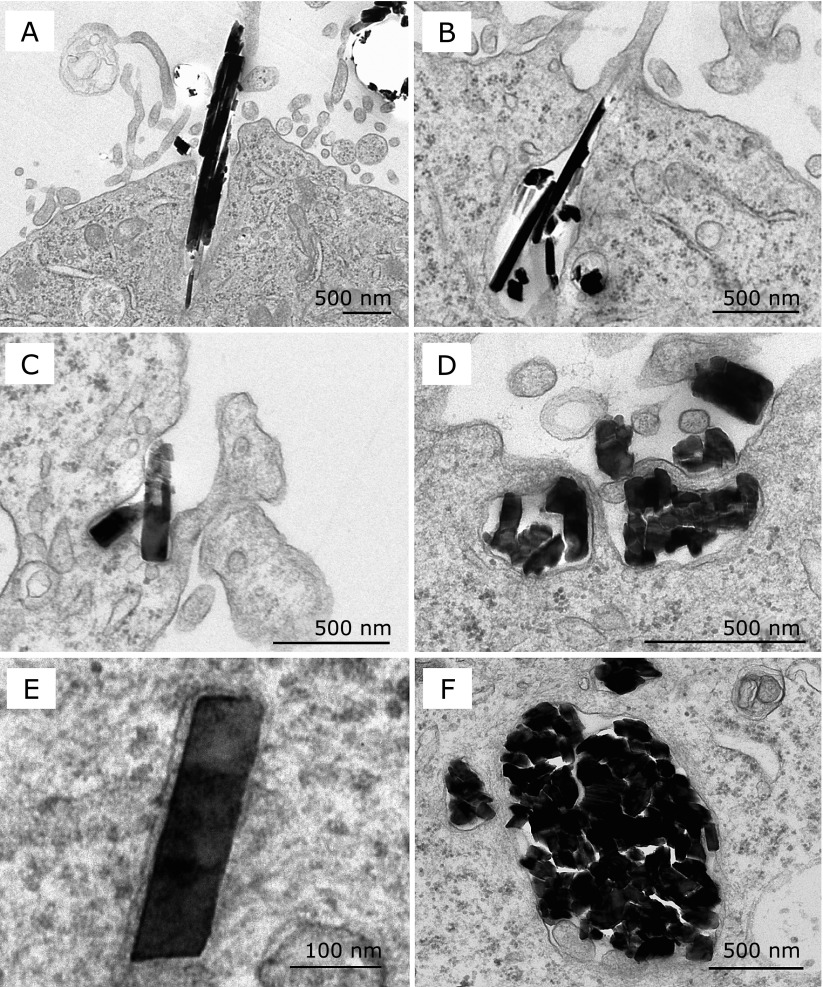
We performed cell preparation under the standard condition described in the Materials and Methods section, and observed them with TEM (Fig. 2). We found that most of the crocidolite fibers formed bundles at the uptake by mesothelial cells (Fig. 2 A, B, D and F). Some bundles consisted of a few fibers, and others consisted of dozens of fibers. It was difficult to count the exact number of fibers included in each bundle, because fibers were so close and overlapped that it was difficult to separate them from one another. Both fiber bundles and individual fibers were engulfed by mesothelial cells at the cell surface with abundant microvilli, followed by the invagination of plasma membrane around them (Fig. 2A, B, C and D). Thereafter, they were present within the membrane-bound vesicles in the cytoplasm (Fig. 2E and F). The results were consistent with those by light microscopy (Fig. 1A, B, C and D).
Fig. 2.
Transmission electron microscopic images of crocidolite fibers engulfed by MeT5A cells. MeT5A cells at 70% confluence were incubated with 20 µg/cm2 crocidolite for 2 h. (A, B, C and D) Crocidolite fibers were engulfed by MeT5A cells from the cell surface with abundant microvilli. (E and F) Crocidolite fibers inside the cytoplasm were found within membrane-bound vesicles. Solitary fibers (C and E) and fiber bundles (shown in cross section) (D and F) appeared to have no difference in the way of entering cells. Crocidolite fibers tended to form bundles, and counting the exact number of fibers included in each bundle was difficult (A, B, D and F).
In flow cytometric analysis at the FSC threshold of 200, most of the detached crocidolite fibers were excluded
At first we performed flow cytometric analysis of the MeT5A cells without crocidolite and the crocidolite fibers separately without the FSC threshold (Fig. 3A and B). The crocidolite fibers were suspended in normal saline in a concentration of 1 mg/ml. In the analysis of the MeT5A cells incubated with crocidolite, the MeT5A cells were prepared under the standard condition, and a subset of population with small FSC values (0–200) and a variety of SSC values was identified (Fig. 3C). This subset corresponded to the crocidolite fibers that remained attached to the cell surface even after 3 washes with PBS but were thereafter detached with trypsinization and suspended to PBS. In the analysis of crocidolite fibers alone, when an amplification gain was 7.50 or 8.50, the percentage of crocidolite fibers with FSC>100 was 1.49% or 1.92%, and that with FSC>200 was 0.03% or 0.12%, respectively (Table 1). These observations suggest that 99.97% or 99.88% of crocidolite fibers can be excluded from the data with an amplification gain of 7.50 or 8.50, respectively, if the threshold value of FSC is set to 200.
Fig. 3.

The flow cytometric analysis of crocidolite fibers and MeT5A cells. (A) The cytogram of MeT5A cells without incubation with crocidolite. (B) The cytogram of crocidolite fibers alone revealed that most of these fibers displayed FSC values of less than 200. The amplification gain of the FSC photodiode detector was 8.50. (C) The cytogram without a threshold of forward scatter (FSC) included crocidolite fibers that had detached from the cell surface. To generate this cytogram, MeT5A cells at 70% confluence were incubated with 5 µg/cm2 crocidolite for 2 h.
Table 1.
The FSC distribution of crocidolite fibers according to the amplification gain of the FSC photodiode detector
| Amplification gain | 7.5 | 8.5 |
|---|---|---|
| FSC>0 | 100% | 100% |
| FSC>100 | 1.49% | 1.92% |
| FSC>150 | 0.20% | 0.47% |
| FSC>200 | 0.03% | 0.12% |
20,000 events were totally counted in each gain.
The mean SSC increased with the incubation time and the quantity of crocidolite fibers inside cells
In this experiment, the incubation times with crocidolite were varied as experimental parameters (1, 4 and 24 h), while the other conditions were the same as the standard. The cell-block data indicated that the quantity of crocidolite fibers internalized in cells increased with the incubation time (Fig. 4A and Table 2). Regarding the results of flow cytometry, the mean SSC ratio (treated/control) increased with the incubation time (Table 2), suggesting that the mean SSC ratio (treated/control) increased with the quantity of crocidolite fibers internalized in cells. The cytograms indicated that the SSC tended to be higher as the incubation time became longer; however, even after 24 h, a certain number of cells remained with little or no increase in SSC (Fig. 4B).
Fig. 4.
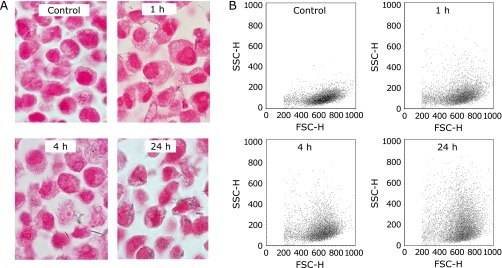
The analysis of crocidolite uptake with cell-block and flow cytometry. MeT5A cells at 70% confluence were incubated with 5 µg/cm2 crocidolite for 1, 4 and 24 h. (A) The cell-block specimen with Kernechtrot staining demonstrated that the amount of internalized fibers increased with incubation times. (B) The cytograms indicated the increase in side scatter (SSC) with increased incubation times.
Table 2.
Influence of the incubation time on the crocidolite fiber uptake examined by 2 methods
| Incubation time (h) | 1 | 4 | 24 |
|---|---|---|---|
| Mean SSC ratio (Treated/Control) | 1.277 | 1.435 | 2.07 |
| †Cells without crocidolite (%) | 31.6 | 18.9 | 9.7 |
| †Cells including less than 5 bundles of crocidolite fiber (%) | 45.8 | 42.8 | 21.8 |
| †Cells including 5 or more bundles of crocidolite fiber/crocidolite in clumps (%) | 22.6 | 38.3 | 68.5 |
| †Total counted cell numbers | 472 | 470 | 559 |
MeT5A cells were grown to 70% confluence (2 × 10⁴ cells/cm2, 24 h before) and incubated with 5 µg/cm2 crocidolite. †Counted by cell block.
The cells with increased SSC tended to contain much more crocidolite fibers than the cells showing little or no increase in SSC
As for the sorting experiment, we found few cells in gate P2 in the analysis of the control cells whereas a significant number of cells were within gate P2 in the analysis of the treated cells with crocidolite (Fig. 5A). Histological evaluation of the treated cells using the cell-block technique revealed that much larger amount of fibers were internalized in the cells within gate P2 than in the cells within gate P1 (Fig. 5B and Table 3).
Fig. 5.
Cell-sorting determined by the degree of SSC. MeT5A cells at 70% confluence were incubated with 20 µg/cm2 crocidolite for 2 h. (A) The cytograms show the presorting dot plots with gated areas (P1: SSC of normal level, P2: increased SSC). The left panel is that of the MeT5A cells without incubation with crocidolite. (B) The cell-block sections of the sorted cells to the gated areas (P1 and P2) after incubation with crocidolite. The P2-gated cells contained much more intracellular crocidolite fibers than the P1-gated cells.
Table 3.
Analysis by cell-block technique of the two demarcated areas in the cytogram of MeT5A cells after incubation with crocidolite.
| Area | P1 | P2 |
|---|---|---|
| Cells without crocidolite (%) | 47.6 | 5.7 |
| Cells including less than 5 bundles of crocidolite fiber (%) | 42.4 | 18.2 |
| Cells including 5 or more bundles of crocidolite fiber/crocidolite in clumps (%) | 10 | 76.1 |
| Total counted cell numbers | 500 | 473 |
MeT5A cells were grown to 70% confluence (2 × 10⁴ cells/cm2, 24 h before) and incubated with 20 µg/cm2 crocidolite for 2 h.
The mean SSC ratio was directly proportional to the applied dosage of crocidolite
In this experiment, the applied crocidolite dosages were varied as experimental parameters (1, 3, 5, 10 and 20 µg/cm2). Flow cytometric analysis was performed for evaluation. This experiment was performed twice under the same conditions (Test 1-1 and Test 1-2). The mean SSC ratio (treated/control) increased with the dosage of crocidolite, and the cytograms indicated a similar pattern of SSC change compared with the experiment in which the incubation times with crocidolite were varied as experimental parameters (Fig. 6A). We could observe the changes in SSC distribution visually in the light scatter histograms of the cells that had been exposed to different dosages of crocidolite (Fig. 6B). To obtain a better perspective on the significance of SSC, the mean SSC ratios (treated/control) of cells treated with 1 to 20 µg/cm2 crocidolite were displayed in a scatter diagram (Fig. 6C). Linear approximation curves (Test 1-1: y = 0.0859x + 1.2172, r² = 0.9892; Test 1-2: y = 0.1051x + 0.9051, r² = 0.9904) were calculated and drawn. The correlation coefficients (r) were 0.995 (p<0.001) in both Test 1-1 and Test 1-2; thus, the mean SSC ratio was directly proportional to the applied dosage of crocidolite (p<0.001).
Fig. 6.
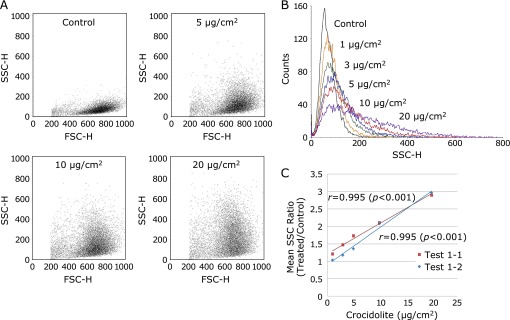
The dosage dependence of crocidolite uptake by mesothelial cells. MeT5A cells with 70% confluence were incubated with 1, 3, 5, 10 and 20 µg/cm2 crocidolite for 2 h on two separate occasions (Test 1-1 and Test 1-2). The cytograms (A) and the histogram (B) of Test 1-1 indicate as increase of SSC values with the greater applied dosages of crocidolite. (C) In both of these tests, the mean SSC ratio was proportionally correlated with the applied dosage of crocidolite (p<0.001).
The mean SSC ratio was inversely associated with cell density (% confluence)
In this experiment, the cell densities of crocidolite were varied as experimental parameters. MeT5A cells were plated at 0.7, 1.0, 1.5, 2.0 and 4.0 × 10⁴ cells/cm2, and 24 h later, at the start of the incubation with crocidolite, the cell density (% confluence) of each of these dishes was 20, 30, 50, 70 and 90%, respectively. Flow cytometric analysis was performed for evaluation. This experiment was performed twice under the same conditions (Test 2-1 and Test 2-2). The mean SSC ratio (treated/control) increased inversely with the confluence of the cells. The cytograms demonstrated similar patterns of SSC increase to the cytograms for different incubation times or varying applied crocidolite dosage (Fig. 7A). The changes of SSC distribution with respect to the cell density were described visually in the light scatter histograms (Fig. 7B). To obtain a better perspective on the magnitude of SSC, the mean SSC ratios (treated/control) of cells with 20–90% confluence were displayed in a scatter diagram (Fig. 7C). Linear approximation curves (Test 2-1: y = –0.0118x + 2.22, r² = 0.925; Test 2-2: y = –0.0098x + 2.2138, r² = 0.9814) were calculated and drawn. The correlation coefficient (r) was –0.962 (p = 0.0089) in Test 2-1, and –0.991 (p = 0.0011) in Test 2-2; thus, the mean SSC ratio was inversely associated with cell density (p<0.01).
Fig. 7.
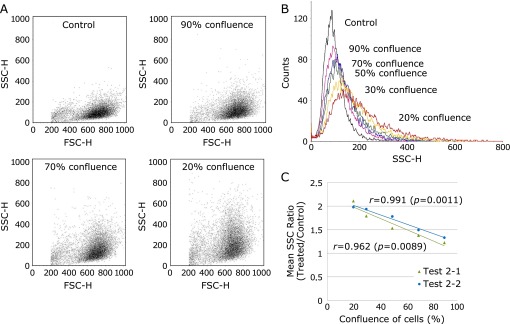
The inverse association between crocidolite uptake and cell density. MeT5A cells at confluences of 20, 30, 50, 70 and 90% were incubated with 5 µg/cm2 crocidolite for 2 h on two separate occasions (Test 2-1 and Test 2-2). The cytograms (A) and the histogram (B) of Test 2-1 indicated a decrease in SSC with the increased cell density (% confluence). (C) In both of these tests, the mean SSC ratio was inversely correlated with the confluence of cells (p<0.01).
Discussion
In the present study, we evaluated two distinct methods for quantification of crocidolite uptake by mesothelial cells: the cell-block technique and flow cytometric analysis. Most of the crocidolite fibers formed bundles with electron microscopic analysis and are expected to be recognized by BFM at ×1000 magnification (oil immersion) under Kernechtrot staining. The mean SSC ratio (treated/control) of flow cytometric analysis increased with the amount of crocidolite fibers inside the cells; this phenomenon was confirmed by the cell-block technique and the sorting experiment. We then assessed the influence of applied crocidolite dosage and density of cells on crocidolite endocytosis using flow cytometry.
Regarding the quantification of crocidolite endocytosis, several methods have been used to differentiate between intracellular and extracellular fibers. In some earlier studies, the cell membranes were labeled with DiI prior to the incubation with crocidolite, and the fibers inside the cells were determined and counted by fluorescence confocal microscopy, based on the theory that fibers internalized in cells should exhibit fluorescence because these internalized fibers were encased in a sleeve of fluorescent cell membrane.(16,17) Observation with TEM and DFM after trypsin/EDTA treatment were also performed for similar quantification purposes.(17–19)
The cell-block technique is a cross-sectional observation, and allows us to distinguish the fiber bundles inside the cells from those outside, although we have to pay attention not to misdiagnose certain artifacts such as crocidolite fibers transferred on cells during sectioning. This technique does not require expensive equipment, and cell-block samples can be applied to further experiments, such as immunohistochemistry. Crocidolite fibers are typically longer than 1 µm and possess a wide range of diameters because amphibole initially crystallizes as large crystals and subsequently disaggregates into smaller elongated crystals.(20) The diameter of crocidolite fiber is typically between 0.03 and 0.5 µm, and it is often smaller than 0.2 µm, which is usually regarded as the lowest value of resolution obtainable with conventional light microscopy. Therefore, we also tried to use DFM with which we could identify an object smaller than the lowest value of resolution, and found that DFM was not so useful as BFM of the same magnification (×1000) in this case, because of following three reasons: in DFM, (1) cell boundaries were more obscure so that differentiation between intracellular and extracellular fibers was more difficult, (2) sometimes cell boundaries or even cytoplasm appeared slightly bright and were difficult to be distinguished from the cross sectional view of fibers, (3) the effective numerical aperture (NA) was limited so that the resolution had to be lower than that in bright field observation. On the other hand, each section of cell-block sample has a thickness of approximately 4 µm; therefore, observation focusing on various depth levels can facilitate the detection of crocidolite fibers under BFM. Considering the fact that most of the crocidolite fibers formed bundles during uptake by mesothelial cells as indicated by TEM, we concluded that the cell-block technique is useful for quantification of crocidolite uptake, although we have to be aware that most of the “fibers” identified by light microscopy are actually fiber bundles.
Flow cytometry is the study of cells as they move in fluid suspension, allowing multiple measurements to be obtained for each cell. In general, FSC is considered to provide information on the size of the cell, whereas SSC is thought to reflect the internal structure of the cell. We confirmed that the cells with increased SSC tended to contain larger amount of fibers than the cells with little or no increase in SSC by cell sorting and cell-block technique. By flow cytometric analysis, a much larger number of cells can be analyzed than by other quantification methods. In the present study, we analyzed 10,000 cells per each case. This larger sample size would produce smaller sampling errors for experiments. Moreover, the number of cells that are required for an analysis is small in comparison to the number of cells required to produce cell-block specimens. However, there are some important limitations in flow cytometric analysis. For one thing, because it is an indirect method for the evaluation of crocidolite uptake, many other factors can influence FSC and SSC. For instance, smaller mitotic nuclei have been reported to show decreased SSC relative to larger interphase nuclei.(21,22) When crocidolite fibers are attached to the cell surface, SSC can increase. Therefore, it can be difficult to distinguish the fibers inside the cells from those attached on the surface of cells, even though most of the adherent fibers should have been detached theoretically after trypsin/EDTA treatment. Because of this uncertainty, the results of flow cytometric analysis should be confirmed with direct methods, such as the cell-block technique, particularly if these results are different from the initial expectations. For another thing, the practical particle size limit for SSC detection has been reported as 0.15 µm although a significant amount of crocidolite fibers show smaller diameter.(23) In fact, crocidolite fibers have enough length for SSC detection and usually form bundles, so most of them should be detected by flow cytometric analysis, even though their influence on the degree of SSC increase may sometimes depend on their intracellular position.
We proposed these two methods because of their simplicity requiring neither high-level technique nor special equipment and of their high-throughput capacity. Size limit of detection appears to be the weakest point of these methods. However, on the assumption that fibers narrower than 0.1–0.2 µm would be internalized in cells by the same mechanism with fibers wider than 0.2 µm or fiber bundles, which was supported by the present TEM observation, we believe the amount of fibers evaluated by these two methods would represent the total amount of internalized crocidolite fibers.
In the flow cytometric analysis, the mean SSC ratio (treated/control) increased linearly with the dosage of applied crocidolite; accordingly, the quantity of crocidolite inside the cells was thought as in direct proportion to the dosage of applied crocidolite within the range of 1 to 20 µg/cm2. We demonstrated that the mean SSC ratio, i.e. the quantity of crocidolite fibers inside the cells, was inversely associated with the density of the cells. In other words, the uptake of the crocidolite fibers increased as the cell density became lower. One possible explanation for this phenomenon is that lower cell densities result in wider spaces between cells, allowing cells to move more freely and encounter crocidolite fibers more frequently and thereby producing an increase in crocidolite uptake. In addition, there are certain protein receptors with expression levels that are highly dependent on cellular density in the culture dish. For example, high cellular densities produce low levels of transferrin receptor expression.(24,25) The putative receptors for crocidolite endocytosis may also possess these types of cell density-dependent properties.
In the present study, we evaluated two methods for the quantitative assessment of crocidolite uptake. One method is the histological evaluation of cell-block samples whose effectiveness was verified by DFM and TEM, and the other method is the analysis by flow cytometry which was proved to be valid by cell-block technique and cell sorting. By the flow cytometric analysis, we found that the amount of crocidolite uptake by MeT5A cells increased in proportion with incubation time and dosage of crocidolite but decreased in proportion with the density of the cells.
Acknowledgments
This study was supported by several funding sources, including Princess Takamatsu Cancer Research Fund Grant 10-24213; a Grant-in-Aid for Cancer Research from the Ministry of Health, Labour and Welfare of Japan; a Grant-in-Aid from the Ministry of Education, Culture, Sports, Science and Technology (MEXT) of Japan; a MEXT Special Coordination Funds for Promoting Science and Technology Grant; and a Grant-in-Aid from the Japan Society for the Promotion of Science Fellows (HN).
Abbreviations
- BFM
bright field microscopy
- DFM
dark field microscopy
- FBS
fetal bovine serum
- FSC
forward scatter
- HE
hematoxylin-eosin
- HPF
high power field
- NA
numerical aperture
- NBF
neutral buffered formalin
- NS
normal saline
- 8-OHdG
8-hydroxy-2'-deoxyguanosine
- PBS
phosphate-buffered saline
- SSC
the side scatter
- TEM
transmission electron microscopy
Conflict of Interest
No potential conflicts of interest were disclosed.
References
- 1.Toyokuni S. Mechanisms of asbestos-induced carcinogenesis. Nagoya J Med Sci. 2009;71:1–10. [PMC free article] [PubMed] [Google Scholar]
- 2.Hodgson JT, Darnton A. The quantitative risks of mesothelioma and lung cancer in relation to asbestos exposure. Ann Occup Hyg. 2000;44:565–601. [PubMed] [Google Scholar]
- 3.Cicioni C, London SJ, Garabrant DH, Bernstein L, Phillips K, Peters JM. Occupational asbestos exposure and mesothelioma risk in Los Angeles County: application of an occupational hazard survey job-exposure matrix. Am J Ind Med. 1991;20:371–379. doi: 10.1002/ajim.4700200309. [DOI] [PubMed] [Google Scholar]
- 4.Morabia A, Markowitz S, Garibaldi K, Wynder EL. Lung cancer and occupation: results of a multicentre case-control study. Br J Ind Med. 1992;49:721–727. doi: 10.1136/oem.49.10.721. [DOI] [PMC free article] [PubMed] [Google Scholar]
- 5.IARC. Asbestos (chrysotile, amosite, crocidolite, tremolite, actinolite, and anthophyllite) IARC Monographs on the Evaluation of Carcinogenic Risks to Humans, Vol. 100C. A Review of Human Carcinogens; Part C: Arsenic, Metals, Fibres, and Dusts. Lyon, France: 2012. pp. 219–309. [Google Scholar]
- 6.Davis JMG. An electron-microscope study of the response of mesothelial cells to the intrapleural injection of asbestos dust. Br J Exp Pathol. 1974;55:64–70. [PMC free article] [PubMed] [Google Scholar]
- 7.Fasske E. Pathogenesis of pulmonary fibrosis induced by chrysotile asbestos. Longitudinal light and electron microscopic studies on the rat model. Virchows Arch A Pathol Anat Histopathol. 1986;408:329–346. doi: 10.1007/BF00707692. [DOI] [PubMed] [Google Scholar]
- 8.Jaurand MC, Kaplan H, Thiollet J, Pinchon MC, Bernaudin JF, Bignon J. Phagocytosis of chrysotile fibers by pleural mesothelial cells in culture. Am J Pathol. 1979;94:529–538. [PMC free article] [PubMed] [Google Scholar]
- 9.Jiang L, Nagai H, Ohara H, et al. Characteristics and modifying factors of asbestos-induced oxidative DNA damage. Cancer Sci. 2008;99:2142–2151. doi: 10.1111/j.1349-7006.2008.00934.x. [DOI] [PMC free article] [PubMed] [Google Scholar]
- 10.Nagai H, Ishihara T, Lee WH, et al. Asbestos surface provides a niche for oxidative modification. Cancer Sci. 2011;102:2118–2125. doi: 10.1111/j.1349-7006.2011.02087.x. [DOI] [PMC free article] [PubMed] [Google Scholar]
- 11.Liu W, Ernst JD, Broaddus VC. Phagocytosis of crocidolite asbestos induces oxidative stress, DNA damage, and apoptosis in mesothelial cells. Am J Respir Cell Mol Biol. 2000;23:371–378. doi: 10.1165/ajrcmb.23.3.4094. [DOI] [PubMed] [Google Scholar]
- 12.Nagai H, Okazaki Y, Chew SH, et al. Diameter and rigidity of multiwalled carbon nanotubes are critical factors in mesothelial injury and carcinogenesis. Proc Natl Acad Sci USA. 2011;108:E1330–E1338. doi: 10.1073/pnas.1110013108. [DOI] [PMC free article] [PubMed] [Google Scholar]
- 13.Nagai H, Toyokuni S. Differences and similarities between carbon nanotubes and asbestos fibers during mesothelial carcinogenesis: Shedding light on fiber entry mechanism. Cancer Sci. 2012;103:1378–1390. doi: 10.1111/j.1349-7006.2012.02326.x. [DOI] [PMC free article] [PubMed] [Google Scholar]
- 14.Suzuki H, Toyooka T, Ibuki Y. Simple and easy method to evaluate uptake potential of nanoparticles in mammalian cells using a flow cytometric light scatter analysis. Environ Sci Technol. 2007;41:3018–3024. doi: 10.1021/es0625632. [DOI] [PubMed] [Google Scholar]
- 15.Zucker RM, Massaro EJ, Sanders KM, Degn LL, Boyes WK. Detection of TiO2 nanoparticles in cells by flow cytometry. Cytometry A. 2010;77:677–685. doi: 10.1002/cyto.a.20927. [DOI] [PubMed] [Google Scholar]
- 16.Pande P, Mosleh TA, Aust AE. Role of αvβ5 integrin receptor in endocytosis of crocidolite and its effect on intracellular glutathione levels in human lung epithelial (A549) cells. Toxicol Appl Pharmacol. 2006;210:70–77. doi: 10.1016/j.taap.2005.07.017. [DOI] [PubMed] [Google Scholar]
- 17.Boylan AM, Sanan DA, Sheppard D, Broaddus VC. Vitronectin enhances internalization of crocidolite asbestos by rabbit pleural mesothelial cells via the integrin αvβ5. J Clin Invest. 1995;96:1987–2001. doi: 10.1172/JCI118246. [DOI] [PMC free article] [PubMed] [Google Scholar]
- 18.Hesterberg TW, Butterick CJ, Oshimura M, Brody AR, Barrett JC. Role of phagocytosis in Syrian hamster cell transformation and cytogenetic effects induced by asbestos and short and long glass fibers. Cancer Res. 1986;46:5795–5802. [PubMed] [Google Scholar]
- 19.Kuwahara M, Kuwahara M, Verma K, Ando T, Hemenway DR, Kagan E. Asbestos exposure stimulates pleural mesothelial cells to secrete the fibroblast chemoattractant, fibronectin. Am J Respir Cell Mol Biol. 1994;10:167–176. doi: 10.1165/ajrcmb.10.2.8110473. [DOI] [PubMed] [Google Scholar]
- 20.Ahn JH, Buseck PR. Microstructures and fiber-formation mechanisms of crocidolite asbestos. Am Mineralogist. 1991;76:1467–1478. [Google Scholar]
- 21.Zucker RM, Elstein KH, Easterling RE, Massaro EJ. Flow cytometric discrimination of mitotic nuclei by right-angle light scatter. Cytometry. 1988;9:226–231. doi: 10.1002/cyto.990090307. [DOI] [PubMed] [Google Scholar]
- 22.Nüsse M, Jülch M, Geido E, et al. Flow cytometric detection of mitotic cells using the bromodeoxyuridine/DNA technique in combination with 90 degrees and forward scatter measurements. Cytometry. 1989;10:312–319. doi: 10.1002/cyto.990100310. [DOI] [PubMed] [Google Scholar]
- 23.Mariella RP, Jr, Huang Z, Langlois RG. Characterization of the sensitivity of side scatter in a flow-stream waveguide flow cytometer. Cytometry. 1999;37:160–163. doi: 10.1002/(sici)1097-0320(19991001)37:2<160::aid-cyto10>3.0.co;2-3. [DOI] [PubMed] [Google Scholar]
- 24.Larrick JW, Cresswell P. Modulation of cell surface iron transferrin receptors by cellular density and state of activation. J Supramol Struct. 1979;11:579–586. doi: 10.1002/jss.400110415. [DOI] [PubMed] [Google Scholar]
- 25.Bierings MB, Baert MRM, van Eijk HG, van Dijk JP. Regulatory signals in palacental iron uptake. In: Cedard L, Alsat E, Challier JC, Chaouat G, Malassine A, editors. Placental Communications: Biochemical, Morphological and Cellular Aspects. Vol. 199. Colloque INSERM/John Libbey Eurotext Ltd; 1990. p. 65. [Google Scholar]


