

Abstract
Stimulation of cerebral vasculature using hypercapnia has been widely used to study cerebral vascular reactivity (CVR), which can be expressed as the quantitative change in cerebral blood flow (CBF) per mm Hg change in end-tidal partial pressure of CO2 (PETCO2). We investigate whether different respiratory manipulations, with arterial spin labeling used to measure CBF, lead to consistent measures of CVR. The approaches included: (1) an automated system delivering variable concentrations of inspired CO2 for prospective targeting of PETCO2, (2) administration of a fixed concentration of CO2 leading to subject-dependent changes in PETCO2, (3) a breath-hold (BH) paradigm with physiologic modeling of CO2 accumulation, and (4) a maneuver combining breath-hold and hyperventilation. When CVR was expressed as the percent change in CBF per mm Hg change in PETCO2, methods 1 to 3 gave consistent results. The CVR values using method 4 were significantly lower. When CVR was expressed in terms of the absolute change in CBF (mL/100 g per minute per mm Hg), greater discrepancies became apparent: methods 2 and 3 gave lower absolute CVR values compared with method 1, and the value obtained with method 4 was dramatically lower. Our findings indicate that care must be taken to ensure that CVR is measured over the linear range of the CBF-CO2 dose–response curve, avoiding hypocapnic conditions.
Keywords: arterial spin labeling, cerebral vascular reactivity, functional MRI, hypercapnia
Introduction
Measurements of the cerebral blood flow (CBF) response to a stimulus may provide a useful index of cerebral vascular function, aiding in the study and diagnosis of different cerebral diseases with a vascular component.1, 2, 3 Hypercapnia (increased levels of blood CO2) is known to cause global increases in CBF,4 a phenomenon that has been exploited in the development of functional magnetic resonance imaging (fMRI) measures of cerebral vascular reactivity (CVR).5, 6, 7 To measure CVR, perfusion-weighted images are acquired during a respiratory manipulation that induces hypercapnia, with analysis of the resultant image series yielding a map of the CBF response to CO2. The fMRI technique providing the most quantitative measure of CBF is arterial spin labeling (ASL).8, 9, 10 Cerebral vascular reactivity can thus be expressed as the percentage or absolute change in CBF per mm Hg change in the end-tidal partial pressure of CO2 (PETCO2, a surrogate for arterial PCO2). In addition to providing a direct depiction of cerebral vascular function, the ASL and BOLD responses to a hypercapnic manipulation can be input to biophysical models allowing estimation of the cerebral metabolic rate of O2,11, 12 a key indicator of cerebral function.
A number of approaches have been explored for the induction of hypercapnia to measure CVR with fMRI methods. One of the most commonly adopted methods has been to administer a mixture of gases with a fixed concentration of CO2 (typically 5% to 7% by volume) diluted in atmospheric composition air.7, 13, 14 Because this approach uses a fixed concentration of inspired CO2 during all phases of the hypercapnic episode and for all experimental participants, we refer to this method as ‘fixed inspired', or FI. Methods based on administration of gas mixtures require the participant to wear a breathing mask or mouthpiece by which the inspired gases are delivered, as well as a system for controlling flow rates and alternating between normal air and the CO2/air mixture. When FI CO2 mixtures are used, the actual PETCO2 levels induced during air breathing and administration of the CO2 mixture will depend on the subject's body mass, basal metabolic rate, and minute ventilation. Moreover, accelerated breathing during hypercapnia can lead to incidental hyperoxia, which exerts a mild vasoconstrictive influence. These effects may confound CVR measurements made using the FI method.
To address the latter concerns, several groups have devised methods for prospectively targeting specific PETCO2 and PETO2 levels during different phases of hypercapnia induction. Early methods15, 16, 17 focused on maintenance of constant partial pressures using sequential rebreathing approaches, wherein subjects receive an externally administered gas up to a certain flow rate, beyond which they rebreathe expired gas. Feedback approaches have also been explored,18 although these require extremely high flow rates (e.g., 70 L/min). Slessarev et al19 have extended the sequential rebreathing approach to incorporate physiologic modeling of CO2 fluxes in the body to make predictive, breath-by-breath adjustments of inspired gases to achieve prospective and independent control of end-tidal PCO2 and PO2 at lower flow rates.
One of the simplest methods used to induce hypercapnia is to have subjects hold their breath,20 resulting in accumulation of CO2 in the blood and resultant increases in CBF. This can be performed with minimal equipment and set-up time, although it is limited to subjects who are able to understand and comply with the breath-holding instructions. This procedure also necessarily leads to a degree of hypoxia, which may confound the imaging responses observed. Moreover, since the quantitative expression of CVR requires knowledge of the change in PETCO2, which is usually measured from exhaled gas that is not available during a breath-hold, applicability has been limited. The latter difficulty has been overcome by having subjects execute a small, forced exhalation at the end of the breath-hold that is used to measure PETCO2 at the end of the maneuver.21
To date, there have been few studies comparing PETCO2-normalized estimates of CVR obtained using different respiratory manipulations, and none that have included both gas administration and breath-holding methods. A recent study by Mark et al22 showed that a commercial implementation of the sequential rebreathing system with feed-forward modeling described by Slessarev et al reduced the variability of CVR estimates compared with measurements made in the same individuals using fixed concentrations of inspired gases (the FI approach). The latter study also showed reduced fluctuations in PETO2 during hypercapnic manipulations when the sequential rebreathing approach was used.
Given that PETCO2 is necessarily monitored in any quantitative CVR study, an important question is whether retrospective normalization of flow responses produced by an uncontrolled PETCO2 excursion will give equivalent results to a similar normalization applied to data acquired during PETCO2 changes that have been prospectively controlled. To the extent that percent changes in CBF might be a linear function of PETCO2, the two approaches should be equivalent. If the ranges of PETCO2 covered by different techniques span different domains of a non linear dose–response relationship23, 24, 25, 26 however, then the apparent CVR values could differ considerably. Addressing this question was the primary aim of the present study.
Materials and methods
For this study, we scanned 10 healthy subjects (ages between 18 and 35) measuring CBF changes during 4 types of respiratory manipulation in the following order: (1) automated prospective control (PC); (2) administration of fixed concentrations of inspired gases (FI); (3) breath hold (BH); and (4) breath-holds combined with hyperventilation (HV). To control for minute ventilation, an audio metronome was used to pace the subjects' breathing. Figure 1 shows timing diagrams for the different manipulations. All subjects underwent the manipulations in a pre-session 1 week before the scanning and gave informed consent for their participation. The protocol was approved by the Comité mixte d'éthique de la recherche du Regroupement Neuroimagerie Québec.
Figure 1.

The four respiratory manipulations. In the prospective control (PC) method, the inspired gas mixture is continually modulated, allowing near step changes in PETCO2 (resembling the square blocks shown). In fixed inspired (FI), gas mixtures with fixed composition are administered during different blocks, inducing hypercapnia during periods of CO2 enrichment (the square blocks here represent the inspired concentration of CO2, not PETCO2). The breath hold (BH) method developed by the Cardiff group consists of 20-second breath-holds alternated with paced breathing (PB). The hyperventilation (HV) method uses these same short breath-holds though differently organized as to resemble the two-block design adopted in the gas manipulations. Ventilatory rate is also 50% higher than in the PB used in the other manipulations. In this figure, BH is used to denote the BH method as well as to indicate breath-hold events. PETCO2, end-tidal partial pressure of CO2.
Subjects were imaged using a 3T scanner (Siemens TIM TRIO, Siemens Medical Solutions, Erlangen, Germany) using the vendor's 32-channel head coil. Although the BH and HV methods did not require a face mask, the FI and PC methods were each implemented using a different type of mask. The scan session was therefore divided into three phases: PC, FI, and a final phase with the mask removed for BH and HV. Subjects were withdrawn from the MRI scanner for placement of the appropriate mask and monitoring equipment between phases. Each phase consisted of a simple localizer sequence, a high-resolution anatomic acquisition (MPRAGE with 1 mm3 resolution) of ∼5 minutes duration, and the functional scans with ∼10 minutes duration each. For the functional scans, we used pseudo-Continuous ASL,27, 28 with a labeling time of 1.5 secods, delay of 0.9 seconds, and repetition time/echo time of 3,000/10 ms. Slice prescription was 11 slices with 7 mm × 4 mm × 4 mm voxel resolution and 1 mm gap. Readout consisted of a GRE-EPI scheme with GRAPPA acceleration factor 2 and 7/8 partial Fourier reconstruction. Total time of the experiment was 1 hour 30 minutes.
During all functional acquisitions, subjects were paced in their breathing using metronome beeps played over headphones. Subjects breathed at a constant rate, unless they were performing a breath-hold. Instructions to perform the breath-hold consisted of a beep with different tone. During the breath-hold, the metronome beeps were paused. In the case of HV, an additional beep tone was used to signal intermittent breaths during the series of breath-holds. The ventilatory rate was set to 16 breaths per minute, comparable to the average of rates during normocapnia and hypercapnia reported by Mark et al22 for unpaced breathing. In the HV maneuver, the ventilatory rate was increased to 24 breaths per minute, deliberately inducing hypocapnia during these periods.
In the PC phase, the hypercapnic manipulation was conducted using a commercial implementation (RespirAct, Thornhill Research, Toronto, Canada) of the sequential rebreathing system with feed-forward modeling described by Slessarev et al.29 In this system, a physiologic model is used to compute a sequence of inspired gas concentrations that will result in the desired sequence of end-tidal O2 and CO2 values in a given subject. We programmed the RespirAct to increase PETCO2 by 7 mm Hg from the subjects' baseline PETCO2 during two intervals of 2 minutes:20 seconds (2 minutes:20 seconds apart) while keeping end-tidal levels of O2 unchanged throughout the manipulation. An individual's baseline PETCO2 was determined based on measurements obtained during anatomic scans while the subject was breathing air through the respiratory apparatus. Subjects were asked to follow the metronome at 16 breaths per minute during this phase and to ensure that the fresh gas bag of the breathing circuit was emptied at every breath (necessary to ensure accurate targeting of end-tidal gas levels).
In the FI phase, subjects were fitted with a non rebreathing face mask (Hudson RCI, CA, USA) and paced to breathe at 16 breaths per minute. Plastic tubing and a Y-connector were used to connect flow meters for medical air and CO2-5% (balanced with air) tanks to the circuit leading to the mask. The CO2 mixture was administered in two intervals of 2 minutes:20 seconds duration, separated by intervals of 2 minutes:20 seconds during which medical air flowed through the circuit.
In the last phase, subjects performed the breath-holding routines. First, in the BH manipulation, subjects were asked 12 times to hold their breath for 20 seconds (see Figure 1, bottom left panel). Breath-holds alternated with 30 seconds of paced breathing, in which subjects were asked to follow the metronome at 16 breaths per minute. Increases in PETCO2 were estimated by comparing the end-tidal levels from the beginning with the end of the breath-hold. To sample PETCO2 just before resumption of breathing, subjects were instructed to give a small forced exhalation at the end of each breath-hold, as described in Murphy et al.21 In the HV manipulation, there were two equal sets of six breath-holds, each with an approximate 2 minutes:20 seconds duration, and separated by 2 minutes:20 seconds of paced breathing. In each set, 20-second periods of breath holding were punctuated by single breaths (exhale–inhale) that lasted ∼3 seconds. Such compounded breath-hold blocks were interleaved with hyperventilation, during which subjects were asked to follow the metronome at 24 breaths per minute. This sequence is described in Figure 1, bottom right panel.
At the end of the session, subjects were asked to rate their discomfort during the different respiratory manipulations according to the 7-step scale proposed by Banzett et al.30
Respiratory levels of CO2 (and O2) were continuously monitored using a nasal cannula and a gas sampler/analyzer (Biopac MP150, BIOPAC Systems Inc., CA, USA), as well as comparable analyzers incorporated into the RespirAct during PC scans. The baseline levels and the amplitude of the hypercapnic response associated with each manipulation were obtained through linear modeling of the end-tidal points in the capnograph (Figure 2). Each hypercapnic stimulus was treated as an independent event block, except in HV, where the 12 breath-holds were aggregated into 2 blocks. In each manipulation, biexponential functions were used to model transition periods at the beginning and end of blocks. The model also incorporated a first-order drift term; and an offset that represented the baseline end-tidal level during that run (which is partly dependent on the rate of paced breathing). The resting ‘normal' PETCO2 levels were obtained from the evaluation of capnograph recordings obtained while subjects breathed air during unpaced breathing (e.g., during the anatomic scans that preceded the FI and BH manipulations).
Figure 2.

PETCO2 increases obtained with the modeling of end-tidal CO2 samples. The group mean±SE change is displayed over representative traces of the four different manipulations. Left to right: PC and FI on the top, and BH and HV on the bottom. In each plot, the gray oscillating trace represents the continuous sampling of CO2, and the black trace the model fitted to the PETCO2 points. The horizontal dotted lines correspond to the spontaneously arising resting PETCO2 in this subject. In the gas methods, the dashed traces connect the minimum of tidal PCO2 points, indicating the inspired gas concentration.
The PETCO2 and PETO2 values were compared during conditions, and against the normal resting levels during unpaced breathing, using a paired t-test.
Image analysis was performed primarily using the NeuroLens software package (www.neurolens.org). The ASL image series were first motion corrected. The flow series were then obtained using surround subtraction of the raw ASL images. Next, the ASL difference signal (representing CBF) was fit with a general linear model consisting of the modeled values of PETCO2 normalized to have unit amplitude, plus a third-order polynomial representing drift terms and constant offset. This fitting procedure provided maps of the estimated baseline flow signal and related increases.
To determine responses in different tissue regions, these ASL signal estimates were averaged within an ROI that consisted of a gray-matter probability mask. This mask was computed based on the high-resolution anatomic acquisitions, which were segmented for gray matter using FSL's FAST program31 and resampled to match the spatial sampling of the functional series. Average ROI responses were computed as the weighted sum of ASL parameter estimates from the general linear model fit multiplied by the gray-matter probability within each voxel, to control for partial volume effects with white matter and cerebrospinal fluid (which are assumed to exhibit little or no ASL difference signal). Average parameter estimates were converted from raw MR signal units to absolute CBF using the approach described in Wang et al.32 To exclude functional responses associated with the auditory metronome used, temporal lobe regions (containing auditory cortex) were not included in the ROI maps. In addition to the ROI analyses, group average maps of the various ASL parameters (resting CBF, absolute CO2-induced flow change, percent CO2-induced flow change) were computed by coregistration of individual maps into the MNI 152 stereotactic space.
The coupling between flow and CO2, i.e., the CO2 dose–response curve, was further explored by plotting the ASL vs. PETCO2 in the following manner: gray-matter-averaged CBF and monitored PETCO2 traces for PC, FI, and HV were binned into 30-second intervals, excluding the first 20 seconds after transitions. The BH data were binned in a different manner, using 30-second and 20-second intervals according to the stimulus design. The quantities were averaged within these temporal bins, and used to plot absolute CBF as a function of PETCO2 during each time bin. Data points from the different types of manipulation were color coded and displayed on the same axes. Data were fit using the sigmoidal model adopted by Reivich:25
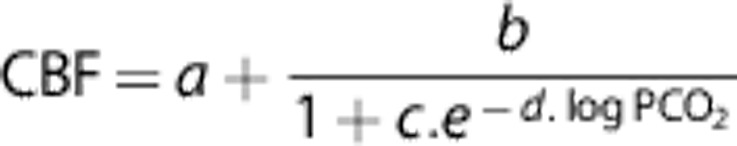 |
Results
End-Tidal Monitoring
Figure 2 shows examples of respiratory CO2 traces associated with each manipulation and respective models of the PETCO2 responses. The numerical values (mean±SE) shown on each plot correspond to the group average change in PETCO2 at the end of the manipulation (where the change is typically maximal). These estimates are also shown in a bar graph in Figure 3B. The group average changes in PETCO2 produced by the different manipulations ranged from 6.6±0.3 mm Hg (PC) to 18±1 mm Hg (HV), and differences between respective changes were generally statistically significant at P<0.05, with the exception of the pair FI and HV, for which P>0.2.
Figure 3.

Comparison of group average PETCO2 and PETO2 levels during the four different manipulations. Baseline levels on the left and size of the induced changes on the right. The black horizontal lines in the baseline plots indicate the group average value for the spontaneously arising end-tidal gas levels. Except for the pairs indicated, t-tests pointed to significant differences in both baseline and evoked change values between the various methods. The group average baseline values determined for all methods also differed significantly from the spontaneously observed end-tidal values. BH, breath hold; FI, fixed inspired; PC, prospective control; HV, hyperventilation.
Baseline PETCO2 levels are shown in Figure 3A. The baseline levels of PETCO2 associated with all four manipulations were significantly different than the ‘normal' resting values, observed when subjects breathed spontaneously. Whereas FI, BH, and HV had baseline PETCO2 levels that were lower than the resting values, the PC manipulation had levels that were higher. Although PC accurately attained the target PETCO2 values, the targeted baseline values were chosen to be slightly higher than the spontaneously arising PETCO2 due to our observation that values much below 40 mm Hg were difficult to achieve with the RespirAct at the desired breathing rates. We suspect that this is due to the incorporation of a rebreathing circuit in this system.
The baseline PETCO2 levels were, as expected, lowest in HV, where ventilatory rate was 50% higher than in the rest of the manipulations. Fixed inspired and BH did not differ significantly from each other, although both had baseline PETCO2 levels that were considerably lower than the spontaneously arising value.
Incidental changes in O2 (Figure 3D) were all significantly different from zero. In PC and FI, changes were minimal and virtually indistinguishable. Baseline levels of PETO2 (Figure 3C) were above spontaneous resting levels except for PC. As would be expected, peak baseline levels for PETO2 were observed for HV, which drove PETO2 to 142±2. During manipulations including breath-hold (BH and HV), PETO2 fell by up to 26±2 mm Hg, reaching a lower value of 92±6 mm Hg in the HV manipulation.
Arterial Spin Labeling Flow Signal
Examples of the linear modeling of the ASL signal are shown in Figure 4 for the average gray-matter signal in a single subject. Absolute ASL flow changes and baseline levels for each manipulation are shown as bar graphs in Figure 5A and B, respectively. Differences in the measured flow responses were only significant (though marginally, with P=0.16) between FI and HV. Note that the flow change in response to breath-holds in HV is the lowest, despite the fact that this manipulation gave the largest change in PETCO2.
Figure 4.

Arterial spin labeling (ASL) flow signal changes in gray matter during hypercapnia from a single representative subject. Linear modeling fits of PETCO2 traces (black) are plotted over corresponding ASL signals (gray) for the four different manipulations. Left to right: PC and FI on the top, and BH and HV on the bottom. CBF, cerebral blood flow.
Figure 5.

Group average values of the arterial spin labeling (ASL) flow signal in gray matter. (A) Baseline flow; (B) absolute flow increases. In (D), the CO2-induced increases are normalized by the PETCO2 increases and expressed as an absolute cerebral vascular reactivity (CVR) ratio. The percent change in ASL signal per mm Hg increase in CO2 in (C). In the bottom graphs, we indicate where the t-tests did not point to significant differences (differences between PC and FI/BH were only marginally significant with P<0.1). In panel A, significant differences (P<0.05) are indicated by an asterisk symbol. BH, breath hold; CBF, cerebral blood flow; FI, fixed inspired; PC, prospective control; HV, hyperventilation.
Absolute levels for baseline flow were generally correlated with baseline PETCO2 levels, with the PC manipulation having considerably higher baseline PETCO2 and CBF values than the other manipulations, among whom the differences were not statistically significant.
When expressed as the percent change in CBF per unit of change in PETCO2, PC, FI, and BH yielded comparable CVR estimates that did not differ by a statistically significant amount (Figure 5C). The HV manipulation, however, gave a significantly lower value of relative CVR (the term ‘relative CVR' will be used to indicate Δ%CBF/PETCO2).
When expressed in terms of the absolute change in CBF (mL/100 g per minute) per mm Hg change in PETCO2 (‘absolute' CVR), however, there were significant differences in the values given by the different methods (Figure 5D). In general, the absolute CVR values were correlated with the resting PETCO2 associated with each manipulation.
Group average maps of the baseline blood flow and reactivity to CO2 are shown in Figure 6. Maps for both baseline CBF and CO2-induced response reveal peak values in gray matter, as expected. Maps based on percent change (bottom row) are somewhat noisier, reflecting the vulnerability of ratio images to low signal-to-noise ratio in the denominator.
Figure 6.

Group average cerebral blood flow (CBF) maps. Baseline signal (first row), CO2-induced response (second row) and cerebral vascular reactivity (CVR), computed as absolute units of flow per mm Hg increase in CO2 (third row) and as the percent increase with respect to baseline (fourth row). BH, breath hold; FI, fixed inspired; PC, prospective control; HV, hyperventilation.
The images displayed are non oblique axial slices that pass through the upper occipital lobe, above the calcarine sulcus. We suspect that the low baseline CBF in these areas is due partly to sulcal anatomy that results in a relatively lower partial volume of gray matter and hence the appearance of lower CBF. The short postlabel delay used may also result in incomplete clearance of macrovascular signals in some arterial territories. We cannot rule out the possibility that anterior and middle cerebral artery territories are showing macrovessel enhancement that is absent or reduced in the posterior cerebral artery territory (occipital lobe). Another potential source of error is the residual N/2 ghosting we have noticed in some subjects' data which could be biasing the average CBF in that particular area. Yet, regardless of its source, this small measurement error seems to equally affect the four different baseline maps, i.e., it is not specific to any respiratory manipulation.
CO2 Dose–Response Curve
The ASL vs. PETCO2 paired data (Figure 7) were generally well described by the sigmoidal model, with most of the non linearity observed toward the lower range of PETCO2 values at which CBF appeared to plateau some minimal threshold value. The CBF-PETCO2 pairs associated with the PC manipulation typically fell at the upper end of these curves while data points associated with the HV manipulation gave the lowest PETCO2 values and consequently lay along the lower CBF plateau.
Figure 7.

Arterial spin labeling (ASL) flow vs. CO2 dose–response curves in nine subjects. BH, breath hold; CBF, cerebral blood flow; FI, fixed inspired; PC, prospective control; HV, hyperventilation.
Comfort of Participants During Breathing Manipulations
Subjective ratings of air hunger provided by subjects for the different manipulations were 2.8±0.4 for PC, 2.3±0.3 for FI, 2.4±0.3 for BH, and 2.5±0.4 for HV. No significant differences at P<0.05 were detected.
Discussion
Although having a small offset, PETCO2 and arterial PCO2 (PaCO2) are strongly correlated. This offset might slightly differ across manipulations, but it is reasonable to assume that during each manipulation the offset is constant. Being so, for the comparison of CVR, which depends on the normalization of the CBF response by the size of the hypercapnic stimuli, ΔPETCO2 can be used in place of ΔPaCO2 with no loss of generality. We believe that, under the conditions of this study, PETCO2 is an accurate surrogate for PaCO2.
Measures of CVR obtained using a variety of respiratory manipulation methods were found to be comparable when CVR was expressed as the percent change in CBF per mm Hg change in PETCO2. When CVR was expressed in terms of the absolute flow change, however, significant differences were noted. In general, the absolute change in CBF was correlated with the baseline level of PETCO2, indicating that the non linear dose–response curve describing the CBF-PETCO2 relationship had an important role in determining reactivity. The variance of the induced change in PETCO2 was lowest for the PC method, although the variance of other methods was also relatively low, possibly due to the use of a metronome to pace breathing in all cases.
A notable finding was that, for all manipulations except PC, subjects exhibited PETCO2 values considerably lower than the ‘spontaneous' baseline observed when they breathed without pacing using no mask or the non rebreathing mask. This is very likely due to the rather high breathing rate of 16 to 24 breaths per minute imposed by the metronome pacing, a conclusion that is also supported by the finding of slightly hyperoxic baselines PETO2 values for all manipulations except PC. Prospective control was notable for a baseline PETCO2 value that was somewhat higher than the spontaneous value, reflecting constraints on the PETCO2 values that could be targeted.
To the extent that the change in CBF is a linear function of change in PETCO2, the exact baseline and change values for the latter are not critical. However, our data revealed that moderate hypocapnia can bring the cerebral vasculature into a non linear regime that approaches the ‘threshold' dose for CO2 below which further decreases in PETCO2 have minimal effect on CBF. In this lower range of CO2 levels, absolute CVR is considerably reduced compared with the CO2 reactivity seen around 40 mm Hg. Although this effect is corrected somewhat for all but the most severe hypocapnic baselines (HV) when ‘relative' CVR (Δ%CBF/PETCO2) is computed, our findings suggest that CVR studies should be conducted with baseline PETCO2 values that are solidly within the linear range (30 to 45 mm Hg). This can be achieved using a PC system like the RespirAct, or by imposing lower rates of paced breathing during other manipulations. These findings are consistent with those of previous studies reporting significant differences between CVR to hypocapnic and hypercapnic stimuli.33, 34
In terms of the relative advantages and disadvantages of the different methods, the following conclusions can be summarized:
Prospective Control
Use of the RespirAct device resulted in the PETCO2 values that were the most consistently in the linear range of the CBF vs. PETCO2 relationships for our participants, because of the higher range of PETCO2 values attained in these experiments. Changes in PETO2 during the hypercapnic manipulations were negligible (as these were prospectively targeted by the device to be zero).
Administration of Fixed Inspired Gases
While this approach gave robust changes in PETCO2 values and imaging signals, the baseline PETCO2 values were somewhat lower than those obtained with the PC method, encroaching on the non linear region of the dose–response curve. This resulted in group average values for absolute CVR, which were also somewhat lower than those obtained using the PC method. Relative CVR values (Δ%CBF/PETCO2) obtained with FI were also slightly lower than those given by PC, although the difference was not statistically significant. Changes in PETO2 during hypercapnic manipulations were negligible, likely due to the use of paced breathing in this manipulation (avoiding accelerated breathing and resultant hyperoxia).
Breath Hold
Because these experiments used the same baseline breathing rate as FI, the baseline PETCO2 was similarly depressed relative to the spontaneous baseline. Consequently, the resultant values of absolute and relative CVR were also lower than those given by the PC method (although they were very similar to those given by FI). PETO2 decreased significantly during this manipulation, as expected due to the interruption of oxygen uptake. Such mild hypoxia could contribute a slight vasodilatory input, which would tend to exaggerate CVR measures. While the latter effect could explain the tendency of BH measures of CVR to be higher than those for FI, the difference is fairly small and not statistically significant.
Hyperventilation
As expected, the higher breathing rate of 24 breaths per minute used on this manipulation gave the lowest baseline PETCO2 and consequently the lowest CVR values due to the proximity of CO2 values with the lower plateau of the dose–response curve. The long cumulative reduction in minute ventilation during the breath-hold phases also resulted in the highest degree of hypercapnia and hypoxia. The CVR values obtained with this approach were thus far lower than those of the other methods, for both absolute and relative expressions.
In terms of overall performance, the PC method appears to have provided the most linear estimate of CVR with the least contamination from hyperoxia of all of the methods. However, the same level of linearity could likely be achieved in the FI and BH methods with small adjustments, particularly the pacing of participants at slower breathing rates. For future studies where the control over minute ventilation is a concern, we would advocate the use of paced breathing at lower rates, e.g., 8 to 12 breaths per minute. Methods including significant hypocapnia (<30 mm Hg) should be avoided, as these will necessarily give CVR values biased by the non linearity of the CBF-PETCO2 dose–response curve. All methods were well tolerated by our cohort of young healthy participants, although results in older groups or those affected by disease could be different.
In conclusion, we noted that variability of CVR between methods was reduced when CVR was expressed in terms of the percent change in CBF rather than the absolute change. Values of CVR expressed in terms of the absolute change in CBF per unit of change in PETCO2 depended strongly on the range of PETCO2 levels considered, indicating that the non linearity of the CBF-PETCO2 dose–response curve exerts significant influence on the observed CBF reactivity. In particular, manipulations involving a hypocapnic baseline should be avoided as these may fall within the sublinear region of the dose–response curve. To facilitate interpretation and comparison of results, we recommend that future studies reporting ASL-based CVR values indicate baseline and hypercapnic flow values along with percentage changes. It is equally important to specify the baseline and hypercapnic levels of end-tidal CO2 during such experiments.
Acknowledgments
The authors thank Carollyn Hurst and André Cyr for help with data acquisition and Jiongjiong Wang at UCLA, who provided the pseudo-continuous arterial spin-labeling sequence used. The authors would also like to thank the reviewers for their insightful comments.
The authors declare no conflict of interest.
Footnotes
This work was supported by the Canadian Institutes for Health Research (MOP 84378), the Canadian Foundation for Innovation (Leaders Opportunity Fund 17380), and the Canadian National Sciences and Engineering Research Council (R0018142).
References
- Glodzik L, Rusinek H, Brys M, Tsui WH, Switalski R, Mosconi L, et al. Framingham cardiovascular risk profile correlates with impaired hippocampal and cortical vasoreactivity to hypercapnia. J Cereb Blood Flow Metab. 2011;31:671–679. doi: 10.1038/jcbfm.2010.145. [DOI] [PMC free article] [PubMed] [Google Scholar]
- Silvestrini M, Pasqualetti P, Baruffaldi R, Bartolini M, Handouk Y, Matteis M, et al. Cerebrovascular reactivity and cognitive decline in patients with Alzheimer disease. Stroke. 2006;37:1010–1015. doi: 10.1161/01.STR.0000206439.62025.97. [DOI] [PubMed] [Google Scholar]
- Webster MW, Makaroun MS, Steed DL, Smith HA, Johnson DW, Yonas H.Compromised cerebral blood flow reactivity is a predictor of stroke in patients with symptomatic carotid artery occlusive disease J Vasc Surg 199521338–344.discussion 344-5. [DOI] [PubMed] [Google Scholar]
- Kety SS, Schmidt CF. The effects of altered arterial tensions of carbon dioxide and oxygen on cerebral blood flow and cerebral oxygen consumption of normal young men. J Clin Invest. 1948;27:484–492. doi: 10.1172/JCI101995. [DOI] [PMC free article] [PubMed] [Google Scholar]
- Kastrup A, Li TQ, Glover GH, Moseley ME. Cerebral blood flow-related signal changes during breath-holding. AJNR. Am J Neuroradiol. 1999;20:1233–1238. [PMC free article] [PubMed] [Google Scholar]
- Rostrup E, Larsson HB, Toft PB, Garde K, Ring PB, Henriksen O. Susceptibility contrast imaging of CO2-induced changes in the blood volume of the human brain. Acta Radiol. 1996;37:813–822. doi: 10.1177/02841851960373P276. [DOI] [PubMed] [Google Scholar]
- Rostrup E, Larsson HB, Toft PB, Garde K, Thomsen C, Ring P, et al. Functional MRI of CO2 induced increase in cerebral perfusion. NMR Biomed. 1994;7:29–34. doi: 10.1002/nbm.1940070106. [DOI] [PubMed] [Google Scholar]
- Alsop DC, Dai W, Grossman M, Detre JA. Arterial spin labeling blood flow MRI: its role in the early characterization of Alzheimer's disease. J Alzheimers Dis. 2010;20:871–880. doi: 10.3233/JAD-2010-091699. [DOI] [PMC free article] [PubMed] [Google Scholar]
- Detre JA, Wang J, Wang Z, Rao H. Arterial spin-labeled perfusion MRI in basic and clinical neuroscience. Curr Opin Neurol. 2009;22:348–355. doi: 10.1097/WCO.0b013e32832d9505. [DOI] [PubMed] [Google Scholar]
- Williams DS, Detre JA, Leigh JS, Koretsky AP. Magnetic resonance imaging of perfusion using spin inversion of arterial water. Proc Natl Acad Sci USA. 1992;89:212–216. doi: 10.1073/pnas.89.1.212. [DOI] [PMC free article] [PubMed] [Google Scholar]
- Ances BM, Liang CL, Leontiev O, Perthen JE, Fleisher AS, Lansing AE, et al. Effects of aging on cerebral blood flow, oxygen metabolism, and blood oxygenation level dependent responses to visual stimulation. Hum Brain Mapp. 2009;30:1120–1132. doi: 10.1002/hbm.20574. [DOI] [PMC free article] [PubMed] [Google Scholar]
- Hoge RD, Atkinson J, Gill B, Crelier GR, Marrett S, Pike GB. Linear coupling between cerebral blood flow and oxygen consumption in activated human cortex. Proc Natl Acad Sci USA. 1999;96:9403–9408. doi: 10.1073/pnas.96.16.9403. [DOI] [PMC free article] [PubMed] [Google Scholar]
- Hoge RD, Atkinson J, Gill B, Crelier GR, Marrett S, Pike GB. Investigation of BOLD signal dependence on cerebral blood flow and oxygen consumption: the deoxyhemoglobin dilution model. Magn Reson Med. 1999;42:849–863. doi: 10.1002/(sici)1522-2594(199911)42:5<849::aid-mrm4>3.0.co;2-z. [DOI] [PubMed] [Google Scholar]
- Yezhuvath US, Lewis-Amezcua K, Varghese R, Xiao G, Lu H. On the assessment of cerebrovascular reactivity using hypercapnia BOLD MRI. NMR Biomed. 2009;22:779–786. doi: 10.1002/nbm.1392. [DOI] [PMC free article] [PubMed] [Google Scholar]
- Banzett RB, Garcia RT, Moosavi SH. Simple contrivance "clamps" end-tidal PCO(2) and PO(2) despite rapid changes in ventilation. J Appl Physiol. 2000;88:1597–1600. doi: 10.1152/jappl.2000.88.5.1597. [DOI] [PubMed] [Google Scholar]
- Sommer LZ, Iscoe S, Robicsek A, Kruger J, Silverman J, Rucker J, et al. A simple breathing circuit minimizing changes in alveolar ventilation during hyperpnoea. Eur Respir J. 1998;12:698–701. doi: 10.1183/09031936.98.12030698. [DOI] [PubMed] [Google Scholar]
- Somogyi RB, Vesely AE, Preiss D, Prisman E, Volgyesi G, Azami T, et al. Precise control of end-tidal carbon dioxide levels using sequential rebreathing circuits. Anaesth Intensive Care. 2005;33:726–732. doi: 10.1177/0310057X0503300604. [DOI] [PubMed] [Google Scholar]
- Wise RG, Pattinson KTS, Bulte DP, Chiarelli PA, Mayhew SD, Balanos GM, et al. Dynamic forcing of end-tidal carbon dioxide and oxygen applied to functional magnetic resonance imaging. J Cereb Blood Flow Metab. 2007;27:1521–1532. doi: 10.1038/sj.jcbfm.9600465. [DOI] [PubMed] [Google Scholar]
- Slessarev M, Han JS, Mardimae A, Prisman E, Preiss D, Volgyesi G, et al. Prospective targeting and control of end-tidal CO2 and O2 concentrations. J Physiol. 2007;581 (Pt 3:1207–1219. doi: 10.1113/jphysiol.2007.129395. [DOI] [PMC free article] [PubMed] [Google Scholar]
- Kastrup A, Li TQ, Takahashi A, Glover GH, Moseley ME. Functional magnetic resonance imaging of regional cerebral blood oxygenation changes during breath holding. Stroke. 1998;29:2641–2645. doi: 10.1161/01.str.29.12.2641. [DOI] [PubMed] [Google Scholar]
- Murphy K, Harris AD, Wise RG. Robustly measuring vascular reactivity differences with breath-hold: normalising stimulus-evoked and resting state BOLD fMRI data. NeuroImage. 2011;54:369–379. doi: 10.1016/j.neuroimage.2010.07.059. [DOI] [PubMed] [Google Scholar]
- Mark C, Slessarev M, Ito S, Han J, Fisher J, Pike G. Precise control of end-tidal carbon dioxide and oxygen improves BOLD and ASL cerebrovascular reactivity measures. Magn Reson Med. 2010;64:749–756. doi: 10.1002/mrm.22405. [DOI] [PubMed] [Google Scholar]
- Battisti-Charbonney A, Fisher J, Duffin J. The cerebrovascular response to carbon dioxide in humans. J Physiol. 2011;589 (Pt 12:3039–3048. doi: 10.1113/jphysiol.2011.206052. [DOI] [PMC free article] [PubMed] [Google Scholar]
- Harper AM, Glass HI. Effect of alterations in the arterial carbon dioxide tension on the blood flow through the cerebral cortex at normal and low arterial blood pressures. J Neurol Neurosurg Psychiatry. 1965;28:449–452. doi: 10.1136/jnnp.28.5.449. [DOI] [PMC free article] [PubMed] [Google Scholar]
- Reivich M. Arterial PCO2 and cerebral hemodynamics. Am J Physiol. 1964;206:25–35. doi: 10.1152/ajplegacy.1964.206.1.25. [DOI] [PubMed] [Google Scholar]
- Ide K, Eliasziw M, Poulin MJ. Relationship between middle cerebral artery blood velocity and end-tidal PCO2 in the hypocapnic-hypercapnic range in humans. J Appl Physiol. 2003;95:129–137. doi: 10.1152/japplphysiol.01186.2002. [DOI] [PubMed] [Google Scholar]
- Dai W, Garcia D, de Bazelaire C, Alsop DC. Continuous flow-driven inversion for arterial spin labeling using pulsed radio frequency and gradient fields. Magn Reson Med. 2008;60:1488–1497. doi: 10.1002/mrm.21790. [DOI] [PMC free article] [PubMed] [Google Scholar]
- Tancredi FB, Gauthier CJ, Madjar C, Bolar DS, Fisher JA, Wang DJ, et al. Comparison of pulsed and pseudocontinuous arterial spin-labeling for measuring CO2 -induced cerebrovascular reactivity. J Magn Reson Imag. 2012;36:312–321. doi: 10.1002/jmri.23658. [DOI] [PubMed] [Google Scholar]
- Prisman E, Slessarev M, Han J, Poublanc J, Mardimae A, Crawley A, et al. Comparison of the effects of independently-controlled end-tidal PCO(2) and PO(2) on blood oxygen level-dependent (BOLD) MRI. J Magn Reson Imag. 2008;27:185–191. doi: 10.1002/jmri.21102. [DOI] [PubMed] [Google Scholar]
- Banzett RB, Lansing RW, Evans KC, Shea SA. Stimulus-response characteristics of CO2-induced air hunger in normal subjects. Respir Physiol. 1996;103:19–31. doi: 10.1016/0034-5687(95)00050-x. [DOI] [PubMed] [Google Scholar]
- Zhang Y, Brady M, Smith S. Segmentation of brain MR images through a hidden Markov random field model and the expectation-maximization algorithm. IEEE Trans Med Imag. 2001;20:45–57. doi: 10.1109/42.906424. [DOI] [PubMed] [Google Scholar]
- Wang J, Alsop DC, Song HK, Maldjian JA, Tang K, Salvucci AE, et al. Arterial transit time imaging with flow encoding arterial spin tagging (FEAST) Magn Reson Med. 2003;50:599–607. doi: 10.1002/mrm.10559. [DOI] [PubMed] [Google Scholar]
- Bright MG, Donahue MJ, Duyn JH, Jezzard P, Bulte DP. The effect of basal vasodilation on hypercapnic and hypocapnic reactivity measured using magnetic resonance imaging. J Cereb Blood Flow Metab. 2011;31:426–438. doi: 10.1038/jcbfm.2010.187. [DOI] [PMC free article] [PubMed] [Google Scholar]
- Chen JJ, Pike GB. Global cerebral oxidative metabolism during hypercapnia and hypocapnia in humans: implications for BOLD fMRI. J Cereb Blood Flow Metab. 2010;30:1094–1099. doi: 10.1038/jcbfm.2010.42. [DOI] [PMC free article] [PubMed] [Google Scholar]