

Abstract
Individualized stroke treatment decisions can be improved by accurate identification of the extent of salvageable tissue. Magnetic resonance imaging (MRI)-based approaches, including measurement of a ‘perfusion-diffusion mismatch' and calculation of infarction probability, allow assessment of tissue-at-risk; however, the ability to explicitly depict potentially salvageable tissue remains uncertain. In this study, five predictive algorithms (generalized linear model (GLM), generalized additive model, support vector machine, adaptive boosting, and random forest) were tested in their potency to depict acute cerebral ischemic tissue that can recover after reperfusion. Acute T2-, diffusion-, and perfusion-weighted MRI, and follow-up T2 maps were collected from rats subjected to right-sided middle cerebral artery occlusion without subsequent reperfusion, for training of algorithms (Group I), and with spontaneous (Group II) or thrombolysis-induced reperfusion (Group III), to determine infarction probability-based viability thresholds and prediction accuracies. The infarction probability difference between irreversible—i.e., infarcted after reperfusion—and salvageable tissue injury—i.e., noninfarcted after reperfusion—was largest for GLM (20±7%) with highest accuracy of risk-based identification of acutely ischemic tissue that could recover on subsequent reperfusion (Dice's similarity index=0.79±0.14). Our study shows that assessment of the heterogeneity of infarction probability with MRI-based algorithms enables estimation of the extent of potentially salvageable tissue after acute ischemic stroke.
Keywords: diffusion-weighted imaging, ischemic stroke, MRI, perfusion imaging, salvageable tissue, tissue outcome prediction
Introduction
Contemporary treatment protocols for patients suffering from acute ischemic stroke ask for adequate and early identification of tissue at risk of infarction to allow for proper clinical decision making. Current thrombolytic treatment guidelines indicate safe treatment time windows of 3 to 4.5 hours after stroke onset.1 However, this time window may be too strict in particular cases, unnecessarily excluding patients who may benefit from reperfusion therapy.2
Neuroimaging, particularly with magnetic resonance imaging (MRI), provides a powerful tool for characterization of acute cerebral ischemic tissue status, which can aid in treatment decision making in individual patients.3 In particular, diffusion-weighted imaging, for detection of acute ischemic tissue damage,4 and perfusion-weighted imaging, for detection of hemodynamic disturbances,5 provide sensitive and specific means for acute stroke diagnosis. Dichotomization of MRI-derived perfusion- and diffusion-based lesion volumes into overlapping and nonoverlapping areas enables selection of patients with a ‘perfusion-diffusion mismatch' who may be eligible for thrombolytic treatment.2, 6, 7 However, lack of standard postprocessing procedures and threshold values may compromise robust characterization of a ‘perfusion-diffusion mismatch',3, 8 and volumetric analysis may obscure and oversimplify the complex and heterogeneous status of the affected tissue.7, 9, 10 This mismatch area may therefore overestimate the actual tissue area at risk,5, 11, 12 as well as exclude injured tissue that is potentially salvageable.13
The complex relation between multiple pathophysiologic factors involved in stroke lesion progression may be better caught and described using multiparametric imaging-based statistical algorithms. These algorithms allow voxelwise integration of multiple MRI-based tissue and perfusion parameters to compute a single quantitative probabilistic index.14, 15 Multiparametric algorithms can more accurately estimate risk of infarction compared with single MRI-based parameters, and show good correspondence with actual lesion outcome.14, 16 However, it is unclear whether such algorithms also enable accurate differentiation between irreversibly damaged and potentially salvageable tissue, which would significantly advance the value of this approach for selection and planning of therapeutic intervention.12, 17
We hypothesized that acute imaging-based predicted infarction areas can be subdivided into volumes of irreversible and reversible tissue injury. Hence, we selected five well-established predictive algorithms and determined each algorithm's efficacy in (1) early detection of tissue at risk of infarction and (2) differentiating irreversibly damaged tissue from potentially salvageable tissue, based on multiparametric MRI data after experimental stroke. To that aim, we compared early measures of infarction risk with final outcome after ischemic stroke in rats with or without subsequent reperfusion.
Materials and methods
Animal Procedures
We partly included data from animals that have been previously used for another study.18 The current study provides new and original results that have not been described in our previous study. Animal procedures were conducted according to the guidelines of the European Communities Council Directive and approved by the Ethical Committee on Animal Experiments of the University Medical Center Utrecht and Utrecht University. Surgical procedures have been described in detail elsewhere.18, 19 In brief, before surgery male Wistar rats (275 to 400 g, Harlan, Horst, The Netherlands) received an intramuscular injection of gentamicin sulfate (5 mg/kg) as antibiotic treatment, and 2.5 mL glucose-saline solution to prevent dehydration. Subsequently, animals were anesthetized by a subcutaneous injection of 0.5 mL/kg fentanyl citrate (0.315 mg/mL) and fluanisone 10 mg/mL (Group I), or by mechanical ventilation with 2% isoflurane in air to O2 (7:1) (Groups II and III). Body temperature was maintained at 37.5 (±0.5)°C with a temperature-controlled heating pad. The right carotid artery was exposed by a ventral incision in the neck. A modified catheter was advanced into the internal carotid artery, until the tip was proximal to the middle cerebral artery (MCA). Unilateral MCA occlusion was induced by insertion of an intraluminal filament (Group I) (1), or by slow injection of a homologous blood clot (50 mm long, 24-hour old) (Groups II and III). Subsequently, the wound was closed and animals received a subcutaneous injection of buprenorphine (0.03 mg/kg) for pain relief, and 5 mL glucose-saline solution to compensate for loss of water and minerals. In the first three days after surgery, excessive weight loss was partially compensated by subcutaneous injection of Ringer's lactate solution (0 to 10 mL, depending on degree of weight loss). Within 30 minutes after MCA occlusion (MCAo), animals were positioned in the MR scanner, and acute imaging was conducted between 0.5 and 2 hours after stroke. Immediately after the first imaging session, Group II and III animals received saline (Group II) or 10.0 mg/kg recombinant tissue plasminogen activator (rt-PA; Actilyse, Boehringer Ingelheim, Alkmaar, The Netherlands, 3.0 mg/mL) (Group III), intravenously administered over a 30-minute period (10% bolus injection; 90% continuous infusion). Animals were allowed to recover afterwards. Group I animals underwent a second MRI session at 72 hours after onset, whereas for Group II and III animals MRI was repeated at 24 hours after MCAo to confirm reperfusion and 168 hours to establish actual tissue injury.
In Group I, 7 out of 14 rats with an acute lesion in the MCA territory survived up to 3 days to undergo the second MRI session. In Groups II and III, survival rate after successful MCAo was higher: 7 out of 9 animals in Group II and 5 out of 7 animals in Group III survived up to day 7. This led to the following sample sizes for the present study: Group I: n=7; Group II: n=7; and Group III: n=5.
Image Acquisition
Magnetic resonance imaging was conducted on a 4.7-T scanner (Varian, Palo Alto, CA, USA). Group I animals underwent MRI—with a 9.0-cm inductively coupled Helmholtz coil for signal transmission and detection—at 0.5 to 2 hours and at 72 hours after MCAo. For each session, MRI consisted of T2-weighted spin echo (repetition time (TR)=3,000 ms; echo time (TE)=17.5 ms; number of echoes=8; data matrix=128 × 128 × 11; field-of-view (FOV)=25 × 25 × 13.2 mm3; 0.13 mm interslice gap), diffusion-weighted multislice echo planar imaging (TR=2,000 ms; TE=80 ms; data matrix=128 × 128 × 11, FOV=25 × 25 × 1.2 mm3; 0.13 mm interslice gap; b=124, 404, 844, and 1,444 s/mm2; 3 diffusion directions), and dynamic susceptibility-weighted contrast-enhanced MRI (TR=300 ms; TE=20 ms; flip angle=5° data matrix=64 × 64 × 3; 500 time points; FOV=25 × 25 × 3.6 mm3; 0.13 mm interslice gap) in combination with an intravenous bolus of gadopentate-dimeglumine (Magnevist, Schering, The Netherlands; 0.5 mg/kg).
Group II and III animals underwent MRI with an updated protocol—using a 9.0-cm inductively coupled Helmholtz coil and an inductively coupled 2.5-cm surface coil for signal detection, respectively—at 0.5 to 2, 24, and 168 hours after MCAo. Magnetic resonance imaging consisted of T2-weighted spin echo (TR=3,600 ms; TE=15 ms; number of echoes=12; data matrix=256 × 128 × 19; FOV=32 × 32 × 19 mm3), diffusion-weighted 8-shot echo planar imaging (TR=3,500 ms; TE=38.5 ms; b=0 and 1,428 mm2/s; 6 diffusion directions; data matrix=128 × 128 × 19; FOV=32 × 32 × 19 mm3), and dynamic susceptibility-weighted contrast-enhanced MRI (TR=330 ms; TE=25 ms; flip angle=5° data matrix=64 × 64 × 5; 400 time points; FOV=32 × 32 × 5.0 mm3) was acquired in combination with an intravenous bolus of gadobutrol (Gadovist, Schering, The Netherlands; 0.32 mmol/kg).
Image Processing
Parametric maps of the T2 and trace of the apparent diffusion coefficient (ADC) were calculated by mono-exponential fitting. Maps of the cerebral blood flow index (CBFi), cerebral blood volume, and mean transit time (MTT) were calculated by tracer arrival time-insensitive deconvolution,20 with an arterial input function from two voxels in the ipsilateral internal carotid artery. Relative tracer delay and dispersion were determined from the time-to-peak of the derived residue function (Tmax).20 All parametric maps were spatially aligned using a nonrigid co-registration procedure.21 This was followed by segmentation of brain parenchyma from surrounding tissue using the brain extraction tool.22 All maps were normalized and expressed as relative after dividing each voxel by mean values of normal appearing contralateral gray-matter regions, except for Tmax. Tmax maps were normalized by subtraction of the derived mean values.12 Mean contralateral gray-matter values were calculated using a contralateral, cerebrospinal fluid-excluded mask of four consecutive slices. Contamination by white-matter tissue was prevented by three consecutive morphologic erosion steps. Ipsilateral and contralateral hemispheres were defined by a manually derived linear boundary through the midline. Cerebrospinal fluid, specified as voxels with T2 values at least 4.5 standard deviations higher than mean normal contralateral values (from 65 control rats), was excluded in further analysis. Infarcted tissue was automatically identified as voxels with T2 values at least 2 standard deviations higher than mean contralateral gray-matter values on poststroke day 3 (Group I) or 7 (Groups II and III) (T2-based lesion sizes at day 3 after permanent MCAo or at day 7 after embolic stroke have been shown to correspond with infarction size on postmortem histologic sections23, 24). Acute perfusion abnormality was similarly identified on acute MTT values. Acute diffusion abnormality was defined as at least 2 standard deviations lower than mean contralateral ADC values. Volumes with abnormal tissue were subsequently normalized by the total ipsilateral hemispheric volume, and expressed as hemispheric lesion fraction (HLF=lesion volume/ipsilateral hemispheric volume). The volumetric difference between the acute perfusion and diffusion abnormality was used to determine the perfusion-diffusion mismatch. A reduction of >40% in the volume of perfusion abnormality from 2 to 24 hours in Group II and III animals was considered as indicative of reperfusion.
Tissue Outcome Prediction
To predict poststroke tissue infarction, we used predictive algorithms that combine a carefully balanced set of acutely acquired MRI parameters (xi=x1,.., xm)—here T2, ADC, CBF, MTT, and Tmax—on a voxelwise basis in relation to corresponding tissue infarction derived from T2 follow-up maps.25 A predictive algorithm calculates, based on a training data set, an optimized set of coefficients that map a relation of samples from the acutely acquired images to a class that represent ultimately infarcted tissue and a class that represents noninfarcted tissue. Subsequently, this set of coefficients can be used to estimate the probability of tissue infarction (Pinfarct=P(infarct|x1,.., xm)) from newly introduced samples. To estimate Pinfarct, we selected five predictive algorithms based on (1) a generalized linear model (GLM),14 (2) a generalized additive model (GAM),26 (3) a support vector machine (SVM),16, 27 (4) decision tree-based adaptive boosting (ADA),28 and (5) random forest (RF).29 Of these five algorithms, GLM and SVM had previously shown to successfully predict the extent of tissue infarction.14, 16
Generalized linear model, GAM, and SVM estimate Pinfarct by a logistic function: P=1/(1+e−η(x)) where η(x) is a link function that defines the relationship of M MRI parameters (x) to the tissue outcome at follow-up. In GLM, η(x) is a linear link function: 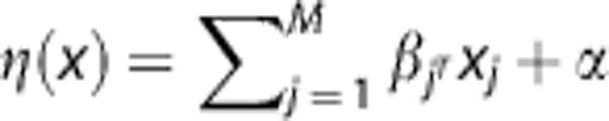 , with β describing the weights of each MRI parameter, and α the bias or intercept of the linear function. Coefficients α and β can be estimated using iterative reweighted least squares fitting.14, 30 In GAM, β is replaced by an additional smoothing term f(x):
 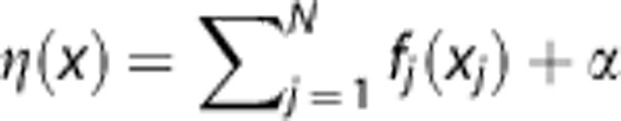 defining a nonlinear link function, where f(x) can be estimated using cubic spline regression.26 In contrast to GLM and GAM, SVM uses a more indirect relationship defined in η(x). In SVM, η(x) is a decision function that aims to subdivide the two tissue classes (infarct versus noninfarct). This binary decision function describes a linear hyperplane that aims to maximize the separating gap (i.e., margin) between the two tissue classes' training samples and is defined as:
 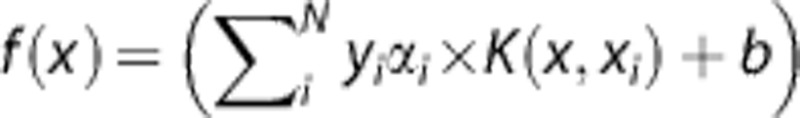 . α is a weighting vector that selects only those samples closest to the class boundaries, which contribute to the estimation of the linear hyperplane (i.e., support vectors). α is bound between 0 and C, a regularization parameter that controls the tradeoff between optimizing the margin and allowing for some samples to reside on the wrong side of the decision boundary (i.e., misclassification error). Furthermore, a transformation kernel K(x, xi) can be used to circumvent the need of estimating a highly complex hyperplane by rearranging the data such that it allows for a simple linear decision boundary.16, 27 In the end, class probability is obtained after fitting the binary decision function results to a sigmoid function.27
In contrast to GLM, GAM, and SVM, which define a single effective classification function, Pinfarct can be estimated by combining multiple apparently less effective decisions of which the combined probabilistic estimate may be highly effective.29, 31 In decision tree analysis, the presented training data are recursively dichotomized in subgroups until node purity (i.e., all subgroup samples belong to the same class) is maximized.31 Yet, small variations in training data sampling may result in highly different decisions, i.e., decision trees are highly instable. This instability may therefore make these trees highly ineffective. Instability can be circumvented and made beneficial by using the collective classification or ensemble result of multiple decision trees for estimating infarction probability.12 In this study, two ensemble methods were tested: ADA and RF. In this context, ADA was applied as an ensemble meta-algorithm that sequentially grows and weighs multiple decision trees to give an estimate of infarct probability. At each iterative step, weights are adjusted to emphasize the incorrect classifications, focusing on the parts of the training data that needs most improvement.32 Random forest is another type of ensemble method that provokes decision tree instability using bootstrap aggregating or bagging. A subset of randomly drawn samples with replacement from the set of training samples is used to simultaneously create multiple, variable decision trees. Variability is further established by randomly selecting a subset of MRI parameters for branching the decision trees' nodes (i.e., ‘tries'). Infarction probability is determined by majority vote of each tree's classification result.29
Details on operational parameter optimization of the algorithms can be found in Supplementary Data.
Each algorithms' prediction accuracy was determined in Group I with a jack-knifing (i.e., leave-one-out) approach to prevent bias.33 Predictions in Group II and III were based on aggregated data from Group I-trained models. Prediction accuracy was assessed by comparing the estimated infarction probability to the follow-up T2-based tissue outcome. Probability maps were iteratively thresholded in step values of 1% ranging from 0% to 100%, and at each threshold, the voxels with correct and incorrect predictions of infarction—true positives (TP) and false positives (FP), respectively—and noninfarction—true negatives (TN) and false negatives (FN), respectively—were calculated. This allowed calculation of model sensitivity or recall (snc=recall=TP/(TP+FN)); specificity (spc=TN/(TN+FP)); and the positive predictive value or precision (prc=TP/(TP+FP)). Subsequently, sensitivity and 1-specificity were used for receiver operator characteristic (ROC) statistics. Precision and recall values were used to create precision-recall (PR) graphs. In ROC statistics, highly skewed data sets can give a biased view of an algorithm's performance that may be avoided using PR statistics.34 Quantitative comparisons were provided by calculating the area under the curve of the ROC (AUCroc) and PR curve (AUCpr). Infarction probability maps were thresholded at 50% to define predicted infarct fraction (PIF=predicted infarct volume/ipsilateral hemispheric volume).17, 30 Overlap of PIF and ultimate infarct fraction defined from follow-up T2 maps was expressed by Dice's similarity index (DSI=(TP+TP)/(TP+FP+FN+TP)), and used to assess spatial accuracy.35
Differentiation Between Irreversibly Damaged and Potentially Salvageable Tissue
Group II and III animals were then used to differentiate between irreversibly damaged tissue, and tissue at risk of infarction that could be saved on reperfusion. Therefore, acute infarction risk maps were further partitioned into (1) normal appearing tissue (acute infarction probability <50%); (2) irreversibly damaged tissue (acute infarction probability >50% and tissue abnormality at follow-up stage); and (3) potentially salvageable tissue at risk (acute infarction probability >50% and normal tissue appearance at follow-up stage). The infarction probability threshold that optimally separated potentially salvageable from irreversibly damaged tissue was determined by calculating interclass and intraclass infarction probability variance at probability values between 1% and 100%. Optimal differentiation was considered at the threshold for which interclass and intraclass variances were highest and lowest, respectively.36 The derived threshold was then applied to assess the overlap (with DSI) of: acutely predicted irreversibly damaged tissue and infarction at follow-up (i.e., TP); acutely predicted irreversibly damaged tissue and salvaged tissue at follow-up (i.e., FP); acutely predicted potentially salvageable tissue and normal appearing tissue at follow-up (i.e., TN); and acutely predicted potentially salvageable tissue and infarction at follow-up (i.e., FN).
Statistical Analysis
Mean predicted infarction risk for each algorithm was compared using repeated measures ANOVA with post hoc Tukey HSD correction. Prediction performance measures and tissue volume fractions were compared using a two-tailed Kruskal–Wallis test. Unpaired data were subsequently tested with post hoc two-tailed Mann–Whitney rank sum test and false discovery rate (fdr) correction; pairwise comparisons were tested with two-tailed Mann–Whitney signed rank test with fdr correction.
Results
Acute and Follow-Up Lesion Volumes
Figure 1 shows lesion volumes, expressed as hemispheric lesion fraction (HLFs), calculated from acute diffusion, acute perfusion, and follow-up T2 MRI. In the acute phase, diffusion- and perfusion-based lesion volumes were not statistically different between groups; at follow-up, however, infarct volumes in Group I (permanent filament MCAo; day 3) were significantly larger than those in Groups II and III (embolic MCAo with reperfusion; day 7). All groups showed a significantly smaller acute diffusion-based lesion volume as compared with the volume of acute perfusion loss, i.e., ‘perfusion-diffusion mismatch'. Follow-up T2-based lesion volume was comparable to the acute perfusion-based lesion volume in Group I, and to the acute diffusion-based lesion volume in Groups II and III. Magnetic resonance imaging at 24 hours after stroke revealed that the tissue volume with perfusion abnormality had reduced by >40% in all but one (Group III) animal in Groups II and III, indicative of reperfusion.
Figure 1.

Hemispheric lesion fractions (HLFs) based on abnormal values on acute apparent diffusion coefficient (ADC) maps (‘acute diffusion'), acute mean transit time (MTT) maps (‘acute perfusion') and follow-up T2-weighted images (‘follow-up T2'), respectively, in Groups I–III (mean+sd). *P<0.05 versus acute perfusion-based HLF; §P<0.05 versus Group I follow-up T2-based HLF.
Prediction of Infarction
The five predictive algorithms were trained with Group I data and subsequently applied to Group I, II, and III data. Figure 2 shows examples of resultant infarction probability maps in Group I, II, and III animals. Based on AUCroc, AUCpr, sensitivity, and specificity values, all algorithms predicted actual infarction approximately equally well in (training) Group I (Figure 3). The size of overlap between the 50% risk-thresholded predicted infarction and actual infarcts on follow-up was similar for all algorithms (mean DSI=0.77±0.11; P=0.99), which was also the case for the areas under the ROC curve (AUCroc=0.88±0.12; P=0.99) and PR curve (AUCpr=0.82±0.12; P=0.74).
Figure 2.

Coronal rat brain slices with acute diffusion (apparent diffusion coefficient (ADC) map; hypointensity) and perfusion abnormalities (mean transit time (MTT) map; hyperintensity) after permanent filament MCA occlusion (MCAo) (Group I) (A); embolic MCAo followed by vehicle treatment (Group II) (B); and embolic MCAo followed by recombinant tissue plasminogen activator (rt-PA) treatment (Group III) (C). Color-coded maps overlaid on anatomic template images display predicted risk of infarction (thresholded at 50%) calculated with generalized linear model (GLM), generalized additive model (GAM), support vector machine (SVM), adaptive boosting (ADA), and random forest (RF) algorithms. Predicted infarction in Group I (A) corresponded well with the infarct on follow-up (F/U) T2 map (hyperintensity), whereas infarct predictions in Groups II (B) and III (C) overestimated the ultimate infarct. Heterogeneity in risk values within the predicted infarction areas was particularly evident on GLM-based maps in Group III (C), in which the follow-up infarct correlated well with high risk values (green arrowheads), whereas salvaged tissue had distinctively lower risk values. This was less evident for ADA- or SVM-based predictions.
Figure 3.

Performance measures of the predictive algorithms for Groups I, II, and III (mean+s.d.). AUCroc, area under the receiver operator characteristic (ROC) curve; AUCpr, area under the precision-recall (PR) curve; SNC, sensitivity; SPC, specificity; DSI, Dice's similarity index at a risk threshold of 50% GLM, generalized linear model; GAM, generalized additive model; SVM, support vector machine; ADA, adaptive boosting; RF, random forest. *P<0.05 versus Group I; ¥P<0.05 versus GLM.
Prediction accuracy in Groups II and III was similar for all algorithms. In contrast to Group I, however, the volumes of increased risk of infarction were significantly larger than follow-up infarct volumes in Groups II and III. This was reflected by significantly lower model specificity, AUCpr, and DSI in Groups II and III as compared with Group I (Figure 3).
Infarction probability values within the predicted infarction volume were significantly different between algorithms (Table 1), despite similarity in size of the predicted infarction (P=0.83). Overall, mean infarction probability in predicted infarction volume was highest for ADA, and lowest for GLM. For all algorithms, infarction probability values in the predicted infarct volume were significantly higher in Group I as compared with Groups II and III, which was associated with a higher degree of perfusion loss (see also Figure 5). Nevertheless, the infarction probability values of tissue that actually infarcted were not significantly different between groups (Table 1).
Table 1. Predicted hemispheric infarction fractions and infarction probability.
| Model | Group | Hemispheric fraction |
Infarction probability |
||
|---|---|---|---|---|---|
| PIV | Infarcted tissue | Salvaged tissue | |||
| GLM | |||||
| I | 0.58±0.13 | 84±8 | 91±5 | 69±7 | |
| II | 0.41±0.17† | 70±8* | 87±9 | 67±7 | |
| III | 0.31±0.14*,† | 72±3 | 89±9 | 68±6 | |
| Overall | 75±9 | 89±8 | 67±6 | ||
| GAM | |||||
| I | 0.59±0.15 | 87±6 | 96±4 | 73±9 | |
| II | 0.38±0.17*,† | 77±5 | 96±4 | 75±6 | |
| III | 0.28±0.13*,† | 78±4 | 95±6 | 74±9 | |
| Overall | 81±7 | 96±4 | 74±7 | ||
| SVM | |||||
| I | 0.60±0.15 | 90±2 | 95±2 | 83±4 | |
| II | 0.40±0.16*,† | 83±5* | 96±2 | 81±5 | |
| III | 0.30±0.11*,† | 84±5* | 95±4 | 81±8 | |
| Overall | 86±5 | 95±3 | 82±5 | ||
| ADA | |||||
| I | 0.56±0.15 | 94±4 | 99±0 | 82±8 | |
| II | 0.36±0.18† | 86±4* | 99±2 | 85±5 | |
| III | 0.25±0.12*,† | 87±5 | 97±7 | 85±9 | |
| Overall | 89±5 | 98±4 | 84±7 | ||
| RF | |||||
| I | 0.59±0.14 | 87±5 | 94±3 | 74±8 | |
| II | 0.40±0.17† | 72±5* | 91±5 | 73±5 | |
| III | 0.31±0.10*,† | 75±7* | 91±10 | 73±9 | |
| Overall | 79±8 | 92±6 | 73±7 | ||
| Ultimate infarct | |||||
| I | 0.61±0.22 | ||||
| II | 0.13±0.08* | ||||
| III | 0.12±0.11* | ||||
ADA, adaptive boosting; GLM, generalized linear model; GAM, generalized additive model; RF, random forest; SVM, support vector machine.
Hemispheric fractions reflect the portions of ipsilateral tissue that was predicted to become infarcted (at 50% risk threshold) as calculated with GLM, GAM, SVM, ADA, and RF, and that ultimately turned out to be infarcted (on follow-up T2 maps). Infarction probability (%) was calculated in the entire predicted infarction volume (PIV), and in the portions that were ultimately infarcted and salvaged at follow-up. Values are shown as mean±s.d. for Groups I, II, and III, and averaged over all groups (‘Overall'). Overall mean infarction probability in the predicted infarction volume was significantly different between all algorithms (Kruskall–Wallis test: P<0.001). *P<0.05 versus Group I; †P<0.05 versus ultimate infarct fraction.
Differentiation Between Irreversibly Damaged and Potentially Salvageable Tissue
Table 1 shows that infarction probabilities in the predicted infarction volume were lower in subsequently salvaged tissue as compared with ultimately infarcted tissue, which was most evident for GLM. Infarction probability profiles within the predicted infarction volumes were further categorized based on the smallest intraclass and largest interclass variance of areas that corresponded with eventually salvaged (FP) and eventually infarcted tissue (TP). Optimization yielded the lowest threshold for GLM (74±1.0%, P<0.05 versus all other algorithms). For ADA, the threshold value was highest (82±1.4%). Figure 4 depicts density profiles of calculated infarction probabilities in Groups II and III. Infarction probability difference between potentially salvageable and irreversibly damaged tissue was largest for GLM (20±6.9%) and GAM (21±5.0%), which was significantly higher than the difference (13±4.3%) calculated with ADA (P<0.05). Absolute values of acute MRI parameters in contralateral gray matter and potentially salvageable and irreversibly damaged ipsilateral tissue are presented in Supplementary Table 1.
Figure 4.

Density plots of acute infarction probabilities calculated with generalized linear model (GLM), generalized additive model (GAM), support vector machine (SVM), adaptive boosting (ADA), and random forest (RF) in Groups II (A) and III (B). The plots show the distribution of infarction probability values (0% to 100%) in ipsilateral normal-appearing tissue (‘normal'), potentially salvageable tissue (‘salvageable'), and irreversibly damaged tissue (‘irreversible'). Based on retrospective comparison between acute and follow-up tissue status, risk thresholds were determined that optimally differentiated between ‘normal' and ‘salvageable' (green dashed lines), and ‘salvageable' and ‘irreversible' (red dashed lines). GLM, GAM, and RF allowed for larger differentiation between acutely predicted salvageable tissue and irreversibly damaged tissue than SVM and ADA. For GLM, GAM, and RF, the percentage of voxels that were actually salvaged and acutely predicted as salvageable (i.e., true negatives) was positively balanced compared with the percentage of voxels acutely derived as irreversibly damaged (i.e., false positives) (percentages at top of each facet). In contrast, ADA and SVM revealed a negative balance. ROI, region of interest.
Figure 5 shows that in all groups, acute CBF, MTT, and Tmax values were significantly different in the predicted irreversibly damaged and potentially salvageable tissue as compared with contralateral, indicative of critical perfusion loss. The ADC values were significantly lowered in potentially salvageable tissue, but ADC values of predicted irreversibly damaged tissue were lower (P<0.001). T2 values were also significantly different in the predicted irreversibly damaged and potentially salvageable tissue as compared with contralateral. Furthermore in Group II, T2 was slightly elevated in irreversibly damaged tissue compared with salvageable tissue. These changes are reflective of progressive tissue injury.
Figure 5.

Relative T2, apparent diffusion coefficient (ADC), cerebral blood flow (CBF), mean transit time (MTT), and Tmax values (compared with normal appearing contralateral values) in generalized linear model (GLM)-predicted areas of irreversibly damaged (infarction probability >74%) or potentially salvageable tissue (infarction probability <74% but >50%) for Groups I, II, and III within 2 hours after stroke. *P<0.05 versus predicted salvageable tissue.
The overlap (expressed as DSI and depicted in Figure 6) between acutely predicted infarction volume and actual infarct volume at follow-up revealed that GLM and RF recognized potentially salvageable tissue best with highest overlap of predicted salvageable and actually salvaged tissue (TN), and lowest overlap of acutely predicted irreversibly damaged tissue but salvaged tissue at follow-up (FP). The TN DSI values for GLM and RF corresponded with the degree of overlap between the acute perfusion-diffusion mismatch volume and noninfarcted tissue at follow-up (DSI=0.82±0.12). The FN DSI values for GLM and RF were also comparable to DSI between the perfusion-diffusion mismatch and subsequently infarcted tissue (DSI=0.05±0.08).
Figure 6.

Overlap, expressed as Dice's similarity index (DSI), between volumes of acutely predicted tissue fate—i.e., irreversibly damaged or potentially salvageable—from the five predictive algorithms (generalized linear model (GLM), generalized additive model (GAM), support vector machine (SVM), adaptive boosting (ADA), random forest (RF)), and eventual outcome—i.e., infarction or salvaged—on follow-up scans. TP, true positive; FN, false negative; TN, true negative; FP, false positive. *P<0.05 versus GLM.
Support vector machine performed worst with lowest overlap for TN, and highest overlap of FP. Additionally, overlap of predicted irreversibly damaged and ultimate infarction at outcome (TP) was also lowest for SVM.
Discussion
This study tested five different algorithms for early prediction of poststroke tissue outcome, by evaluating accuracy in predicting brain infarction, and efficacy in differentiating potentially salvageable tissue from irreversibly damaged tissue. All algorithms performed equally well in acutely predicting the extent of tissue that infarcted chronically after permanent filament MCAo in rats. In a rat model of embolic stroke with subsequent spontaneous or rt-PA-induced reperfusion, it was shown that differences in the distribution of acutely predicted infarction risk values, particularly with GLM and RF algorithms, could be exploited to differentiate salvageable tissue from irreversibly damaged tissue.
Previous predictive modeling studies have speculated on the use of differences in spatial distribution of calculated infarction probabilities as a tool for selecting stroke patients eligible for therapeutic intervention12 and for estimating potential treatment responsiveness.30 It has, for instance, been suggested that the level of predicted infarction risk provides insight in the likelihood of reperfusion.30 Our data show that tissue salvageability on reperfusion is associated with the degree of infarction risk, which depends on the level of acute ischemic injury.
Algorithms were first trained in a model of permanent MCAo (Group I) to predict infarction when cerebral ischemia is sustained, i.e., without reperfusion that could reverse the progression of ischemic tissue injury. Animals in Groups II and III benefited from early spontaneous or rt-PA-induced reperfusion, which prevented lesion growth. Consequently, in contrast to Group I, follow-up infarctions were significantly smaller than the volume of acute perfusion loss. This allowed us to retrospectively identify potentially salvageable tissue from the acute MRI data set, which we compared against the calculated probability of infarction modeled in Group I, i.e., if reperfusion would have been absent. Although algorithms were not perfect in predicting the final infarct (DSI<1.0), for each algorithm the calculated infarction probability of tissue that indeed became infarcted, which was not significantly different between the three groups (Table 1), showing the sensitivity and specificity of infarction probability calculation on underlying tissue status, with relative independence on differences in stroke models (e.g., filament versus embolic MCAo), anesthesia (e.g., fentanyl citrate and fluanisone versus isoflurane), and MRI settings (e.g., small variations in imaging parameters). In all groups infarction probability values reflected the degree of acute ischemic injury, expressed by perfusion reduction (high probability of infarction was associated with lowered CBF, and prolonged MTT and Tmax) and tissue impairment (high probability of infarction was associated with lowered ADC and prolonged T2).
In earlier studies, the findings of different correlations between acute brain tissue ADC37 or perfusion,5 and subsequent infarction—reflective of the complex, heterogeneous and dynamic nature of stroke pathophysiology—have raised the question whether nonlinear relations of acute tissue status and eventual outcome can be sufficiently captured with linear algorithms like GLM.12, 15, 25 To that end, SVM and GAM have previously been introduced, and the current study adds ADA and RF, as potentially more effective models for nonlinear relationships.15, 16
Our study shows that the level and distribution of calculated infarction probability values can differ significantly between these types of predictive algorithms. Where SVM and ADA provided relatively smooth infarction probability maps, the distribution of risk values was more heterogeneous with GLM, GAM, and RF. These differences may be related to the underlying method for discriminating infarcting from noninfarcting tissue. Regression models (GLM and GAM) and RF define a more direct relation of the training samples to the corresponding outcome. In ADA, and particularly in SVM, however, this relation is more indirect and aimed at iteratively optimizing the margin (dividing plane) that optimally separates infarcted from noninfarcted tissue in the training samples.27 Furthermore, SVM, originally a binary classifier, requires an additional conversion step to obtain probabilistic values, which may impose less accurate approximation of probability.27
Nevertheless, the lack of significant differences between linear and nonlinear algorithms in predicting the extent of infarction at follow-up, which is in line with previous studies in experimental settings16 and in human patients,38 challenges the advantage of complex (nonlinear) predictive algorithms for improved stroke outcome prediction. Our study suggests that the use of such algorithms may impose loss of additional information that could be of importance for further differentiation of heterogeneous tissue conditions. The distribution of infarction probabilities calculated with GLM, GAM, or RF was better linked to different tissue outcome, i.e., irreversibly damaged or salvaged. Nevertheless, it remains questionable whether any of these algorithms can fully capture the complexity of poststroke tissue dynamics within a single algorithm, particularly when timings of stroke onset and reperfusion vary. We speculate that multiple or hierarchically arranged algorithms, each describing a different aspect of tissue outcome, might provide improved prediction estimates.25, 27 Careful selection of training data,17 and incorporation of additional imaging or nonimaging biomarkers, such as tissue pH,39 oxygen extraction fraction,40 artery occlusion site,41 or time after stroke onset may further contribute to voxel-based stroke outcome predictions without increasing diagnostic complexity.25
In conclusion, we observed that different predictive algorithms are similarly effective in depicting tissue at risk of infarction. However, these algorithms had varying efficacy in differentiating between areas that were irreversibly damaged versus areas that could be salvaged after reperfusion. Our experimental stroke study allowed direct comparison between acute infarction predictions and ultimate tissue outcomes, and showed that multiparametric MRI-based predictive modeling—with GAM, RF, and particularly GLM algorithms—enables discrimination between irreversibly damaged and potentially salvageable tissue. These predictive models performed equally well in identifying tissue amenable to reperfusion as compared with the perfusion-diffusion mismatch model. Added value of the statistical algorithms is provided by the quantitative information on infarction probability on a voxelwise basis. Where assessment of tissue viability based on single indices and a single threshold is challenging (particularly in heterogeneous clinical settings), predictive algorithms give a quantitative likelihood of infarction or salvageability based on multiple parameters where each parameter describes a different aspect of the pathophysiologic condition. This may contribute to more confident treatment decision making and subsequent monitoring in the early stages of ischemic stroke. These predictive algorithms, which are readily applicable in preclinical and clinical settings, therefore provide promising means for treatment decision making and treatment efficacy monitoring after acute ischemic stroke.
The authors declare no conflict of interest.
Footnotes
Supplementary Information accompanies the paper on the Journal of Cerebral Blood Flow & Metabolism website (http://www.nature.com/jcbfm)
The research leading to these results was funded by the Netherlands Heart Foundation (2005B156), and the European Union's Seventh Framework Programme (FP7/2007-2013) under grant agreements n° 201024 and n° 202213 (European Stroke Network).
Supplementary Material
References
- Hacke W, Kaste M, Bluhmki E, Brozman M, Dávalos A, Guidetti D, et al. Thrombolysis with alteplase 3 to 4.5 hours after acute ischemic stroke. N Engl J Med. 2008;359:1317–1329. doi: 10.1056/NEJMoa0804656. [DOI] [PubMed] [Google Scholar]
- Davis SM, Donnan GA, Parsons MW, Levi C, Butcher KS, Peeters A, et al. Effects of alteplase beyond 3 h after stroke in the Echoplanar Imaging Thrombolytic Evaluation Trial (EPITHET): a placebo-controlled randomised trial. Lancet Neurol. 2008;7:299–309. doi: 10.1016/S1474-4422(08)70044-9. [DOI] [PubMed] [Google Scholar]
- Donnan GA, Baron J-C, Ma H, Davis SM. Penumbral selection of patients for trials of acute stroke therapy. Lancet Neurol. 2009;8:261–269. doi: 10.1016/S1474-4422(09)70041-9. [DOI] [PubMed] [Google Scholar]
- Hjort N, Christensen S, Sølling C, Ashkanian M, Wu O, Røhl L, et al. Ischemic injury detected by diffusion imaging 11 minutes after stroke. Ann Neurol. 2005;58:462–465. doi: 10.1002/ana.20595. [DOI] [PubMed] [Google Scholar]
- Sorensen AG, Copen WA, Ostergaard L, Buonanno FS, Gonzalez RG, Rordorf G, et al. Hyperacute stroke: simultaneous measurement of relative cerebral blood volume, relative cerebral blood flow, and mean tissue transit time. Radiology. 1999;210:519–527. doi: 10.1148/radiology.210.2.r99fe06519. [DOI] [PubMed] [Google Scholar]
- Schellinger PD, Bryan RN, Caplan LR, Detre JA, Edelman RR, Jaigobin C, et al. Evidence-based guideline: The role of diffusion and perfusion MRI for the diagnosis of acute ischemic stroke: report of the Therapeutics and Technology Assessment Subcommittee of the American Academy of Neurology. Neurology. 2010;75:177–185. doi: 10.1212/WNL.0b013e3181e7c9dd. [DOI] [PMC free article] [PubMed] [Google Scholar]
- Kidwell CS, Alger JR, Saver JL. Beyond mismatch: evolving paradigms in imaging the ischemic penumbra with multimodal magnetic resonance imaging. Stroke. 2003;34:2729–2735. doi: 10.1161/01.STR.0000097608.38779.CC. [DOI] [PubMed] [Google Scholar]
- Sobesky J. Refining the mismatch concept in acute stroke: lessons learned from PET and MRI. J Cereb Blood Flow Metab. 2012;32:1416–1425. doi: 10.1038/jcbfm.2012.54. [DOI] [PMC free article] [PubMed] [Google Scholar]
- Hjort N, Butcher K, Davis SM, Kidwell CS, Koroshetz WJ, Röther J, et al. Magnetic resonance imaging criteria for thrombolysis in acute cerebral infarct. Stroke. 2005;36:388–397. doi: 10.1161/01.STR.0000152268.47919.be. [DOI] [PubMed] [Google Scholar]
- Lo EH, Moskowitz MA, Jacobs TP. Exciting, radical, suicidal: how brain cells die after stroke. Stroke. 2005;36:189–192. doi: 10.1161/01.STR.0000153069.96296.fd. [DOI] [PubMed] [Google Scholar]
- Sobesky J, Zaro Weber O, Lehnhardt F-G, Hesselmann V, Neveling M, Jacobs A, et al. Does the mismatch match the penumbra? Magnetic resonance imaging and positron emission tomography in early ischemic stroke. Stroke. 2005;36:980–985. doi: 10.1161/01.STR.0000160751.79241.a3. [DOI] [PubMed] [Google Scholar]
- Wu O, Christensen S, Hjort N, Dijkhuizen RM, Kucinski T, Fiehler J, et al. Characterizing physiological heterogeneity of infarction risk in acute human ischaemic stroke using MRI. Brain. 2006;129:2384–2393. doi: 10.1093/brain/awl183. [DOI] [PubMed] [Google Scholar]
- Fiehler J, Foth M, Kucinski T, Knab R, von BM, Weiller C, et al. Severe ADC decreases do not predict irreversible tissue damage in humans. Stroke. 2002;33:79–86. doi: 10.1161/hs0102.100884. [DOI] [PubMed] [Google Scholar]
- Wu O, Koroshetz WJ, Ostergaard L, Buonanno FS, Copen WA, Gonzalez RG, et al. Predicting tissue outcome in acute human cerebral ischemia using combined diffusion- and perfusion-weighted MR imaging. Stroke. 2001;32:933–942. doi: 10.1161/01.str.32.4.933. [DOI] [PubMed] [Google Scholar]
- Østergaard L, Jónsdóttir KY, Mouridsen K. Predicting tissue outcome in stroke: new approaches. Curr Opin Neurol. 2009;22:54–59. doi: 10.1097/WCO.0b013e328320d297. [DOI] [PubMed] [Google Scholar]
- Huang S, Shen Q, Duong TQ. Quantitative prediction of acute ischemic tissue fate using support vector machine. Brain Res. 2011;1405:77–84. doi: 10.1016/j.brainres.2011.05.066. [DOI] [PMC free article] [PubMed] [Google Scholar]
- Jonsdottir KY, Østergaard L, Mouridsen K. Predicting tissue outcome from acute stroke magnetic resonance imaging: improving model performance by optimal sampling of training data. Stroke. 2009;40:3006–3011. doi: 10.1161/STROKEAHA.109.552216. [DOI] [PubMed] [Google Scholar]
- Tiebosch IACW, Crielaard BJ, Bouts MJRJ, Zwartbol R, Salas-Perdomo A, Lammers T, et al. Combined treatment with recombinant tissue plasminogen activator and dexamethasone phosphate-containing liposomes improves neurological outcome and restricts lesion progression after embolic stroke in rats. J Neurochem. 2012;123 (Suppl 2:65–74. doi: 10.1111/j.1471-4159.2012.07945.x. [DOI] [PubMed] [Google Scholar]
- Longa EZ, Weinstein PR, Carlson S, Cummins R. Reversible middle cerebral artery occlusion without craniectomy in rats. Stroke. 1989;20:84–91. doi: 10.1161/01.str.20.1.84. [DOI] [PubMed] [Google Scholar]
- Wu O, Østergaard L, Weisskoff RM, Benner T, Rosen BR, Sorensen AG. Tracer arrival timing-insensitive technique for estimating flow in MR perfusion-weighted imaging using singular value decomposition with a block-circulant deconvolution matrix. Magn Reson Med. 2003;50:164–174. doi: 10.1002/mrm.10522. [DOI] [PubMed] [Google Scholar]
- Klein S, Staring M, Murphy K, Viergever MA, Pluim J. elastix: a toolbox for intensity-based medical image registration. IEEE Trans Med Imaging. 2010;29:196–205. doi: 10.1109/TMI.2009.2035616. [DOI] [PubMed] [Google Scholar]
- Smith SM. Fast robust automated brain extraction. Hum Brain Mapp. 2002;17:143–155. doi: 10.1002/hbm.10062. [DOI] [PMC free article] [PubMed] [Google Scholar]
- Mottet I, Demeure R, Rataud J, Lucas M, Wahl F, Warscotte V, et al. Effects of riluzole on the evolution of focal cerebral ischemia: a magnetic resonance imaging study. MAGMA. 1997;5:185–191. doi: 10.1007/BF02594581. [DOI] [PubMed] [Google Scholar]
- Henninger N, Sicard KM, Fisher M. Spectacular shrinking deficit: insights from multimodal magnetic resonance imaging after embolic middle cerebral artery occlusion in Sprague-Dawley rats. J Cereb Blood Flow Metab. 2007;27:1756–1763. doi: 10.1038/sj.jcbfm.9600477. [DOI] [PubMed] [Google Scholar]
- Wu O, Dijkhuizen RM, Sorensen AG. Multiparametric magnetic resonance imaging of brain disorders. Top Magn Reson Imaging. 2010;21:129–138. doi: 10.1097/RMR.0b013e31821e56c2. [DOI] [PMC free article] [PubMed] [Google Scholar]
- Wood SN.(ed).Generalized Additive Models: An Introduction with R Chapman & Hall/CRC: Boca Raton, FL, USA; 2006 [Google Scholar]
- Bishop CM.(ed).Pattern Recognition and Machine Learning Springer: New York, NY, USA; 2007 [Google Scholar]
- Freund Y, Schapire RE. A decision-theoretic generalization of on-line learning and an application to boosting. J Comput Syst Sci. 1997;55:119–139. [Google Scholar]
- Breiman L. Random forests. Mach Learn. 2001;45:5–32. [Google Scholar]
- Wu O, Sumii T, Asahi M, Sasamata M, Ostergaard L, Rosen BR, et al. Infarct prediction and treatment assessment with MRI-based algorithms in experimental stroke models. J Cereb Blood Flow Metab. 2007;27:196–204. doi: 10.1038/sj.jcbfm.9600328. [DOI] [PubMed] [Google Scholar]
- Friedman J. Additive logistic regression: a statistical view of boosting. Ann Stat. 2000;28:337–407. [Google Scholar]
- Freund Y, Schapire R.A desicion-theoretic generalization of on-line learning and an application to boostingIn: Vitányi P (eds). Computational Learning Theory Springer: Berlin/Heidelberg; 199523–37. [Google Scholar]
- Efron B. The jackknife, the bootstrap, and other resampling plans. Society for Industrial Mathematics. 1987.
- Davis J, Goadrich M.The relationship between precision-recall and ROC curvesIn: Cohen WW, Moore A (eds).Proceedings of the 23rd International Conference on Machine Learning ACM: Pittsburgh, PA, USA; 2006233–240. [Google Scholar]
- Dice LR. Measures of the amount of ecologic association between species. Ecology. 1945;26:297–302. [Google Scholar]
- Otsu N. A threshold selection method from gray-level histograms. IEEE Trans Syst Man Cybern. 1979;9:62–66. [Google Scholar]
- Jacobs MA, Knight RA, Soltanian-Zadeh H, Zheng ZG, Goussev AV, Peck DJ, et al. Unsupervised segmentation of multiparameter MRI in experimental cerebral ischemia with comparison to T2, diffusion, and ADC MRI parameters and histopathological validation. J Magn Reson Imaging. 2000;11:425–437. doi: 10.1002/(sici)1522-2586(200004)11:4<425::aid-jmri11>3.0.co;2-0. [DOI] [PubMed] [Google Scholar]
- Gottrup C, Thomsen K, Locht P, Wu O, Sorensen AG, Koroshetz WJ, et al. Applying instance-based techniques to prediction of final outcome in acute stroke. Artif Intell Med. 2005;33:223–236. doi: 10.1016/j.artmed.2004.06.003. [DOI] [PubMed] [Google Scholar]
- Zhou J, Payen J-F, Wilson DA, Traystman RJ, Van Zijl PCM. Using the amide proton signals of intracellular proteins and peptides to detect pH effects in MRI. Nat Med. 2003;9:1085–1090. doi: 10.1038/nm907. [DOI] [PubMed] [Google Scholar]
- An H, Lin W. Quantitative measurements of cerebral blood oxygen saturation using magnetic resonance imaging. J Cereb Blood Flow Metab. 2000;20:1225–1236. doi: 10.1097/00004647-200008000-00008. [DOI] [PMC free article] [PubMed] [Google Scholar]
- Lansberg MG, Thijs VN, Bammer R, Olivot J-M, Marks MP, Wechsler LR, et al. The MRA-DWI mismatch identifies patients with stroke who are likely to benefit from reperfusion. Stroke. 2008;39:2491–2496. doi: 10.1161/STROKEAHA.107.508572. [DOI] [PMC free article] [PubMed] [Google Scholar]
Associated Data
This section collects any data citations, data availability statements, or supplementary materials included in this article.