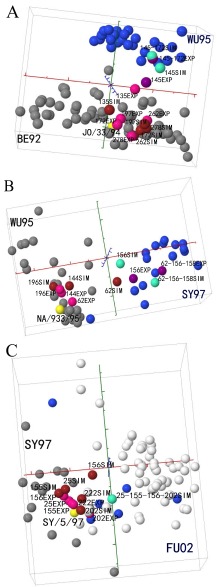
FIG 2 .
Experimental validation of select predicted residues’ ability to drive antigenic drift events. In total, 17 single-, double-, or multiple-site mutants of the residues shown in Table 1 were generated (see Table S2 in the supplemental material for the list). HI experiments were performed with these mutants and their corresponding wild-type strains (JO/33, NA/933, and SY/05). The experimentally generated mutants are denoted by the suffix “EXP.” To facilitate the comparison, we used Antigen-Bridges to project the mutated HA (Fig. 1). The computationally simulated mutants (Table 1) are denoted by the suffix “SIM.” For example, 145EXP in Fig. 2A represents an experimentally derived N145K mutant of JO/33 wild-type virus, whereas 145SIM is a computer-simulated N145K mutant of JO/33s HA sequence. Here, 1 unit corresponds to a 2-fold change in HI value. The overall Pearson’s correlation coefficient r between the experimental and predicted antigenic distance matrices is 0.7148 (see Table S4 in the supplemental material). The two testing antigenic clusters are labeled in gray and blue, respectively. The viruses in white are not antigenically defined. The wild-type strains used in experiments are marked in yellow. The experimentally generated mutants are marked in pink if they are located in the antigenic cluster where their corresponding wild-type strain is located and in purple if in the expected antigenic cluster by mutation(s). The computationally generated mutants are marked in maroon if they are located in the antigenic cluster where their corresponding wild-type strain is located and in green if in the expected antigenic cluster by mutation(s).

