

Abstract
Previous neuroimaging studies of language processing in blind individuals described cortical activation of primary (V1) and higher tier visual areas, irrespective of the age of blindness onset. Specifically, participants were given nouns and asked to generate an associated verb. These results confirmed the presence of adaptations in the visual cortex of blind people and suggested that these responses represented linguistic operations. The present functional magnetic resonance imaging study attempted to further characterize these responses as being preferential for semantic or phonological processing. Three groups of participants (sighted, early-onset, and late-onset blind) heard lists of related words and attended to either a common meaning (semantic task) or common rhyme (phonological task) that linked the words. In all three groups, the semantic task elicited stronger activity in the left anterior inferior frontal gyrus and the phonological task evoked stronger activity bilaterally in the inferior parietal cortex and posterior aspects of the left inferior frontal gyrus. Only blind individuals showed activity in occipital, temporal, and parietal components of visual cortex. The spatial extent of visual cortex activity was greatest in early blind, who exhibited activation in all ventral and dorsal visual cortex subdivisions (V1 through MT) for both tasks. Preferential activation appeared for the semantic task. Late blind individuals exhibited responses in ventral and dorsal V1, ventral V2, VP and V8, but only for the semantic task. Our findings support prior evidence of visual cortex activity in blind people engaged in auditory language processing and suggest that this activity may be related to semantic processing.
INTRODUCTION
When blind people read Braille, neural regions traditionally invoked for visual processing are activated (Büchel et al. 1998a,b; Burton et al. 2002a; Cohen et al. 1997, 1999; Hamilton et al. 2000; Melzer et al. 2001; Sadato et al. 1996, 1998). Some prior studies show that individuals born blind exhibit activity in primary visual cortex (V1) and multiple higher tier visual areas (Cohen et al. 1997, 1999; Sadato et al. 1996, 1998, 2002). Conversely, some studies report that individuals who lose sight after having learned to read print show stronger V1 activity than those born blind (Büchel et al. 1998a,b; Melzer et al. 2001).
The conclusions that can be drawn from the observed differences in V1 activity that vary with age of blindness onset are tempered by task differences across studies. Some studies required orthographic processing of individual Braille letters (Cohen et al. 1997, 1999). The study that reported greater activity in V1 in late blind relative to early blind individuals used an orthographic task that required participants to detect whether any Braille cells had dot 6 elevated in read words or consonant strings (Büchel et al. 1998a,b); the degree to which this orthographic task was accompanied by semantic processes inherent in word reading is unclear. Stronger V1 activity in early blind (relative to late blind) was reported in a study that had early and late blind participants read Braille words (Sadato et al. 1996, 1998). Another study that also involved reading Braille words reported the opposite finding of greater activity in V1 of late blind people (Melzer et al. 2001). We (Burton et al. 2002a) employed a verb-generation task to Braille-read nouns. The semantic demands inherent in this task (Gabrieli et al. 1998; Seger et al. 1999) might thus underlie finding primary and higher visual cortex responses in all blind participants irrespective of the age of blindness onset.
The finding of different patterns of activation within visual cortex in blind and sighted individuals should not overshadow the commonalities observed. For example, left inferior and dorsolateral frontal cortical language regions responded similarly in blind people reading Braille and sighted participants reading print (Burton et al. 2002a). This result has several implications. Reorganization of language within blind people is selective to certain cortical regions, and possibly just within the visual cortex.
The contribution that the visual cortex makes to language within blind people might be a cross-modal sensory process that occurs in Braille reading before language analyses in frontal cortex. We previously suggested that visual cortex activity in blind people reflects lexical processes because of finding similar response patterns in all blind, but not sighted, people when they generated verbs that were associated to heard nouns (Burton et al. 2002b). Visual cortex responses in this study largely resembled those noted previously with Braille reading. The comparability of results across studies using verb generation to auditorily presented nouns and Braille reading suggests that activation in visual cortex during language tasks may reflect language mechanisms.
Various lexical tasks identify cortical regions preferentially activated by semantic or phonological processing in sighted participants (Binder 1997; Demb 1995; Fiez et al. 1995, 1997, 1998; Gabrieli et al. 1998; Klein et al. 1995; McDermott et al. 2003; Petersen et al. 1989; Poldrack et al. 1999; Polk et al. 2002; Price 2000; Roskies et al. 2001; Rumsey et al. 1997; Tagamets et al. 2000; Vandenberghe et al. 1996; Zatorre et al. 1996, 2001). Several studies report that the anterior left inferior frontal gyral cortex (aLIFG) responds during semantic processing tasks (Demb et al. 1995; Gabrieli et al. 1998; Gold and Buckner 2002; Ojemann et al. 1998; Roskies et al. 2001; Wagner et al. 2001). The left middle and posterior temporal cortex also activates during semantic tasks (Fiez and Petersen 1998; Gold and Buckner 2002; McDermott et al. 2003; Price 2000; Raichle et al. 1994; Roskies et al. 2001). In contrast, phonologically related tasks preferentially activate more posterior and superior parts of the left inferior frontal gyrus (pLIFG) and a region within the inferior parietal cortex and adjoining supramarginal gyrus (Fiez et al. 1998 1999; Gold and Buckner 2002; Jonides et al. 1998; McDermott et al. 2003; Poldrack et al. 1999; Roskies et al. 2001). Such regional selective activity has been observed independent of variations in the difficulty of imposed language tasks (Gabrieli et al. 1998).
In the present study, we sought to determine whether visual cortex activity in blind people was functionally dissociable by semantic versus phonological processing tasks. If this activity is indeed language related, one might expect it to be preferentially active for one or the other task. Our approach involved using a prior paradigm that had sighted participants view and selectively attend to the common meaning or rhyme that linked a list of related words (McDermott et al. 2003). We used an auditory version of the same protocol. Blind and sighted participants heard lists containing 16 words; all words within the list were presented in 10 s. This rapid pace required effort to understand and appropriately link the meaning or rhyme of heard words. A secondary objective was determining whether all participant groups showed dissociable frontal language areas. That is, we sought to determine whether the anterior/posterior distinction for semantic and phonological processing as reported previously (McDermott et al. 2003) would generalize to an auditory presentation modality and across all three groups.
METHODS
Participants
Nine early blind, 7 late blind, and 8 sighted volunteers provided informed consent following guidelines approved by the Human Studies Committee of Washington University. Except for ophthalmological conditions as the cause of blindness, all participants were free of neurological disease and had normal brain anatomy. All blind participants were Braille literate, and their identification numbers were retained, where applicable, from involvement in previous studies (Burton 2002a,b) (Table 1). Of the 9 early blind participants, 7 had no sight at birth, and 2, who lost all sight by age 5 yr, never learned print. In contrast, all participants in the late blind group could read print before having to learn Braille. The average age at onset of blindness for the late blind group was 17.7 yr (range 7–36). All sighted and 14 of the 16 blind participants were predominantly right-handed as indicated by scores >80% on the Edinburgh handedness inventory (Raczkowski et al. 1974) (Table 1).
TABLE 1.
Participant characteristics
| ID No. | Age | Sex | Right Hand Score | wpm | Age Onset | Light Sense | Years Reading | Cause of Blindness |
|---|---|---|---|---|---|---|---|---|
| Early blind | ||||||||
| Early 2 | 51 | M | 82 | 152.0 | 0 | None | 45 | Retrolental fibroplasia |
| Early 3 | 51 | F | 100 | 143.8 | 0 | None | 47 | Optic nerve |
| Early 4 | 36 | F | 45 | 76.0 | 0 | Some | 27 | Optic nerve |
| Early 5 | 41 | F | 100 | 99.6 | 3 | None | 36 | Glaucoma |
| Early 7 | 70 | M | 100 | 63.8 | 5 | None | 63 | Cataracts |
| Early 9 | 46 | M | 100 | n/a | 0 | None | 42 | Retrolental fibroplasia |
| Leber’s Congenital | ||||||||
| Early 11 | 25 | M | 82 | 76.0 | 0 | Some | 20 | Amaurosis |
| Early 12 | 24 | M | 100 | 72.5 | 0 | None | 20 | Retrolental fibroplasia |
| Early 13 | 68 | F | 91 | 88.7 | 0 | None | 60 | Eye infection |
| Avg | 45.8 | 89 | 96.6 | 0.9 | 40 | |||
| Late blind | ||||||||
| Late 1 | 37 | F | 55 | 81.8 | 7 | Yes | 31 | Rubella |
| Late 2 | 52 | M | 100 | 66.5 | 10 | None | 47 | Glaucoma |
| Late 3 | 42 | M | 82 | 72.5 | 11 | None | 31 | Coats’ disease |
| Late 4 | 64 | M | 100 | 83.9 | 12 | None | 56 | Glaucoma |
| Late 5 | 68 | F | 100 | n/a | 21 | None | 50 | Retinitis pigmentosa |
| Late 6 | 49 | F | 100 | 125.0 | 27 | None | 20 | Retinitis pigmentosa |
| Late 7 | 48 | F | 100 | 32.6 | 36 | None | 10 | Stephen–Johnson syndrome |
| Avg | 51.4 | 91 | 77.0 | 17.7 | 35 | |||
| Sighted | ||||||||
| Sighted 1 | 58 | M | 100 | |||||
| Sighted 2 | 46 | M | 100 | |||||
| Sighted 3 | 22 | M | 100 | |||||
| Sighted 4 | 46 | M | 100 | |||||
| Sighted 5 | 20 | M | 100 | |||||
| Sighted 6 | 48 | M | 100 | |||||
| Sighted 7 | 27 | F | 100 | |||||
| Sighted 8 | 22 | F | 100 | |||||
| Avg | 42.5 | 100 | ||||||
Tasks
All participants performed 2 lexical tasks that involved auditory presentation of word lists. Each word list contained 16 words that were linked either by a common meaning or a common rhyme. Immediately preceding each list, participants heard a cue word (“MEANING” or “RHYME”) that served to direct their attention to the list that followed. For the MEANING trials participants were told to attend to the semantic relations among words within the list and to attempt to covertly identify a word that had a meaning relating it to most of the heard words and that was not presented in the list. For example, participants might have heard “bed, rest, awake,” and so forth, all of which are related to the nonpresented word “sleep.” Likewise, for the RHYME trials participants were told to attend to the phonological relations among the words within the list and to attempt to covertly identify a word that rhymed with most of the heard words and that was not presented in the list. Thus the tasks differed in cognitive demands, given that the MEANING task required attention to word definitions (semantics), whereas the RHYME task required attention to word sounds (phonetics). Participants had to listen to all words in a list before identifying an appropriate word with a related meaning or similar rhyme. Before the scans, participant understanding of the tasks was gauged using overt responses to practice trials. We also told participants that there were no correct or incorrect responses. All participants were instructed to close their eyes during the scans. (However, sighted subjects did not wear blindfolds.)
Lists were created by selecting phonemically unambiguous words from a prior study (McDermott et al. 2003). The spoken word lists were created by having a female read the words into a digital audio editor (Sound Forge 5 from Sonic Foundary.com), which ran on a Dell notebook computer (Latitude C600). We inserted artificial silent periods before and after each word, equalized sound intensities, and placed a 100-ms interval between words. Then, total duration of each 16-word list was compressed to 10 s. Word list presentation was synchronized with the scanner frame sequence shown in Fig. 1B. All participants heard the same word lists. However, the sequential order of word list presentation was reversed for half the participants. Table 2 contains example word lists used in one run. During scanning, each word list was presented in 10 s (Fig. 1B, frames F9–F12). The word lists followed approximately 1 s after the cue. An approximately 17-s control period containing no words (for example, Fig. 1B, frames F13–F18) intervened between presentation of each word list. Scanner noise was continuous throughout every run. The interval for cue, word list, and control period constituted a single event (i.e., trial) that lasted for 10 repetition times (TR) (i.e., frames).
FIG. 1.
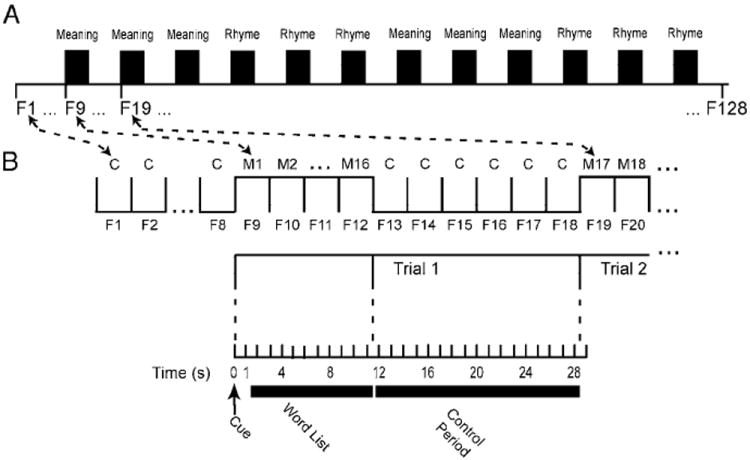
Task paradigm in relation to scanner frame sequence (F1, F2, F3, …, F128). A: each run consisted of alternating periods when participants heard list of 16 words or just scanner noises. Each word list was preceded by a spoken cue that instructed participants to attend either to meaning or rhyme that related all words in list. Three successive trials for MEANING and RHYME lists alternated. B: each run started with 8 baseline frames (F1– F8) during which participants heard no words. A cue word was heard at the beginning of frame 9 (F9) followed by 16 word list over ensuing 10 s, which occupied the balance of F9 and F10– F12. No words were presented during the next 6 frames (F13–F18). Cycle restarted on the next frame (F19). Each group of 10 frames was a miniblock, defined as one event (Trial 1, Trial 2, ⋯). Every word was different throughout all runs (M1, M2, M3, ⋯). Six frame intervals following the words were considered control period when evoked hemodynamic responses could return to baseline levels (C, C, C ⋯).
TABLE 2.
Wordlists for one BOLD run
| MEANING 1 | MEANING 2 | MEANING 3 | RHYME 4 | RHYME 5 | RHYME 6 |
|---|---|---|---|---|---|
| truck | white | dislike | fish | pest | yell |
| bus | dark | love | dish | best | fell |
| train | cat | hostility | publish | contest | well |
| automobile | charred | anger | establish | stressed | shell |
| vehicle | night | detest | swish | suggest | spell |
| drive | funeral | resent | Irish | midwest | cell |
| jeep | color | fear | banish | digest | bell |
| Ford | grief | jealousy | blemish | nest | gel |
| race | blue | envy | fetish | quest | pastel |
| keys | death | despise | rubbish | crest | hell |
| garage | ink | abhor | squish | vest | sell |
| highway | bottom | war | varnish | processed | tell |
| sedan | coal | enemy | anguish | expressed | swell |
| van | brown | loathe | ticklish | dressed | dwell |
| taxi | gray | disgust | furnish | arrest | gazelle |
| gas | tuxedo | like | flourish | zest | hotel |
|
| |||||
| MEANING 7 | MEANING 8 | MEANING 9 | RHYME 10 | RHYME 11 | RHYME 12 |
|
| |||||
| blouse | bounce | butter | bake | brand | fold |
| sleeves | throw | food | make | bland | told |
| pants | basket | eat | take | stand | bold |
| tie | bowling | sandwich | quake | sand | sold |
| button | golf | rye | stake | band | mold |
| shorts | play | jam | wake | land | polled |
| iron | tennis | milk | cake | and | gold |
| polo | soccer | flour | flake | watchband | old |
| collar | round | jelly | rake | newsstand | strolled |
| vest | catch | dough | fake | expand | hold |
| pitch | crust | mistake | farmland | scold | |
| jersey | moth | slice | shake | grand | unrolled |
| belt | bat | wine | forsake | gland | twofold |
| linen | kick | loaf | cornflake | demand | behold |
| cuffs | racket | toast | ache | command | billfold |
| cotton | hit | wheat | brake | disband | rolled |
For trials 1–12 possible (nonpresented) linking words are, respectively, CAR, BLACK, HATE, WISH, TEST, SMELL, CLOTHES, BALL, BREAD, SNAKE, HAND, and COLD. Words shown italicized were presented during the free choice recognition test.
Each word list type (MEANING or RHYME) was repeated in three successive trials before alternating to three trials of the other type (Fig. 1A). Every trial contained unique words that never recurred throughout the study. Every functional magnetic resonance imaging (fMRI) run began with 8 control frames to allow for T-1 equilibration effects. These were followed by 12 word list trials during the succeeding 120 frames (Table 2). Therefore each fMRI run consisted of 128 frames; each frame was 2.844 s in duration. Nearly all participants completed six runs, thereby listening to 36 word lists of each type.
Following the last scan, task performance was assessed using a free choice recognition test. Participants indicated for each of 144 auditorily presented words whether they recognized it as having been previously heard in the experiment. One word from each list presented during the fMRI scans was randomly selected for this test. Thus half of the words had been studied (36 in the MEANING task, 36 in the RHYME task; see Table 2 for examples), and half were novel. For every participant, we determined the percentage correct for overall recognition (i.e., correctly rejecting words not presented and correctly identifying presented words as such) (Fig. 2). In a pilot study, when participants knew this recognition test would follow the fMRI scans, they attempted to memorize the words, making the semantic and phonological tasks more difficult and interfering with their ability to perform. For this reason, participants were not informed before scanning that there would be a recognition test, and performance was assessed only after all runs were completed.
FIG. 2.
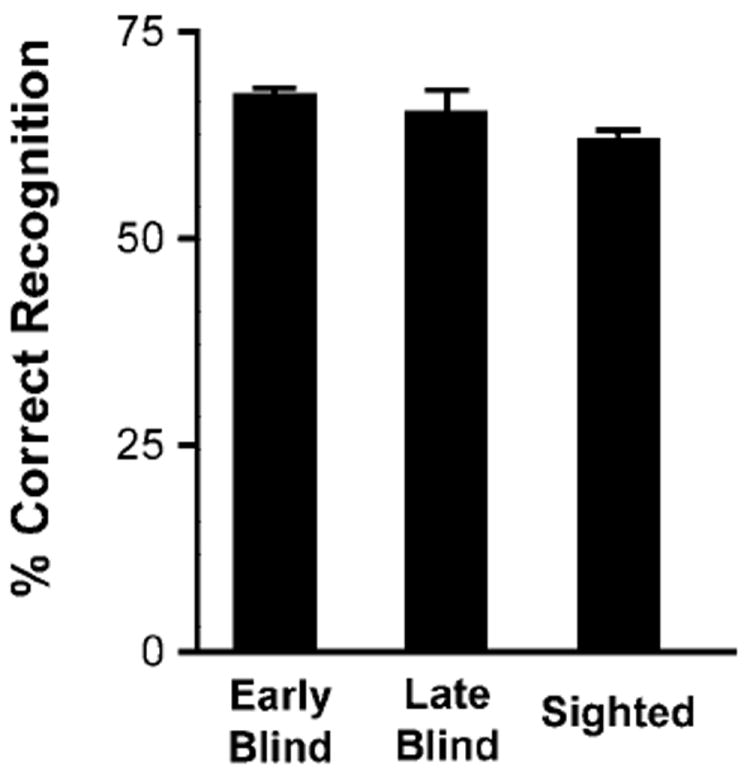
Percentage correct performance for early blind, late blind, and sighted participants on free choice recognition test. Each bar shows mean and SE by participant group for all words used in recognition test (combined), half of which were not presented during scans, and for selected words heard during trials cued to common meaning or rhyme. The latter consisted of one word from every list.
MRI acquisition
fMRI were acquired on a Siemens 1.5 Tesla Vision scanner using a standard circularly polarized head coil. Functional images were collected with a custom, single-shot asymmetric spin-echo, echo-planar (EPI) sequence with T2* evolution time of 50 ms from a 90° flip angle (Conturo et al. 1996; Ogawa et al. 1990). Whole brain coverage was obtained with 21 contiguous 6-mm axial slices that were acquired parallel to the anterior– posterior commissure; in-plane resolution was 3.75 × 3.75 mm pixels (240-mm field of view with 64 × 64-image matrix). EPI slice prescriptions were registered to an atlas representative target image using a coarse (2-mm cubic voxel) sagittal magnetization prepared rapid gradient echo (MP-RAGE) sequence (Mugler and Brookeman 1990).
Structural images provided the basis for atlas transformation. These included a T2-weighted spin echo (SE) axial scan [1 × 1 × 6 mm, TR = 3,800 ms; echo time (TE) = 22 ms] and a high-resolution (1 × 1 × 1.25 mm) T1-weighted sagittal MP-RAGE [TR = 9.7 ms, TE = 4 ms, flip angle = 12°, inversion time (TI) = 300 ms].
EPI image data from each participant were preprocessed to remove noise and artifacts. This included: 1) correction for head movements within and across runs using a rigid-body rotation and translation algorithm (Friston et al. 1995b; Snyder 1996), 2) temporal realignment of all slices to account for slice intensity differences attributed to interpolated acquisition, and 3) whole brain normalization to a common mode of 1,000 to allow for comparisons across individuals (Ojemann et al. 1997).
Statistical analyses
The initial analysis examined results in individual subjects. This involved using the general linear model (GLM) to estimate the time course of blood oxygen level dependent (BOLD) responses per voxel across the entire brain for each participant (Friston et al. 1995a; Zarahn et al. 1997). The analysis used event-related methods, which estimated responses over a 28.44-s (10-frame) interval. Next, statistical parameter maps for each participant were calculated using cross-correlation magnitudes per voxel. The cross-correlation magnitude, or “dot product,” was computed as
where c represents the contrast weights of the assumed hemodynamic response function (hrf), and t represents the estimated BOLD responses at each frame. The assumed hrf was the same for each language task and involved convolving a delayed gamma function with a rectangular function specified by the experiment design (Fig. 1) (Boynton et al. 1996; Dale and Buckner 1997; Ollinger et al. 2001; Shulman et al. 1999). Before calculating the cross-correlation magnitudes, the functional data were resampled into 2-mm isotropic voxels, 1 warped into standardized atlas space (Talairach and Tournoux 1988), and smoothed with a 3-dimensional Gaussian filter [4-mm full width at half maximum (FWHM)]. The cross-correlation magnitudes per voxel represented the extent that the estimated response time courses followed an assumed hrf. The residuals from this fit were used to obtain t-statistics per voxel, which were converted to normally distributed z-scores and corrected for multiple comparisons across the entire brain volume using distributions obtained from prior Monte Carlo simulations on random noise patterns [based on methods described in Forman et al. (1995)]. The resulting z-score images for each task showed the distribution of voxels with significant cross-correlation magnitudes (threshold of P = 0.05 for a z-score value of 4.5 over at least 3 contiguous, and face-connected voxels), and hence the location of voxels where the estimated responses followed the assumed hrf. Statistical z-score parameter maps obtained from this analysis showed the distribution of BOLD responses related to the tasks in each participant.
Initial analyses of activity in each of the groups (early blind, late blind, and sighted) relied on inspection of averaged z-score statistical maps. These were created by averaging previously calculated participant z-score maps, already transformed to atlas space (2 × 2 × 2 mm voxels). Separate average z-score maps were calculated for each group and language task. Inspection of these images provided a qualitative evaluation of total regional activity elicited by each language task in each group (Fig. 3).
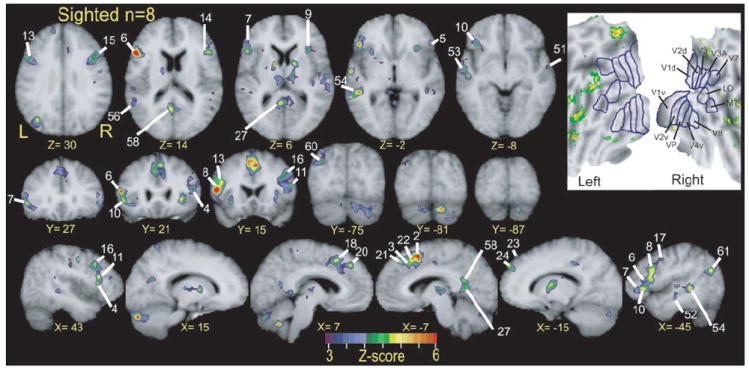
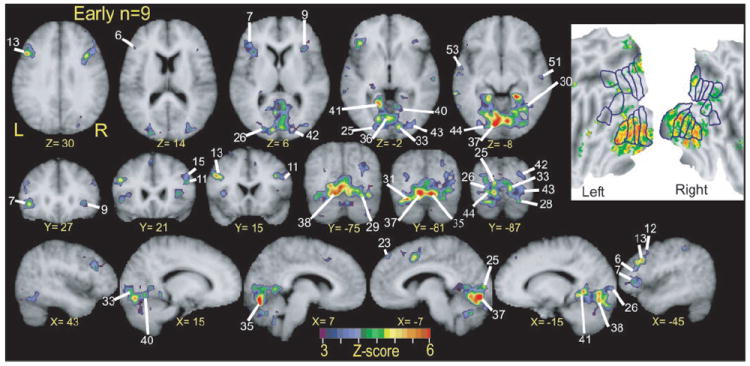
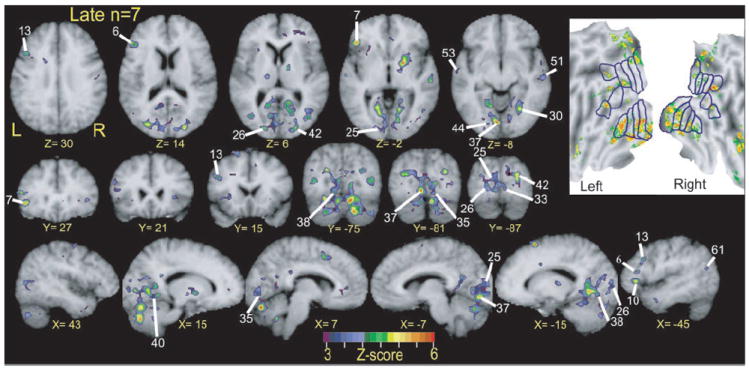
FIG. 3.
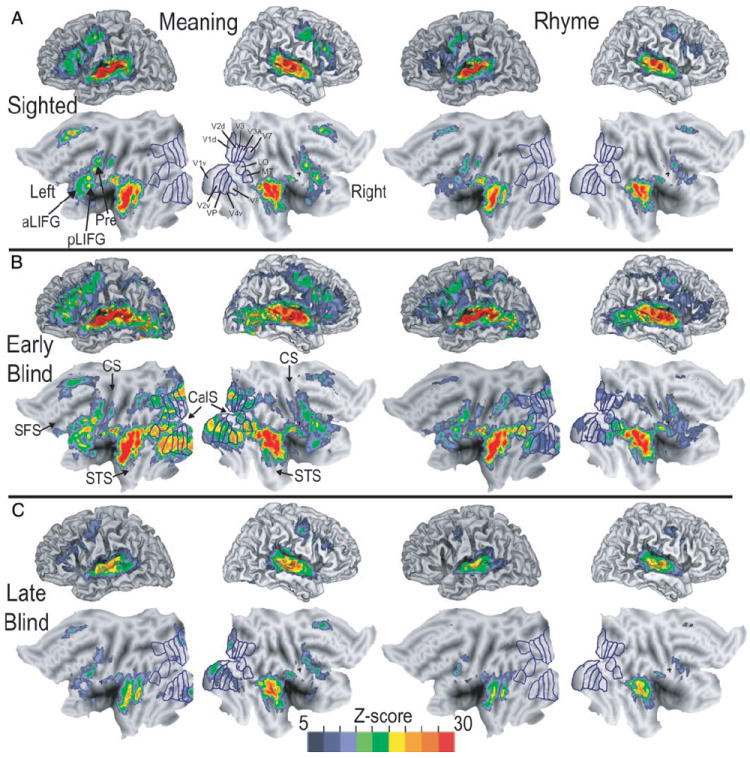
Three-dimensional and matching flattened views for left and right hemispheres of average z-score statistical parameter maps showing location of significant BOLD responses in sighted, early blind, and late blind participants. Left two columns: images show results when participants attempted to identify common meaning between groups of 16 words. Right two columns: images show results when participants noted common rhyme that linked groups of 16 words. Visuotopic borders drawn and labeled according to prior results obtained in sighted participants (Hadjikhani et al. 1998; Van Essen 2002a,b). A: average z-score maps from 8 sighted participants. B: average z-score maps from 9 early blind participants. C: average z-score maps from 7 late blind participants. aLIFG, anterior left inferior frontal gyrus; CalS, calcarine sulcus; CS, central sulcus; Pre, precentral gyrus; LO, lateral occipital area; MT, medial temporal area; pLIFG, posterior left inferior frontal gyrus; SFS, superior frontal sulcus; STS, superior temporal sulcus; V1d, V1v, dorsal and ventral primary visual areas, respectively; V2d, V2v, dorsal and ventral second visual areas, respectively; V3, V3A, third visual areas; V4v, ventral fourth visual area; VP, ventral posterior visual area; V7, seventh visual area; V8, eighth visual area.
A more objective analysis of within group differences in responses to the 2 language tasks relied on t-test of BOLD responses in defined regions. The t-tests were performed across participants in a group using cross-correlation magnitudes for each region (see following text) and each participant. Post hoc, paired t-test determined whether BOLD responses during MEANING or RHYME trials would lead to differing responses within defined regions in each group. t-Statistics were converted to z-scores and their associated probabilities. Two thresholds were used for these analyses: P ≤ 0.01 and a more lenient P ≤ 0.05.
The size of a cross-correlation magnitude reflects the resemblance of estimated BOLD responses to an assumed hrf and not the absolute magnitude of BOLD responses. Where estimated BOLD responses follow a similar time course for both language tasks, a t-test based on comparing cross-correlation magnitudes accurately assesses differences in response magnitude. However, when estimated BOLD responses from compared tasks do not follow the same time course, the BOLD response that failed to follow the assumed hrf would have a smaller cross-correlation magnitude. In this situation, a significant t-test would indicate possible differences in response shape for the compared tasks. Because of these 2 potential sources for significant t-test scores, we report differences in cross-correlation magnitude only in reference to estimated time courses (see following text) because these show whether significance indicates distinctions in response shape or magnitude.
Regions were objectively delineated using a program that detected peak z-scores in a z-score map (i.e., the points of greatest statistical significance). The z-score map used was the average of the statistical maps obtained from each group’s language task-by-time interaction term of the first ANOVA model described below. The program identified the atlas coordinates of z-score peaks (P ≤ 0.05) that were separated from other peaks by ≥ 10 mm, and then defined spherical regions (radius of 5 mm) that were centered on z-score peaks. The spherical dimensions of the regions were masked to include only voxels where z-scores were more significant than P = 0.05. The coordinates of the significant peak z-scores from the averaged ANOVA results are listed in Table 3. This table also notes approximate Brodmann areas (BA) from the Talairach atlas that enclosed the listed coordinates (Talairach and Tournoux 1988).
TABLE 3.
Paired t-test results by region and subject groups
| ID No. | Frontal Cortex
|
ID No. | Occipital Cortex
|
ID No. | Temporal Cortex
|
||||||||||||||||||
|---|---|---|---|---|---|---|---|---|---|---|---|---|---|---|---|---|---|---|---|---|---|---|---|
| Region
|
z-Score
|
Region
|
z-Score
|
Region
|
z-Score
|
||||||||||||||||||
| X | Y | Z | Gyrus/BA | Early | Late | Sighted | X | Y | Z | Gyrus/BA | Early | Late | Sighted | X | Y | Z | Gyrus/BA | Early | Late | Sighted | |||
| 1 | −01 | −02 | 39 | CG 24 | 3.0** | 0.58 | 3.20** | 25 | −09 | −88 | 10 | CUN 17 | 3.23** | 2.51** | 0.68 | 46 | 32 | −61 | −19 | FG 37 | 2.95** | 2.21* | −0.45 |
| 2 | −06 | 07 | 47 | CG 24 | 3.57** | 2.11* | 3.18** | 26 | −15 | −93 | 02 | CUN 17 | 3.16** | 2.87** | 1.62 | 47 | −24 | −42 | −19 | FG 37 | 2.59** | 2.98** | 2.53* |
| 3 | −05 | 21 | 39 | CG 32 | 1.99* | 1.32 | 3.48** | 27 | −07 | −59 | 07 | CUN 30 | 2.46* | 2.38* | 3.02** | 48 | −36 | −56 | −18 | FG 37 | 2.85** | 2.32* | 0.36 |
| 4 | 42 | 19 | 10 | IFG 45 | 2.40* | 0.21 | 3.51** | 28 | 24 | −84 | −19 | FG 18 | 2.94** | 2.24* | 0.19 | 49 | 29 | −46 | −16 | FG 37 | 2.90** | 2.88** | 1.17 |
| 5 | 48 | 27 | 00 | IFG 45,47 | 2.59** | 1.88 | 3.05** | 29 | 23 | −74 | −16 | FG 19 | 2.71** | 2.10* | −0.76 | 50 | 54 | 01 | −13 | MTG 21 | 1.15 | 2.76** | 2.83** |
| 6 | −47 | 21 | 12 | IFG 45 | 2.25* | 2.19* | 3.43** | 30 | 25 | −61 | −11 | FG 19 | 3.41** | 2.76** | −1.19 | 51 | 56 | −21 | −06 | MTG 21 | 3.11** | 2.92** | 2.58** |
| 7 | −48 | 29 | 05 | IFG 45 | 2.80** | 1.93 | 2.964** | 31 | −28 | −79 | −18 | FG 19 | 3.15** | 2.42* | −0.56 | 52 | −49 | −19 | −14 | MTG 21 | 2.36* | 2.85** | 3.40** |
| 8 | −50 | 13 | 21 | IFG 44,45 | 1.80 | 1.58 | 3.10** | 32 | 38 | −76 | 01 | IOG 19 | 1.76 | 2.89** | −1.48 | 53 | −54 | −10 | −09 | MTG 21 | 3.25** | 3.32** | 3.61** |
| 9 | 35 | 27 | 03 | IFG 47 | 3.41** | 2.54* | 2.32* | 33 | 12 | −86 | 00 | LG 17 | 2.92** | 2.03* | 1.28 | 54 | −50 | −39 | −02 | MTG 21 | 2.11* | 2.16* | 3.81** |
| 10 | −40 | 20 | −05 | IFG 47 | 1.83 | 1.89 | 3.40** | 34 | 07 | −72 | 04 | LG 18 | 2.59** | 2.33* | 0.61 | 55 | 17 | −51 | −04 | HIPPO | 2.46* | 2.99** | 0.68 |
| 11 | 47 | 19 | 21 | IFG 45 | 2.30* | 1.83 | 2.95** | 35 | 09 | −79 | −14 | LG 18 | 2.77** | 2.92** | −1.38 | 56 | −57 | −51 | 18 | STG 22 | 0.91 | 2.13* | 3.44** |
| 12 | −42 | 09 | 40 | MFG 9 | 2.92** | 0.72 | 1.61 | 36 | −01 | −80 | 02 | LG 18 | 2.70** | 2.60** | 1.71 | 57 | 59 | −16 | 07 | STG 41 | 1.44 | 1.80 | 3.07** |
| 13 | −40 | 12 | 30 | I/MFG 9,44 | 2.75** | 2.64 | 3.20** | 37 | −06 | −82 | −08 | LG 18 | 3.20** | 2.84** | 0.42 | ||||||||
| 14 | 36 | 09 | 32 | I/MFG 9,44 | 2.50* | 2.14* | 3.21** | 38 | −13 | −76 | −14 | LG 18 | 3.09** | 2.57** | −0.91 | ||||||||
| 15 | 47 | 18 | 33 | I/MFG 9,44 | 2.53* | 1.64 | 3.51** | 39 | −14 | −72 | −02 | LG 18 | 2.98** | 2.35* | 0.13 | ||||||||
| 16 | 39 | −10 | 42 | PRE 6 | 2.52* | 3.30 | 3.80** | 40 | 14 | −62 | −05 | LG 19 | 3.06** | 2.82** | −0.61 | Parietal/Cingulate Cortex
|
|||||||
| 17 | −36 | −02 | 43 | PRE 6 | 3.18** | 1.67 | 2.77** | 41 | −13 | −52 | −02 | LG 19 | 3.15** | 2.22* | 1.67 | 58 | −05 | −56 | 19 | CG 23 | 1.55 | 2.35* | 3.33** |
| 18 | 05 | 11 | 46 | SFG 6 | 2.49* | 2.41* | 3.17** | 42 | 21 | −91 | 06 | MOG 18 | 2.62** | 3.27** | 0.32 | 59 | 10 | −55 | 06 | CG 30 | 2.81** | 2.18* | 2.50* |
| 19 | −15 | 12 | 59 | SFG 6 | 1.46 | 2.90 | 0.77 | 43 | 28 | −83 | −04 | MOG 18 | 3.21** | 3.04** | 0.37 | 60 | −35 | −71 | 29 | AG 39 | 0.76 | 0.21 | 3.09** |
| 20 | 05 | 36 | 39 | SFG 8 | 1.66 | 1.22 | 3.51** | 44 | −19 | −88 | −07 | MOG 18 | 3.07** | 2.94** | 0.51 | 61 | −41 | −66 | 21 | AG 39 | 1.63 | 2.02* | 2.81** |
| 21 | −03 | 31 | 44 | SFG 8 | 2.02* | 1.02 | 2.82** | 45 | 27 | −82 | 17 | MOG 19 | 2.66** | 2.54* | −0.60 | ||||||||
| 22 | −05 | 18 | 48 | SFG 8 | 2.91** | 2.27* | 3.15** | ||||||||||||||||
| 23 | −06 | 41 | 46 | SFG 8 | 3.59** | 1.95 | 3.01** | ||||||||||||||||
| 24 | −15 | 51 | 34 | SFG 9 | 1.71 | 1.34 | 3.67** | ||||||||||||||||
Regions defined from the language condition by time interaction term. Identification number for regions cross-reference to selected sites marked in Figs. 5, 6, and 7 and the first number printed in the titles of graphs shown in Figs. 8 and 11. X, Y, and Z are the atlas coordinates (Talairach and Tournoux 1988) for the peak z-score in the identified region, for which degrees of freedom are 8, 6, and 7, respectively, for t-tests, by region, in Early, Late, and Sighted groups. CG, cingulate gyrus; CUN, cuneus gyrus; FG, fusiform gyrus; HIPPO, hippocampus; IOG, inferior occipital gyrus; LG, lingual gyrus; IFG, inferior frontal gyrus; MFG, middle frontal gyrus; MOG, middle occipital gyrus; MTG, middle temporal gyrus; PRE, precentral gyrus; SFG, superior frontal gyrus; STG, superior temporal gyrus.
P ≤ 0.05;
P ≤ 0.01.
More objective statistical assessment of group-level differences utilized a repeated-measures multifactor univariate ANOVA that included subject as a random variable (Corbetta et al. 2000; Shulman et al. 1999). The dependent variable was %change in MR signal per voxel, defined as signal magnitude divided by the mean signal intensity across all functional runs after extracting the components of linear drift and effects of interest. This mean is the average of the constant terms for the linear trend over all runs. Percentage change in MR signal was calculated using estimates from the GLM obtained in each participant. F-ratios for each factor in the ANOVA models (see following text) were converted to z-scores and corrected for multiple comparisons using a threshold deemed appropriate from prior Monte Carlo simulations on random noise patterns (similar to the method described by Forman et al. 1995). Resulting statistical maps showed the distribution of voxels where the normalized F-ratios had a threshold of P = 0.05 for a z-score of 3 over 45 contiguous and face-connected voxels. F-ratio calculations and resulting z-score statistical maps were all processed in atlas space. These maps showed the distribution of voxels where the F-ratios for a factor reflected significant variance in terms of %change in the MR signal. An important feature of the statistical maps based on the ANOVA is that they considered estimated BOLD responses irrespective of an assumed hemodynamic response function or a threshold response magnitude.
Two ANOVA models were used. One model involved a 2-level factor for language task (MEANING and RHYME) and a 10-level factor for time (10 frames per trial). The F-ratio for the main effect of time showed all voxels where BOLD responses were significantly modulated across the 28.44-s trials. Regions showing significant F-ratios in the language task-by-time interaction term are those in which the BOLD responses varied differently across time for MEANING and RHYME trials. This ANOVA model was separately applied to each group.
A second ANOVA model considered a 3-level group factor (early blind, late blind, and sighted), a 2-level factor for language task, and a 10-level factor for time. The group-by-time interaction term of this ANOVA showed regions where the BOLD responses across time differed among groups.
The final analysis constituted the examination of estimated response time courses in defined regions. For each image frame of a trial, average %MR signal change and standard errors of the mean were calculated for each group and language task. Averages were per voxel within defined regions.
RESULTS
Across all participants in each group the combined %correct recognition score was approximately 65% in the postscan recognition test (Fig. 2). This score combined the mean hit rate (correctly recognized heard words) and correct rejection rate (correctly classified novel words). Participants in all 3 groups effectively encoded the lists and did so with similar success rates.
Overview of activated cortex based on group average z-score maps
Statistical maps were created for each participant group for both language tasks. Significant voxels in these maps show sites where activity followed an assumed hemodynamic response function. The results (Fig. 3) show that all groups had significant activity in the superior half of the temporal lobe, dorsolateral frontal cortex, and portions of the anterior medial cortex. Differences within a group (Fig. 3, A, B, or C) existed predominantly in levels of activity elicited by each language task, especially where responses during the RHYME trials did not pass threshold for significance. These maps show an extensive distribution of activity surrounding the superior temporal sulcus (STS) for both language tasks. Early blind participants had additional foci in the posterior middle and inferior temporal gyri (Fig. 3B). Another domain involved activity throughout a substantial extent of lateral frontal cortex bilaterally (Fig. 3), especially in the left anterior and posterior parts of the inferior frontal gyrus (Fig. 3, aLIFG, pLIFG) and immediately adjoining parts of the precentral cortex (Fig. 3, Pre) for the MEANING task. A third domain incorporated activity surrounding the cingulate sulcus and superior frontal gyri, which is visible on the top and anterior part of the flat maps in Fig. 3.
Of critical importance to the present report, only blind participants showed activity in the occipital cortex (Fig. 3, A vs. B and C; see details in Activity in visual cortex). MEANING trials elicited more extensive activity than did RHYME trials within these regions. In early blind participants this activity extended anteriorly from the occipital pole bilaterally (see flat maps in Fig. 3B) and reached into the neighboring parietal and temporal cortex. Prominent activity extended along left ventral visual areas including the lower bank of the calcarine sulcus, and lingual, fusiform, and inferior temporal gyri. The ventral visual areas with responses in early blind participants included V1v, V2v, VP, V4v, and V8. The activated dorsal visual areas were V1d, V2d, and to a lesser degree, V3, V3a, and V7. These are all visuotopic areas previously described in sighted individuals (Hadjikhani et al. 1998; Van Essen 2002a,b). Activity in early blind participants involved parafoveal and peripheral representations as defined previously for retinotopic eccentricities in sighted participants (Tootell et al. 1998).
In late blind participants suprathreshold responses were most evident during MEANING trials (Fig. 3, B and C). The activated regions in late blind participants had lower z-scores than those in the early blind group. However, the activity involved visual areas similar to those in early blind participants (see Activity in visual cortex).
Figure 3 shows that the MEANING task elicited a broader distribution of responses than the RHYME task. However, average images created from contrasting activity during MEANING trials to RHYME trials showed significantly larger responses during the RHYME task bilaterally in the inferior parietal regions that include the supramarginal gyrus (Fig. 4, A, B1, B2, and B4) and a small posterior focus in the left inferior frontal gyrus (Fig. 4B3). Thus it was not the case that all regions exhibiting differential activity favored the MEANING task.
FIG. 4.
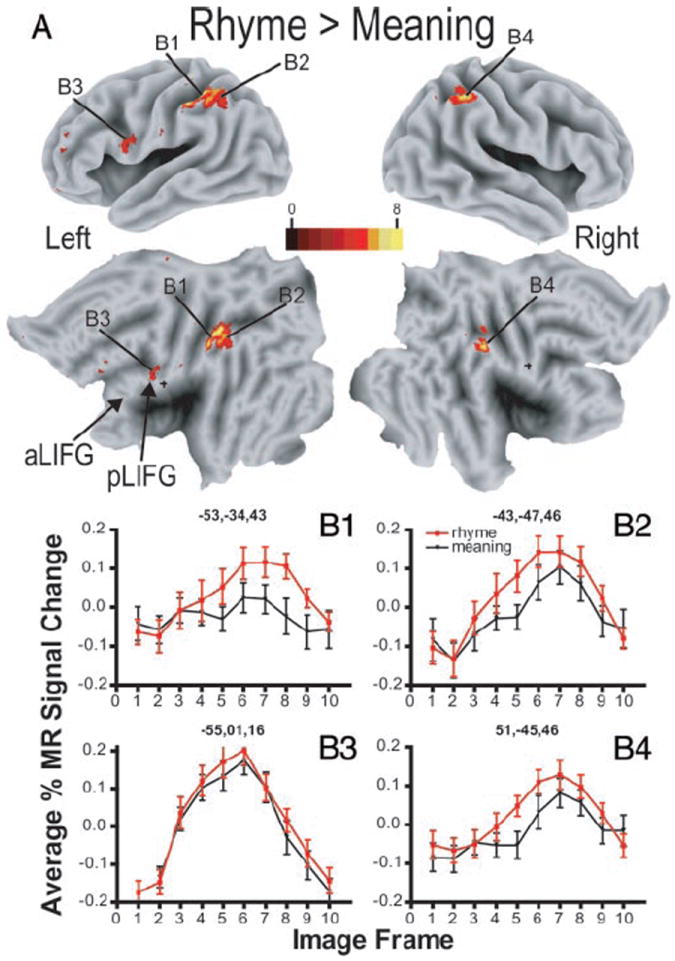
Response contrast between MEANING and RHYME trials. A: 3D and matching flattened views for left and right hemispheres of average z-score maps based on subtracting BOLD responses in all groups during MEANING trials from those during RHYME trials. B1–B4: time course of BOLD responses per voxel in selected regions by language task: MEANING and RHYME. Each data point shows mean and SE for BOLD responses from 24 participants. Average percentage change in MR signal was obtained by analyses of signal magnitudes per frame throughout a region volume (see METHODS). Frames numbered along abscissa represent sequential TR intervals of 2.844 s. Title for each graph lists X, Y, Z atlas coordinates for peak z-score for defined region.
Activity in temporal/auditory cortex
The language task-by-time interaction maps indicated that differences in regional activity attributed to the language tasks were confined to 7 relatively small regions in the superior and middle temporal gyri (Figs. 5, 6, and 7, Z = −2 to −8; Table 3, regions 50–54, 56, and 572). The limited extent of these regions in the ANOVA contrasts with the extensive temporal lobe activity shown in the average z-score maps (Fig. 3). In sighted participants the largest response area (Fig. 5, region 54) spread across the superior temporal sulcus from a main focus in the middle temporal gyrus. Blind participants showed even less extensive foci with smaller F-ratios in these same regions (Figs. 6 and 7, Z = −2 to −8; X = −45). The limited extent of significant foci obtained from this ANOVA indicates that most of the superior half of the temporal lobe responded similarly during MEANING and RHYME trials.
FIG. 5.
Selective sections, aligned to Talairach atlas (Talairach and Tournoux 1988), show regions with significant response variance between two language tasks over course of trials. These z-score statistical parameter maps reflect F-ratios per voxel for language condition by time interaction term in ANOVA analysis for BOLD responses in 8 sighted participants. Numbered labels cross-reference to regions listed in Table 3. All regions were objectively defined as noted in METHODS. Coordinate numbers for sections refer to atlas standardization. Inset: results from same analysis in flattened view of visual cortex. See text of Fig. 3 for abbreviations and source of standardized flat map.
FIG. 6.
Selective sections show regions with significant response variance between two language tasks over course of trials. These z-score statistical parameter maps reflect F-ratios per voxel for language condition by time interaction term in ANOVA analysis for BOLD responses in 9 early blind participants. Numbered labels cross-reference to regions listed in Table 3. All regions were objectively defined as noted in METHODS. Inset: results from same analysis in flattened view of visual cortex. See additional details in text of Figs. 3 and 5.
FIG. 7.
Selective sections show regions with significant response variance between two language tasks over course of trials. These z-score statistical parameter maps reflect F-ratios per voxel for language condition by time interaction term in ANOVA analysis for BOLD responses in 7 late blind participants. Numbered labels cross-reference to regions listed in Table 3. All regions were objectively defined as noted in METHODS. Inset: results from same analysis in flattened view of visual cortex. See additional details in text of Figs. 3 and 5.
All responses in the defined temporal cortex regions followed a similar time course for all groups and both tasks. Examples shown in Fig. 8, A1–A6 indicate greater %MR signal changes during frames 3 to 7 for MEANING and RHYME trials. Thus significant t-statistics3 indicated whether one language task caused larger response magnitudes than the other. Sighted participants showed larger responses during the MEANING trials in the primary auditory cortex, BA 41 (Fig. 8A1), and 6 other regions (Table 3, regions 50–54, and 56; Fig. 8, A2–A4) located in the posterior (Fig. 5, X = −45, region 54) and anterior (Fig. 5, Z = −2, region 53) thirds of the left middle temporal gyrus (BA 21). In contrast, all blind participants showed nearly identical response magnitudes during MEANING and RHYME trials over BA 41 (Table 3, region 57; Fig. 8A1) and two additional regions in early blind participants (Table 3, regions 50 and 56). Four of 7 temporal cortex regions in early blind (Table 3, regions 51 and 53, P < 0.01 and regions 52 and 54, P < 0.05) and 6 of 7 regions in late blind participants (Table 3, regions 50–53, P < 0.01 and regions 54 and 56, P < 0.05; Fig. 8, A2–A4) had significantly greater responses during MEANING trials.
FIG. 8.
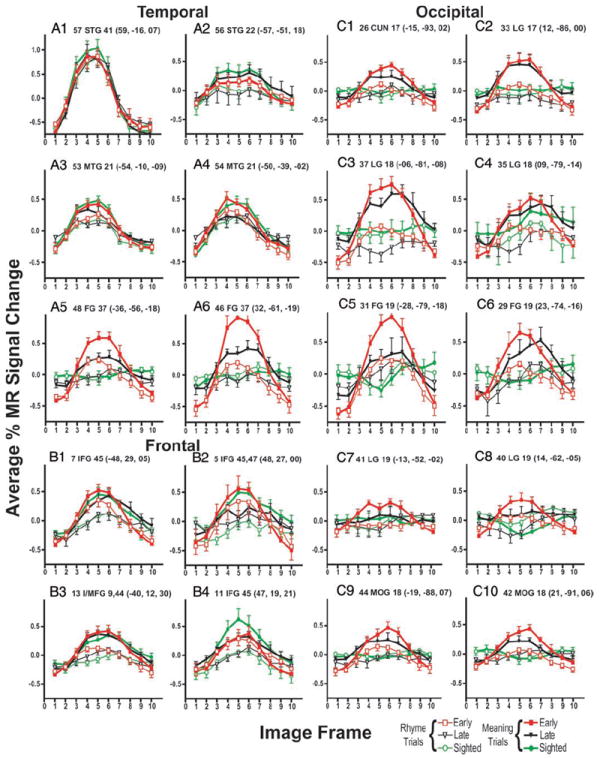
Time course of BOLD responses per voxel in selected regions for each group of participants and by language task: MEANING and RHYME trials. Each data point shows mean and SE for selected group and language condition. Average percentage change in MR signal was obtained by analyses of signal magnitudes per frame throughout a region volume (see METHODS). Frames numbered along abscissa represent sequential TR intervals of 2.844 s. Title for each graph lists, in order: region number from Table 3 and Figs. 5, 6, and 7; anatomical location (abbreviations defined in Table 3); Brodmann area number; and X, Y, Z atlas coordinates for peak z-score for defined region. A1–A6: results from regions located in temporal lobe. B1–B4: results from regions located in frontal lobe. C1–C10: results from regions located in occipital lobe. Regions located in left hemisphere shown on left in each panel.
Activity in lateral frontal cortex
The lateral frontal cortex showed an extensive distribution of sites where responses differed between the language tasks according to the ANOVA results from the language task-by-time interaction term (7 in the left and 7 in the right hemisphere; Table 3, regions 4–17). These regions occupied anterior portions of the inferior frontal gyrus, posterior portions of the inferior frontal gyrus and adjoining parts of the middle frontal gyrus, and cortex along the precentral sulcus and gyrus. Responses in most regions, and all groups, showed equivalent shape response modulations during MEANING and RHYME trials (Fig. 8, B1–B4). Thus the significant F-ratios in the ANOVA were attributed to significantly larger responses during MEANING trials, confirmed by the results of the t-test analyses (Table 3).
All groups showed foci with significant F-ratios for the task-by-time interaction term in the left aIFG (Figs. 5, 6, and 7, Z = 6, Y = 15–27, X = −45, regions 6, 7, and 10). The most anterior of these (Table 3, region 7) occupied the left frontal operculum (Figs. 5, 6, and 7, Z = 6 and −2). Two other left frontal operculum regions were located further posterior (Figs. 5, 6, and 7, X = −45, regions 6 and 10). The right aIFG contained foci with corresponding coordinates in sighted and early blind participants (Figs. 5 and 6, Z = 6, −2, Y = 27, X = 43, regions 4, 5, 9, and 11). The paired regions were numbered: 5 and 7, 11 and 6, and 4 and 10 (Table 3). All bilateral aIFG regions were within the boundaries of BA 45 and 47.
Left pIFG had foci with significantly varied responses to the language tasks in all groups (Fig. 5, 6, and 7, Z = 30, Y = 15, X = −45, regions 8 and 13). Particularly in sighted participants, similar foci with significant F-ratios for the task-by-time interaction term were found on the right in respectively matching coordinates (Fig. 5, Y = 15, 21; X = 43, regions 15 and 14). The coordinates of pIFG regions with differing responses to the language tasks were mostly within the borders of BA 44 and 45. Responses were marginally greater during RHYME trials in the left pIFG (Fig. 4B3).
Further posterior and superior in the lateral frontal cortex were sites in the precentral sulcus and gyrus cortex with significantly greater activity during MEANING trials (Fig. 3, Pre; Table 3, regions 16 and 17). All groups, but especially sighted participants, had bilaterally matching foci (Fig. 5, X = 43, region 16) whose coordinates were within the borders of BA 6.
Activity in visual cortex
Activity differed significantly between the groups mostly in the occipital (Fig. 9, Y = −53 to −91), occipital-parietal (Fig. 9, X = −15 and 15; Y = −53 to −77), and occipital-temporal cortex (Fig. 9, Z = 4, −4, −18; Y = −53 to −77; X = −41, −15, 43) as revealed by the statistical parameter map from the group-by-time interaction term of a separate ANOVA. Thus the groups had significantly different response modulations in bilateral parts of cortex surrounding primary visual cortex (V1) and higher visual areas along nearby lingual, cuneus, fusiform, inferior temporal, inferior and middle occipital, and neighboring middle temporal gyri (Fig. 9, Y = −77 to −91; Z = −4).
FIG. 9.
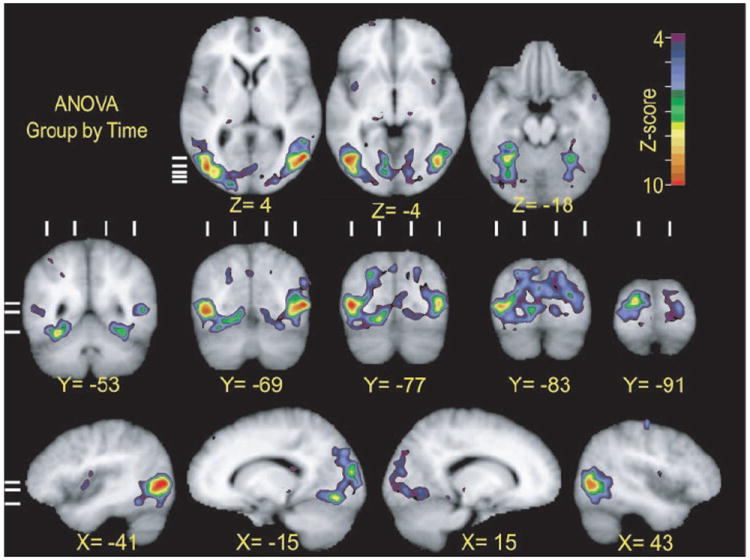
Selected sections through parts of visual cortex show regions with significant variance in BOLD responses between three participant groups over course of the trials. All sections aligned to Talairach atlas (Talairach and Tournoux 1988). These z-score statistical parameter maps reflect F-ratios per voxel for interaction term of group (9 early blind, 7 late blind, and 8 sighted participants) by time (10 frames per trial) in ANOVA analysis. Top rows: short horizontal lines on extreme left show location of corresponding coronal sections in middle row. Middle and bottom rows: three horizontal lines on extreme left show location of horizontal sections. Vertical lines above each coronal section show location of sagittal sections.
V1 responses to the language tasks varied significantly in both groups of blind participants. Regions with significant F-ratios for the task-by-time interaction term were located bilaterally in V1d and V1v (Fig. 6, Z = −2, Y = −87, X = −7 and −15, regions 25 and 26; Figs. 6 and 7, Z = −2, Y = −87, region 33; inset flat maps). Images from individual early blind participants showed significant BOLD responses in V1 for both language tasks (Fig. 10, A1–A8). Images from individual late blind participants showed a similar distribution of V1 activity for the MEANING task (Fig. 10, B1–B6), but more limited activity to the RHYME task. BOLD response magnitudes in V1 decreased slightly with age of blindness onset (Fig. 10, D1 and D2). As shown by the nearly zero slopes from linear regression analyses for both tasks (Fig. 10, D1 and D2), the declines in V1 BOLD response magnitudes with age of blindness were not significant (Fig. 10D1, MEANING trials: r = 0.14, P = 0.14; RHYME trials: r = 0.21, P = 0.07; Fig. 10 D2, MEANING trials: r = 0.04, P = 0.5; RHYME trials: r = 0.2, P = 0.09). In early blind participants, the time course of these V1 responses during both language tasks constituted a function that rose from frame 3 to a peak in frame 5 followed by a return to the baseline by frame 8 (see Fig. 8C1 for a region in the left hemisphere and Fig. 8C2 for a region in the right hemisphere). Figure 8 shows similar response shapes to both language tasks. Thus the significant t-statistics indicate greater responses during the MEANING trials in V1 regions for early blind participants (Table 3, regions 25, 26, and 33, P ≤ 0.01).
FIG. 10.
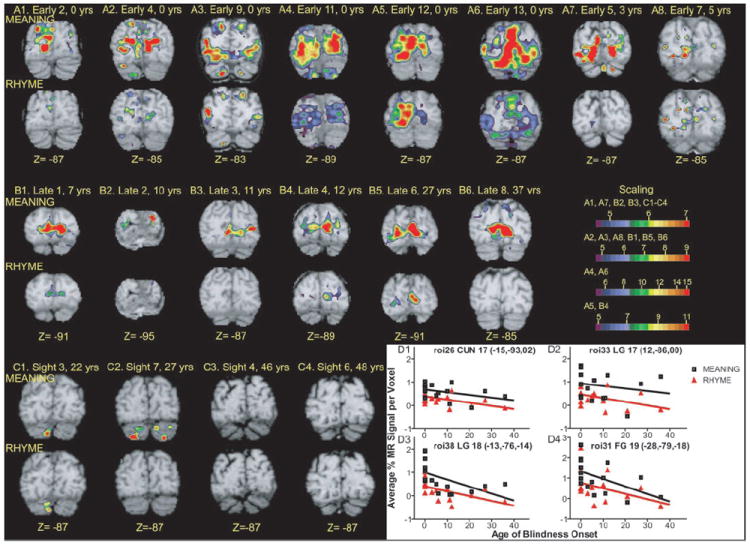
Analyses of BOLD responses in individual participants. A1–A8: average z-score maps based on BOLD responses obtained from Early blind participants during MEANING task (toprow) and RHYME task (bottomrow). Coronal sections were selected to show responses in V1. See Table 1 for additional biometric information about named participants. B1–B6: average z-score maps based on BOLD responses obtained from Late blind participants. See text above for additional information on A1–A8. C1–C4: average z-score maps based on BOLD responses obtained from Sighted participants. D1–D4: magnitude of BOLD responses as function of age of blindness onset in defined regions. Title for each graph lists, in order: region number from Table 3 and Figs. 5, 6, and 7; anatomical location (abbreviations defined in Table 3); Brodmann area number; and X, Y, Z atlas coordinates for peak z-score for defined region.
In late blind participants, V1 responses resembled the modulation noted in early blind participants only for MEANING trials (Fig. 8, C1 and C2). Thus significant t-statistics for V1 responses in late blind participants might reflect greater responses during MEANING trials or differences in the shape of the time-course functions for the two language tasks.
Eighteen of 21 additional visual cortex regions were identified in early and late blind participants that had significantly different responses to the language tasks. The majority of these regions occupied ventral sites in lingual, fusiform, and occipital gyri, and thereby occupied visuotopic areas V2v, VP, V4v, and V8 (see inset flat maps in Figs. 5, 6, and 7). Regions numbered 28–31, 35–38, and 40–44 in Table 3 are tagged in Fig. 6 for early blind participants. The approximate locations of regions numbered 30, 35, 37, 38, 40, 42, and 44 in Table 3 are tagged in Fig. 7 for late blind participants. The left/right hemisphere atlas coordinates of 5 paired regions matched closely (Table 3, regions 36/34, 38/35, 41/40, 31/30, and 44/43), indicating relatively symmetrical bilateral sites with similarly varying responses to the language tasks.
In early blind participants, response time courses in higher visual areas during MEANING and RHYME trials had similar shapes and predominantly resembled those noted in V1 (Fig. 8, C3–C10). Thus greater responses during MEANING trials accounted for instances of significant t-statistics in 6 of 21 regions defined on the left (Table 3, regions 31, 36–39, and 44) and 8 of 21 on the right (Table 3, regions 28–30, 34, 35, 40, 42, and 43) based on a strict criterion of P ≤ 0.01.
In late blind participants, the response time-course shapes in several higher visual regions differed from those in V1 (Fig. 8). In V1 the response time course was flat during the RHYME trials (Fig. 8, C1 and C2). In contrast, the RHYME trial time courses in several higher visual areas had a negative fluctuation in frames 2–5 and a delayed increase that peaked in frames 6–7 (Fig. 8, C3–C8). During the MEANING trials the time-course shapes in V1 and some higher visual areas were similar for early and late blind participants (Fig. 8, C1, C2, C9, and C10). In several other higher visual areas, late blind individuals had delayed responses during the MEANING trials; the activity started later and the peak for the %MR signal change often occurred in frame 7 (Fig. 8, C3–C6, regions 29, 31, 35, and 45). In all higher-tier visual regions identified in late blind participants, greater responses during MEANING trials accounted for significant differences using a lenient threshold of P ≤ 0.05 (Table 3, regions 28, 29, 31, 34, 35, 43, and 45). Even where the response shapes differed, the magnitudes of the responses during MEANING trials were always greater. Significant t-statistics for these regions (Table 3, regions 30, 32, 36–42, and 44) might have reflected differences in response shape and/or magnitude between the tasks. Response magnitudes in many higher-tier visual areas declined significantly with age of blindness onset, as shown by the negative sloped linear regression curves in Fig. 10, D3 and D4 (Fig. 10D3, MEANING trials: r = 0.3, P = 0.04; RHYME trials: r = 0.3, P = 0.03; Fig. 10D4, MEANING trials: r = 0.3, P = 0.04). There was no response to the RHYME trials in roi31 in most blind participants (Fig. 10D4, RHYME trials: r = 0.17, P = 0.12).
Four regions within the temporal lobe extension of the fusiform gyrus (BA 37, V8) showed variable responses to the language tasks, especially in early blind participants (Table 3, regions 46– 49). MEANING trials led to response modulations with a time course similar to that seen in most other visual cortical regions (Fig. 8, A5 and A6). There were no response modulations during RHYME trials in 2 anterior fusiform regions in early blind and all 4 regions in late blind participants (Fig. 8A5). The significant differences between language tasks listed in Table 3 for the 2 regions with similar shaped time courses in early blind participants were likely attributable to greater response magnitudes during MEANING trials. The remaining differences could have reflected differences in the time-course shapes or response magnitudes.
Sighted participants showed no activity that passed the thresholds set for the GLM analyses in any visual cortex regions (Fig. 3C). The more sensitive, threshold- and response shape– independent ANOVA results for the time factor also showed no evidence of significant F-ratios anywhere in the visual cortex for this group. The absence of significant F-ratios from the task-by-time interaction term of the ANOVA (Fig. 5) or differences in response magnitude within any visual cortex regions (Table 3) further indicate that the language tasks had no discernable influence on visual cortex in sighted participants (Fig. 8, A5, A6, and C1–C6).
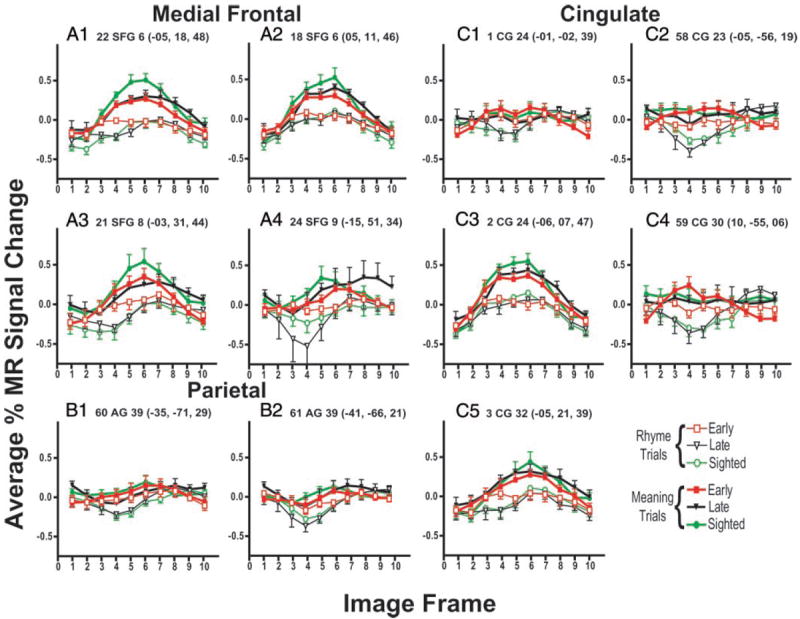
Negative BOLD responses in medial frontal, cingulated, and parietal cortex
Superior frontal, cingulate, and cuneus gyri contained numerous regions where responses varied significantly between language tasks. These regions were most prominent in sighted participants (Fig. 5, X = 7, −7, and −15, regions 2, 3, 18, 20–24, 27, and 58; Table 3, regions 1–3, 18–24, 27, 58, and 59). In 3 superior frontal and 2 anterior cingulate sulcal regions, where response time courses were similar during both tasks, MEANING trials evoked significantly larger responses (Fig. 11, A1–A3, regions 19, 21, and 22 and Fig. 11, C3 and C5, regions 2 and 3). The time courses of activity in 3 cingulate, 3 superior frontal, and 3 lateral parietal regions had response time courses with decreases in %MR signal change below the baseline during RHYME trials, especially in late blind and sighted participants (Fig. 11, A4, B1, B2, C1, C2, and C4). Peak increases in MR signal changes during MEANING trials were often delayed beyond frame 5, or the decreased magnitudes were less than that during RHYME trials (Fig. 11, B1 and B2). The response time course during MEANING trials persisted at baseline levels in 3 of these regions (Fig. 11, C1, C2, and C4). Given the divergence of these time courses from assumed hemodynamic response functions, any observed significant t-statistics for these regions (Table 3, regions 1, 20, 23, 24, 27, and 58–61) might have reflected differences in the time-course shapes despite always finding larger responses during MEANING trials (Fig. 11).
FIG. 11.
Time course of BOLD responses per voxel in selected regions for each group of participants and by language task: MEANING and RHYME trials. Each data point shows mean and SE for selected group and language condition. Average percentage change in MR signal was obtained by analyses of signal magnitudes per frame throughout a region volume (see METHODS). Frames numbered along abscissa represent sequential TR intervals of 2.844 s. Title for each graph lists, in order: region number from Table 3 and Figs. 5, 6,and 7; anatomical location (abbreviations defined in Table 3), Brodmann area number; and X, Y, Z atlas coordinates for peak z-score for defined region. A1–A4: results from regions located in medial frontal cortex. B1–B2: results from regions located in parietal lobe. C1–C5: results from regions located in parts of cingulate cortex.
DISCUSSION
These results demonstrated significantly greater response magnitudes for the MEANING task than for the RHYME task throughout many visual cortex regions in both groups of blind people. Sighted participants showed no activity that passed the thresholds set for the GLM analyses in the visual cortex. Despite the relatively small sample size of early and late blind participants, the statistical power of the t-test analyses was >66%. The activated visual cortex regions were similar to those previously identified using a predominantly semantic, verb-generation task (Burton et al. 2002a,b). The activated regions included V1 in both groups of blind participants and suprathreshold responses in several higher-tier visual regions. Response magnitudes in V1 remained relatively constant irrespective of age of blindness onset, which indicates a persistent potential for cross-modal reorganization in the primary visual cortex. However, response magnitudes in higher-tier visual areas declined with age of blindness onset, which suggests some limitations on cross-modal reorganization.
One question here is whether such activation in the visual cortex of blind people reflects mechanisms associated with lexical processes (Burton 2003). In the current study, the MEANING and RHYME tasks activated known language areas vetted by prior research that used a variety of language-task protocols. This suggests that the tasks used here were capable of revealing language areas comparable to those studied previously.
Visual cortex activity in blind people
The predominant effect of the MEANING task noted in the present study is consistent with striking visual cortex activity observed in previous studies using verb generation to nouns read through Braille (Burton et al. 2002a) or heard (Burton et al. 2002b). Verb generation draws on semantic processes (Gabrieli et al. 1998; Seger et al. 1999), although phonological processing is also used in covert and overt generation of words. Collectively these studies suggest that blind people use visual cortex in some aspect of lexical processing. The present results help clarify the situation by suggesting that these regions are more active when the language task involves semantic processing than when it involves phonological processing. This preferential activation supports the hypothesis that visual cortex in blind people is used in linguistic processing. Because parts of the visual cortex also responded during the RHYME task in both groups of blind people and was previously shown to be activated during tactile discrimination tasks (Sadato et al. 2002), further experiments are needed to determine the aspects of semantic processing per se (e.g., storing semantic knowledge that might be accessed by the frontal cortex) served by this visual cortex activity.
Prior contradictory reports regarding activity in V1 in early blind people during Braille word reading (Melzer et al. 2001; Sadato et al. 1996, 1998) might simply reflect differences in the extent to which the earlier tasks engaged in semantic processing. The level of semantic processing was not controlled in these earlier studies because blind people were merely instructed to read the Braille fields. Sadato and colleagues (Sadato et al. 1996, 1998, 2002) also reported activation of V1 in early blind participants doing nonword, tactile shape discriminations. However, for these tasks there also were no controls over whether participants attempted to name the touched objects, which would have required some semantic processing. Studies without similar results might thus have resulted from using tasks with limited semantic processing (Büchel et al. 1998a,b; Melzer et al. 2001).
Previously we hypothesized that the visual cortex in blind people might play a role in language as a result of the process of becoming Braille literate (Burton et al. 2002b). A possible basis for this claim is that in learning Braille blind people must have prolonged practice in associating the feel of Braille fields and phonics (Millar 1997; Nolan and Kederis 1969; Pring 1985, 1994). Through multimodal regions with connections to somatosensory, auditory, and visual cortical areas (Andersen et al. 1990; Falchier et al. 2002; Felleman and Van Essen 1991; Lewis and Van Essen 2000), tactile and auditory information associated with Braille and speech can reach visual cortex. A proposed mechanism for activation of the visual cortex is that visual deprivation may lead to a reverse flow of information from multimodal regions to visual areas (Sadato et al. 2002). Thus processes and connections normally serving modality integration might provide a conduit linking language information from touch or speech directly into visual cortex. A variety of connections also link visual cortex to the frontal and temporal language areas of the brain (Falchier et al. 2002; Felleman and Van Essen 1991; Lewis and Van Essen 2000). Thus it is possible that activation of the visual cortex by print instantiates a neural representation that contributes to language processes elsewhere in the brain. We have suggested that in blind people these functions transfer to tactile and auditory stimuli (Burton et al. 2002b). This transfer to auditory stimuli might be responsible for the observed visual cortex activity to MEANING and RHYME tasks because both involved listening to words.
A possible explanation for finding significantly greater responses to the MEANING task in most activated visual cortex regions in both groups of blind participants is that it reflects distinctions between lexical mechanisms associated with semantic and phonological processes. This explanation, however, applies only if the language tasks used in this study dissociated these two lexical processes. The current tasks revealed distinctions between semantic and phonological processing in the visual cortex comparable to dissociations found in traditional language areas (Bookheimer 2002; Fiez et al. 1995; Fiez and Petersen 1998; Fujimaki et al. 1999; Gabrieli et al. 1998; McDermott et al. 2003; Perani et al. 1999; Petersen and Fiez 1993; Price 2000; Roskies et al. 2001). An alternative explanation for the observed differences in responses to the MEANING and RHYME tasks is that each required different levels of effort because the tasks differed in difficulty. The following section considers both of these mechanisms.
Dissociable activity in cortical language areas
Sighted and blind people were grossly similar in their overall organization of activated language areas. Thus the frontal, parietal, and temporal regions activated by the current language tasks correspond to language regions described in many previous studies that used a variety of lexical tasks and mostly print presentation of words to sighted individuals (Bookheimer 2002; Fiez et al. 1995; Fiez and Petersen 1998; Fujimaki et al. 1999; Gabrieli et al. 1998; McDermott et al. 2003; Perani et al. 1999; Petersen and Fiez 1993; Price 2000; Roskies et al. 2001). Prior studies suggest that semantic and phonological processing of words occurs in dissociable frontal cortex regions with semantic tasks eliciting stronger activation than phonological processes in the anterior left inferior frontal gyrus (aLIFG; encompassing BA 45/47), whereas phonological tasks with words activate foci in the posterior left inferior frontal gyrus (pLIFG; including BA 44/45), adjoining the middle frontal gyrus, and nearby inferior parts of the precentral gyrus (BA 6) (Bokde et al. 2001; Bookheimer 2002; Fiez et al. 1997, 1998; Gabrieli et al. 1998; McDermott et al. 2003; Poldrack et al. 1999; Roskies et al. 2001; Wagner et al. 2001). The current findings are consistent with these findings of differential activity for semantic and phonological tasks in the left lateral frontal and parietal cortex. As noted previously, observed differences are relative and both tasks engaged many of the same regions but to differing degrees. The replication of these earlier findings in traditional cortical language areas suggests that the current tasks similarly activated different lexical processes despite the possibility the MEANING and RHYME tasks differed in difficulty.
Differences in task difficulty have been considered and dismissed as explanations for observed dissociations between semantic and phonological regions in the frontal cortex (Gabrieli et al. 1998; Poldrack et al. 1999). Furthermore, finding that the RHYME task leads to significantly larger responses in bilateral parts of the inferior parietal lobule and marginally larger responses in the posterior parts of the left inferior frontal gyrus is consistent with an interpretation that the MEANING and RHYME tasks engaged different lexical processes. The present parietal activation foci were included in the areas previously reported to be engaged in phonological processes (e.g., Fujimaki et al. 1999; McDermott et al. 2003; Roskies et al. 2001). This portion of the parietal cortex also does not appear to be active in studies of attention (Corbetta 1998; Corbetta et al. 2000), which argues against differences in effort between the MEANING and RHYME tasks as a basis for larger responses to the RHYME task in this region. These findings therefore emphasize that the 2 tasks engaged different lexical processes rather than just differences in degree of effort.
Auditory areas in the temporal lobe
The processing of spoken words was likely responsible for extensive, bilateral activation across temporal lobe auditory/speech regions for each task (Binder et al. 2000). This auditory cortex activity was greater in magnitude than that in any other cortical region. Auditory processing for word meaning likely required attention to multiple phonemes in each word, whereas processing for word rhyme likely required attention to a single phoneme in each word. Despite this difference, there were only a few small, isolated temporal lobe regions that exhibited greater activation for the MEANING task relative to the RHYME task (Fig. 7; Table 3). Of particular interest was a site in the posterior and superior parts of the left middle temporal gyrus (Table 3, region 54). This region was more robustly engaged during the semantic task than the phonological task in sighted participants. The location of this region in posterior temporal cortex and near the border between the superior and middle temporal gyri matches previous identifications of temporal lobe sites associated with semantic processing of isolated words (Fiez et al. 1997, 1998; McDermott et al. 2003; Price 2000; Raichle et al. 1994; Roskies et al. 2001; Vandenberghe et al. 1996).
Blind people showed even fewer differences in temporal lobe activity for the 2 language tasks. This suggests that blind participants might have attended similarly to spoken words irrespective of language task, which is consistent with previous reports that suggest blind people listen more attentively to auditory stimuli (Leclerc et al. 2000; Liotti et al. 1998). The paucity of major differences in temporal lobe activity, even in sighted individuals, further suggests comparable attention to the acoustic features of the words in both tasks. An important implication of these null effects in the auditory cortex, where overall responses were greatest, is that a mechanism based on possible differences in effort in processing the acoustic features of the words in the 2 tasks insufficiently explains differential responses to the MEANING and RHYME tasks in other cortical regions.
Activity in medial cortex
The MEANING task elicited greater activity than the RHYME task in some medial cortical areas (supplementary motor area and cingulate sulcus) that have been associated with demanding tasks (Corbetta et al. 1991). These same regions are also active during a variety of motor tasks (Fink et al. 1997; Gordon et al. 1998; Kwan et al. 2000; Thickbroom et al. 2000) that include language generation (Crosson et al. 1999; Petersen et al. 1990; Picard and Strick 1996). The activated region likely involved portions of Brodmann areas 8 and 32, presupplementary motor area (pre-SMA) (area 6), and SMA (Crosson et al. 1999; Picard and Strick 1996). It is possible that participants covertly vocalized heard words when trying to remember common meanings or rhymes. More activation during the MEANING task suggests that the extent of this rehearsal might have been greater during these trials. Because imagining motor actions also elicit responses from motor areas (Porro et al. 1996; Richter et al. 2000), any vocalization imagery or motor planning for inner speech might have contributed to the medial motor cortex responses.
Other medial parietal and frontal-cingulate regions had decreased responses (Fig. 11). Negative BOLD responses in spatially similar regions were described previously as reflecting a shift away from a default mode of high brain activity, which has been hypothesized as being associated with monitoring the environment for emotionally relevant events (Gusnard et al. 2001; Raichle et al. 2001). When performing any attention-demanding task, brain resources transfer from the default mode to those necessitated by the task, which results in decreased blood flow in those regions involved with endogenous monitoring functions (Shulman et al. 1997). Thus these negative BOLD responses reflect a decrease in monitoring when an individual engages in a specific task. Decreases in %MR signal were present during the RHYME task in all groups, but rarely apparent during MEANING trials. If the latter task demanded more attention, one would have predicted greater negative responses. In most instances the MEANING task led to little or no change from baseline activity in all groups. This paradoxical finding will require further investigation.
In summary, the presented data demonstrate pronounced differences in the recruitment of traditional visual cortex for language tasks across 3 participant groups: sighted participants, people without vision from birth or by age 5 yr, and people who became blind later in life. Specifically, attending to the relations among rapidly presented, semantically associated spoken words evoked robust activity throughout visual cortical regions for early-blind people; attending to the relations among rhyming words did so to a lesser extent. These results confirm prior reports of cross-modal plasticity in the visual cortex subsequent to blindness. In primary visual cortex there was little decline in the magnitude of responses as a function of the age of blindness onset. People who became blind later in life demonstrated less-extensive responses in higher-tier visual regions and mostly for the MEANING task. Response magnitudes in these regions also declined with age of blindness onset. Sighted participants did not recruit the visual cortex when attending to relations among semantic or phonologically related words. An explanatory hypothesis for these results is that visual cortical reorganization in blind people relates to language processing.
Acknowledgments
We are indebted to P. Schonlau for recruiting blind people for this study, V. Raja for processing image data, Dr. E. Akbudak for scanner pulse sequences, Dr. A. Snyder for image reconstruction and region identification routines, Dr. M. McAvoy for statistical analysis of scanner images, Dr. J. Watson for assistance in assembling the word lists, Dr. R. Sinclair for assistance with statistics and editing, and M. Kuns for reading the word lists.
DISCLOSURES
This work was supported by National Institute of Neurological Disorders and Stroke Grant NS-37237.
Footnotes
The 2-mm isotropic resampling is done to put the brain images into the atlas of Talarich and Tournoux (1988). The use of a common atlas makes it possible to distinguish activated regions and facilitates within- and between-group statistical analyses.
The tagged sites in Figs. 5, 6, and 7 do not necessarily mark the peak positions because only a limited sample of sections is shown.
A power analysis indicated a power of ≥66% for t-tests with P=.05.
References
- Andersen RA, Asanuma C, Essick G, Siegel RM. Corticocortical connections of anatomically and physiologically defined subdivisions within the inferior parietal lobule. J Comp Neurol. 1990;296:65–113. doi: 10.1002/cne.902960106. [DOI] [PubMed] [Google Scholar]
- Binder JR, Frost JA, Hammeke TA, Bellgowan PS, Springer JA, Kaufman JN, Possing ET. Human temporal lobe activation by speech and nonspeech sounds. Cereb Cortex. 2000;10:512–528. doi: 10.1093/cercor/10.5.512. [DOI] [PubMed] [Google Scholar]
- Binder JR, Frost JA, Hammeke TA, Cox RW, Rao SM, Prieto T. Human brain language areas identified by functional magnetic resonance imaging. J Neurosci. 1997;17:353–362. doi: 10.1523/JNEUROSCI.17-01-00353.1997. [DOI] [PMC free article] [PubMed] [Google Scholar]
- Bokde AL, Tagamets MA, Friedman RB, Horwitz B. Functional interactions of the inferior frontal cortex during the processing of words and word-like stimuli. Neuron. 2001;30:609–617. doi: 10.1016/s0896-6273(01)00288-4. [DOI] [PubMed] [Google Scholar]
- Bookheimer S. Functional MRI of language: new approaches to understanding the cortical organization of semantic processing. Annu Rev Neurosci. 2002;25:151–188. doi: 10.1146/annurev.neuro.25.112701.142946. [DOI] [PubMed] [Google Scholar]
- Boynton GM, Engel SA, Glover GH, Heeger DJ. Linear systems analysis of functional magnetic resonance imaging in human V1. J Neurosci. 1996;16:4207–4221. doi: 10.1523/JNEUROSCI.16-13-04207.1996. [DOI] [PMC free article] [PubMed] [Google Scholar]
- Büchel C, Price C, Frackowiak RS, Friston K. Different activation patterns in the visual cortex of late and congenitally blind subjects. Brain. 1998a;121:409–419. doi: 10.1093/brain/121.3.409. [DOI] [PubMed] [Google Scholar]
- Büchel C, Price C, Friston K. A multimodal language region in the ventral visual pathway. Nature. 1998b;394:274–277. doi: 10.1038/28389. [DOI] [PubMed] [Google Scholar]
- Burton H. Visual cortex activity in early and late blind people. J Neurosci. 2003;23:4005–4011. doi: 10.1523/JNEUROSCI.23-10-04005.2003. [DOI] [PMC free article] [PubMed] [Google Scholar]
- Burton H, Snyder AZ, Conturo TE, Akbudak E, Ollinger JM, Raichle ME. Adaptive changes in early and late blind: a fMRI study of Braille reading. J Neurophysiol. 2002a;87:589–611. doi: 10.1152/jn.00285.2001. [DOI] [PMC free article] [PubMed] [Google Scholar]
- Burton H, Snyder AZ, Diamond J, Raichle ME. Adaptive changes in early and late blind: a fMRI study of verb generation to heard nouns. J Neurophysiol. 2002b;88:3359–3371. doi: 10.1152/jn.00129.2002. [DOI] [PMC free article] [PubMed] [Google Scholar]
- Cohen LG, Celnik P, Pascual-Leone A, Corwell B, Faiz L, Dambrosia J, Honda M, Sadato N, Gerloff C, Catala MD, Hallett M. Functional relevance of cross-modal plasticity in blind humans. Nature. 1997;389:180–183. doi: 10.1038/38278. [DOI] [PubMed] [Google Scholar]
- Cohen LG, Weeks RA, Sadato N, Celnik P, Ishii K, Hallett M. Period of susceptibility for cross-modal plasticity in the blind. Ann Neurol. 1999;45:451–460. doi: 10.1002/1531-8249(199904)45:4<451::aid-ana6>3.0.co;2-b. [DOI] [PubMed] [Google Scholar]
- Conturo TE, McKinstry RM, Akbudak E, Snyder AZ, Yang T, Raichle ME. Sensitivity optimization and experimental design in fMRI. Soc Neurosci Abstr. 1996;22:7. [Google Scholar]
- Corbetta M. Frontoparietal cortical networks for directing attention and the eye to visual locations: identical, independent, or overlapping neural systems? Proc Natl Acad Sci USA. 1998;95:831–838. doi: 10.1073/pnas.95.3.831. [DOI] [PMC free article] [PubMed] [Google Scholar]
- Corbetta M, Kincade JM, Ollinger JM, McAvoy MP, Shulman GL. Voluntary orienting is dissociated from target detection in human posterior parietal cortex. Nat Neurosci. 2000;3:292–297. doi: 10.1038/73009. [DOI] [PubMed] [Google Scholar]
- Corbetta M, Miezin FM, Dobmeyer S, Shulman GL, Petersen SE. Selective and divided attention during visual discriminations of shape, color, and speed: functional anatomy by positron emission tomography. J Neurosci. 1991;11:2383–2402. doi: 10.1523/JNEUROSCI.11-08-02383.1991. [DOI] [PMC free article] [PubMed] [Google Scholar]
- Crosson B, Sadek JR, Bobholz JA, Gokcay D, Mohr CM, Leonard CM, Maron L, Auerbach EJ, Browd SR, Freeman AJ, Briggs RW. Activity in the paracingulate and cingulate sulci during word generation: an fMRI study of functional anatomy. Cereb Cortex. 1999;9:307–316. doi: 10.1093/cercor/9.4.307. [DOI] [PubMed] [Google Scholar]
- Dale AM, Buckner RL. Selective averaging of rapidly presented individual trials using fMRI. Hum Brain Mapp. 1997;5:329–340. doi: 10.1002/(SICI)1097-0193(1997)5:5<329::AID-HBM1>3.0.CO;2-5. [DOI] [PubMed] [Google Scholar]
- Demb JB, Desmond JE, Wagner AD, Vaidya CJ, Glover GH, Gabrieli JD. Semantic encoding and retrieval in the left inferior prefrontal cortex: a functional MRI study of task difficulty and process specificity. J Neurosci. 1995;15:5870–5878. doi: 10.1523/JNEUROSCI.15-09-05870.1995. [DOI] [PMC free article] [PubMed] [Google Scholar]
- Falchier A, Clavagnier S, Barone P, Kennedy H. Anatomical evidence of multimodal integration in primate striate cortex. J Neurosci. 2002;22:5749–5759. doi: 10.1523/JNEUROSCI.22-13-05749.2002. [DOI] [PMC free article] [PubMed] [Google Scholar]
- Felleman DJ, Van Essen DC. Distributed hierarchical processing in the primate cerebral cortex. Cereb Cortex. 1991;1:1–47. doi: 10.1093/cercor/1.1.1-a. [DOI] [PubMed] [Google Scholar]
- Fiez JA. Phonology, semantics, and the role of the left inferior prefrontal cortex. Hum Brain Mapp. 1997;5:79–83. [PubMed] [Google Scholar]
- Fiez JA, Balota DA, Raichle ME, Petersen SE. Effects of lexicality, frequency, and spelling-to-sound consistency on the functional anatomy of reading. Neuron. 1999;24:205–218. doi: 10.1016/s0896-6273(00)80833-8. [DOI] [PubMed] [Google Scholar]
- Fiez JA, Petersen SE. Neuroimaging studies of word reading. Proc Natl Acad Sci USA. 1998;95:914–921. doi: 10.1073/pnas.95.3.914. [DOI] [PMC free article] [PubMed] [Google Scholar]
- Fiez JA, Tallal P, Raichle ME, Miezin FM, Katz WF, Dobmeyer S, Petersen SE. PET studies of auditory and phonological processing: effects of stimulus type and task conditions. J Cogn Neurosci. 1995;7:357–375. doi: 10.1162/jocn.1995.7.3.357. [DOI] [PubMed] [Google Scholar]
- Fink GR, Frackowiak RS, Pietrzyk U, Passingham RE. Multiple nonprimary motor areas in the human cortex. J Neurophysiol. 1997;77:2164–2174. doi: 10.1152/jn.1997.77.4.2164. [DOI] [PubMed] [Google Scholar]
- Forman SD, Cohen JD, Fitzgerald M, Eddy WF, Mintun MA, Noll DC. Improved assessment of significant activation in functional magnetic resonance imaging (fMRI): use of a cluster-size threshold. Magn Reson Med. 1995;33:636–647. doi: 10.1002/mrm.1910330508. [DOI] [PubMed] [Google Scholar]
- Friston K, Holmes A, Poline J, Grasby P, Williams S, Frackowiak R, Turner R. Analysis of functional MRI time-series revisited. NeuroImage. 1995b;2:45–53. doi: 10.1006/nimg.1995.1007. [DOI] [PubMed] [Google Scholar]
- Friston K, Holmes A, Worsley K, Poline J, Frith C, Frackowiak R. Statistical parametric maps in functional imaging: a general linear approach. Hum Brain Mapp. 1995a;2:189–210. [Google Scholar]
- Fujimaki N, Miyauchi S, Putz B, Sasaki Y, Takino R, Sakai K, Tamada T. Functional magnetic resonance imaging of neural activity related to orthographic, phonological, and lexico-semantic judgments of visually presented characters and words. Hum Brain Mapp. 1999;8:44–59. doi: 10.1002/(SICI)1097-0193(1999)8:1<44::AID-HBM4>3.0.CO;2-#. [DOI] [PMC free article] [PubMed] [Google Scholar]
- Gabrieli JD, Poldrack RA, Desmond JE. The role of left prefrontal cortex in language and memory. Proc Natl Acad Sci USA. 1998;95:906–913. doi: 10.1073/pnas.95.3.906. [DOI] [PMC free article] [PubMed] [Google Scholar]
- Gold BT, Buckner RL. Common prefrontal regions coactivate with dissociable posterior regions during controlled semantic and phonological tasks. Neuron. 2002;35:803–812. doi: 10.1016/s0896-6273(02)00800-0. [DOI] [PubMed] [Google Scholar]
- Gordon AM, Lee JH, Flament D, Ugurbil K, Ebner TJ. Functional magnetic resonance imaging of motor, sensory, and posterior parietal cortical areas during performance of sequential typing movements. Exp Brain Res. 1998;121:153–166. doi: 10.1007/s002210050447. [DOI] [PubMed] [Google Scholar]
- Gusnard DA, Akbudak E, Shulman GL, Raichle ME. Medial prefrontal cortex and self-referential mental activity: relation to a default mode of brain function. Proc Natl Acad Sci USA. 2001;98:4259–4264. doi: 10.1073/pnas.071043098. [DOI] [PMC free article] [PubMed] [Google Scholar]
- Hadjikhani N, Liu AK, Dale AM, Cavanagh P, Tootell RB. Retinotopy and color sensitivity in human visual cortical area V8. Nat Neurosci. 1998;1:235–241. doi: 10.1038/681. [DOI] [PubMed] [Google Scholar]
- Hamilton R, Keenan JP, Catala M, Pascual-Leone A. Alexia for Braille following bilateral occipital stroke in an early blind woman. Neuroreport. 2000;11:237–240. doi: 10.1097/00001756-200002070-00003. [DOI] [PubMed] [Google Scholar]
- Jonides J, Schumacher EH, Smith EE, Koeppe RA, Awh E, Reuter-Lorenz PA, Marshuetz C, Willis CR. The role of parietal cortex in verbal working memory. J Neurosci. 1998;18:5026–5034. doi: 10.1523/JNEUROSCI.18-13-05026.1998. [DOI] [PMC free article] [PubMed] [Google Scholar]
- Klein D, Milner B, Zatorre RJ, Meyer E, Evans AC. The neural substrates underlying word generation: a bilingual functional-imaging study. Proc Natl Acad Sci USA. 1995;92:2899–2903. doi: 10.1073/pnas.92.7.2899. [DOI] [PMC free article] [PubMed] [Google Scholar]
- Kwan CL, Crawley AP, Mikulis DJ, Davis KD. An fMRI study of the anterior cingulate cortex and surrounding medial wall activations evoked by noxious cutaneous heat and cold stimuli. Pain. 2000;85:359–374. doi: 10.1016/S0304-3959(99)00287-0. [DOI] [PubMed] [Google Scholar]
- Leclerc C, Saint-Amour D, Lavoie ME, Lassonde M, Lepore F. Brain functional reorganization in early blind humans revealed by auditory event-related potentials. Neuroreport. 2000;11:545–550. doi: 10.1097/00001756-200002280-00024. [DOI] [PubMed] [Google Scholar]
- Lewis JW, Van Essen DC. Corticocortical connections of visual, sensorimotor, and multimodal processing areas in the parietal lobe of the macaque monkey. J Comp Neurol. 2000;428:112–137. doi: 10.1002/1096-9861(20001204)428:1<112::aid-cne8>3.0.co;2-9. [DOI] [PubMed] [Google Scholar]
- Liotti M, Ryder K, Woldorff MG. Auditory attention in the congenitally blind: where, when and what gets reorganized? Neuroreport. 1998;9:1007–1012. doi: 10.1097/00001756-199804200-00010. [DOI] [PubMed] [Google Scholar]
- McDermott K, Petersen S, Watson J, Ojemann J. A procedure for identifying regions preferentially activated by attention to semantic and phonological relations using functional magnetic resonance imaging. Neuropsychologia. 2003;41:293–303. doi: 10.1016/s0028-3932(02)00162-8. [DOI] [PubMed] [Google Scholar]
- Melzer P, Morgan VL, Pickens DR, Price RR, Wall RS, Ebner FF. Cortical activation during Braille reading is influenced by early visual experience in subjects with severe visual disability: a correlational fMRI study. Hum Brain Mapp. 2001;14:186–195. doi: 10.1002/hbm.1051. [DOI] [PMC free article] [PubMed] [Google Scholar]
- Millar S. Reading By Touch. London: Routledge; 1997. p. 337. [Google Scholar]
- Mugler JPD, Brookeman JR. Three-dimensional magnetization-prepared rapid gradient-echo imaging (3D MP RAGE) Magn Reson Med. 1990;15:152–157. doi: 10.1002/mrm.1910150117. [DOI] [PubMed] [Google Scholar]
- Nolan C, Kederis C. Perceptual Factors in Braille Word Recognition. New York: American Foundation for the Blind; 1969. p. 178. [Google Scholar]
- Ogawa S, Lee TM, Kay AR, Tank DW. Brain magnetic resonance imaging with contrast dependent on blood level oxygenation. Proc Natl Acad Sci USA. 1990;87:9868–9872. doi: 10.1073/pnas.87.24.9868. [DOI] [PMC free article] [PubMed] [Google Scholar]
- Ojemann JG, Akbudak E, Snyder AZ, McKinstry RC, Raichle ME, Conturo TE. Anatomic localization and quantitative analysis of gradient refocused echo-planar fMRI susceptibility artifacts. Neuroimage. 1997;6:156–167. doi: 10.1006/nimg.1997.0289. [DOI] [PubMed] [Google Scholar]
- Ojemann J, Buckner R, Akbudak E, Snyder A, Ollinger J, McKinstry R, Rosen B, Petersen S, Raichle M, Conturo T. Functional MRI studies of word stem completion: reliability across laboratories and comparison to blood flow imaging with PET. Hum Brain Mapp. 1998;6:203–215. doi: 10.1002/(SICI)1097-0193(1998)6:4<203::AID-HBM2>3.0.CO;2-7. [DOI] [PMC free article] [PubMed] [Google Scholar]
- Ollinger JM, Corbetta M, Shulman GL. Separating processes within a trial in event-related functional MRI. I. The method. Neuroimage. 2001;13:210–217. doi: 10.1006/nimg.2000.0710. [DOI] [PubMed] [Google Scholar]
- Perani D, Cappa SF, Schnur T, Tettamanti M, Collina S, Rosa MM, Fazio F. The neural correlates of verb and noun processing: a PET study. Brain. 1999;122:2337–2344. doi: 10.1093/brain/122.12.2337. [DOI] [PubMed] [Google Scholar]
- Petersen S, Fiez J. The processing of single words studied with positron emission tomography. Annu Rev Neurosci. 1993;16:509–530. doi: 10.1146/annurev.ne.16.030193.002453. [DOI] [PubMed] [Google Scholar]
- Petersen SE, Fox PT, Posner MI, Mintun MA, Raichle ME. Positron emission tomographic studies of the processing of single words. J Cogn Neurosci. 1989;1:153–170. doi: 10.1162/jocn.1989.1.2.153. [DOI] [PubMed] [Google Scholar]
- Petersen SE, Fox PT, Snyder AZ, Raichle ME. Activation of extrastriate and frontal cortical areas by visual words and word-like stimuli. Sci. 1990;249:1041–1044. doi: 10.1126/science.2396097. [DOI] [PubMed] [Google Scholar]
- Picard N, Strick PL. Motor areas of the medial wall: a review of their location and functional activation. Cereb Cortex. 1996;6:342–353. doi: 10.1093/cercor/6.3.342. [DOI] [PubMed] [Google Scholar]
- Poldrack RA, Wagner AD, Prull MW, Desmond JE, Glover GH, Gabrieli JD. Functional specialization for semantic and phonological processing in the left inferior prefrontal cortex. Neuroimage. 1999;10:15–35. doi: 10.1006/nimg.1999.0441. [DOI] [PubMed] [Google Scholar]
- Polk TA, Stallcup M, Aguirre GK, Alsop DC, D’Esposito M, Detre JA, Farah MJ. Neural specialization for letter recognition. J Cogn Neurosci. 2002;14:145–159. doi: 10.1162/089892902317236803. [DOI] [PubMed] [Google Scholar]
- Porro CA, Francescato MP, Cettolo V, Diamond ME, Baraldi P, Zuiani C, Bazzocchi M, di Prampero PE. Primary motor and sensory cortex activation during motor performance and motor imagery: a functional magnetic resonance imaging study. J Neurosci. 1996;16:7688–7698. doi: 10.1523/JNEUROSCI.16-23-07688.1996. [DOI] [PMC free article] [PubMed] [Google Scholar]
- Price CJ. The anatomy of language: contributions from functional neuroimaging. J Anat. 2000;197:335–359. doi: 10.1046/j.1469-7580.2000.19730335.x. [DOI] [PMC free article] [PubMed] [Google Scholar]
- Pring L. Processes involved in Braille reading. J Visual Impair Blin. 1985;79:252–255. [Google Scholar]
- Pring L. Touch and go: learning to read Braille. Read Res Q. 1994;29:67–74. [Google Scholar]
- Raczkowski D, Kalat JW, Nebes R. Reliability and validity of some handedness questionnaire items. Neuropsychologia. 1974;12:43–47. doi: 10.1016/0028-3932(74)90025-6. [DOI] [PubMed] [Google Scholar]
- Raichle ME, Fiez JA, Videen TO, MacLeod AM, Pardo JV, Fox PT, Petersen SE. Practice-related changes in human brain functional anatomy during nonmotor learning. Cereb Cortex. 1994;4:8–26. doi: 10.1093/cercor/4.1.8. [DOI] [PubMed] [Google Scholar]
- Raichle ME, MacLeod AM, Snyder AZ, Powers WJ, Gusnard DA, Shulman GL. A default mode of brain function. Proc Natl Acad Sci USA. 2001;98:676–682. doi: 10.1073/pnas.98.2.676. [DOI] [PMC free article] [PubMed] [Google Scholar]
- Richter W, Somorjai R, Summers R, Jarmasz M, Menon RS, Gati JS, Georgopoulos AP, Tegeler C, Ugurbil K, Kim SG. Motor area activity during mental rotation studied by time-resolved single-trial fMRI. J Cogn Neurosci. 2000;12:310–320. doi: 10.1162/089892900562129. [DOI] [PubMed] [Google Scholar]
- Roskies AL, Fiez JA, Balota DA, Raichle ME, Petersen SE. Task-dependent modulation of regions in the left inferior frontal cortex during semantic processing. J Cogn Neurosci. 2001;13:829–843. doi: 10.1162/08989290152541485. [DOI] [PubMed] [Google Scholar]
- Rumsey JM, Horwitz B, Donohue BC, Nace K, Maisog JM, Andreason P. Phonological and orthographic components of word recognition. A PET-rCBF study. Brain. 1997;120:739–759. doi: 10.1093/brain/120.5.739. [DOI] [PubMed] [Google Scholar]
- Sadato N, Okada T, Honda M, Yonekura Y. Critical period for cross-modal plasticity in blind humans: a functional MRI study. Neuroimage. 2002;16:389–400. doi: 10.1006/nimg.2002.1111. [DOI] [PubMed] [Google Scholar]
- Sadato N, Pascual-Leone A, Grafman J, Deiber MP, Ibanez V, Hallett M. Neural networks for Braille reading by the blind. Brain. 1998;121:1213–1229. doi: 10.1093/brain/121.7.1213. [DOI] [PubMed] [Google Scholar]
- Sadato N, Pascual-Leone A, Grafman J, Ibanez V, Deiber MP, Dold G, Hallett M. Activation of the primary visual cortex by Braille reading in blind subjects. Nature. 1996;380:526–528. doi: 10.1038/380526a0. [DOI] [PubMed] [Google Scholar]
- Seger CA, Rabin LA, Desmond JE, Gabrieli JD. Verb generation priming involves conceptual implicit memory. Brain Cogn. 1999;41:150–177. doi: 10.1006/brcg.1999.1116. [DOI] [PubMed] [Google Scholar]
- Shulman GL, Corbetta M, Buckner RL, Raichle ME, Fiez JA, Miezin FM, Petersen SE. Top-down modulation of early sensory cortex. Cereb Cortex. 1997;7:193–206. doi: 10.1093/cercor/7.3.193. [DOI] [PubMed] [Google Scholar]
- Shulman GL, Ollinger JM, Akbudak E, Conturo TE, Snyder AZ, Petersen SE, Corbetta M. Areas involved in encoding and applying directional expectations to moving objects. J Neurosci. 1999;19:9480–9496. doi: 10.1523/JNEUROSCI.19-21-09480.1999. [DOI] [PMC free article] [PubMed] [Google Scholar]
- Snyder AZ. Difference image vs. ratio image error function forms in PET-PET realignment. In: Bailey D, Jones T, editors. Quantification of Brain Function Using PET. San Diego, CA: Academic Press; 1996. pp. 131–137. [Google Scholar]
- Tagamets MA, Novick JM, Chalmers ML, Friedman RB. A parametric approach to orthographic processing in the brain: an fMRI study. J Cogn Neurosci. 2000;12:281–297. doi: 10.1162/089892900562101. [DOI] [PubMed] [Google Scholar]
- Talairach J, Tournoux P. Coplanar Stereotaxic Atlas of the Human Brain. New York: Thieme Medical; 1988. p. 122. [Google Scholar]
- Thickbroom GW, Byrnes ML, Sacco P, Ghosh S, Morris IT, Mastaglia FL. The role of the supplementary motor area in externally timed movement: the influence of predictability of movement timing. Brain Res. 2000;874:233–241. doi: 10.1016/s0006-8993(00)02588-9. [DOI] [PubMed] [Google Scholar]
- Tootell RB, Hadjikhani N, Hall EK, Marrett S, Vanduffel W, Vaughan JT, Dale AM. The retinotopy of visual spatial attention. Neuron. 1998;21:1409–1422. doi: 10.1016/s0896-6273(00)80659-5. [DOI] [PubMed] [Google Scholar]
- Vandenberghe R, Price C, Wise R, Josephs O, Frackowiak RS. Functional anatomy of a common semantic system for words and pictures. Nature. 1996;383:254–256. doi: 10.1038/383254a0. [DOI] [PubMed] [Google Scholar]
- Van Essen DC. Windows on the brain. The emerging role of atlases and databases in neuroscience. Curr Opin Neurobiol. 2002a;12:574–579. doi: 10.1016/s0959-4388(02)00361-6. [DOI] [PubMed] [Google Scholar]
- Van Essen DC. Organization of visual areas in macaque and human cerebral cortex. In: Chalupa L, Werner J, editors. The Visual Neurosciences. Boston, MA: MIT Press; 2002b. [Google Scholar]
- Wagner AD, Pare-Blagoev EJ, Clark J, Poldrack RA. Recovering meaning: left prefrontal cortex guides controlled semantic retrieval. Neuron. 2001;31:329–338. doi: 10.1016/s0896-6273(01)00359-2. [DOI] [PubMed] [Google Scholar]
- Zarahn E, Aguirre G, D’Esposito M. A trial-based experimental design for fMRI. Neuroimage. 1997;6:122–138. doi: 10.1006/nimg.1997.0279. [DOI] [PubMed] [Google Scholar]
- Zatorre RJ. Do you see what I’m saying? Interactions between auditory and visual cortices in cochlear implant users. Neuron. 2001;31:13–14. doi: 10.1016/s0896-6273(01)00347-6. [DOI] [PubMed] [Google Scholar]
- Zatorre RJ, Meyer E, Gjedde A, Evans AC. PET studies of phonetic processing of speech: review, replication, and reanalysis. Cereb Cortex. 1996;6:21–30. doi: 10.1093/cercor/6.1.21. [DOI] [PubMed] [Google Scholar]