Figure 3.

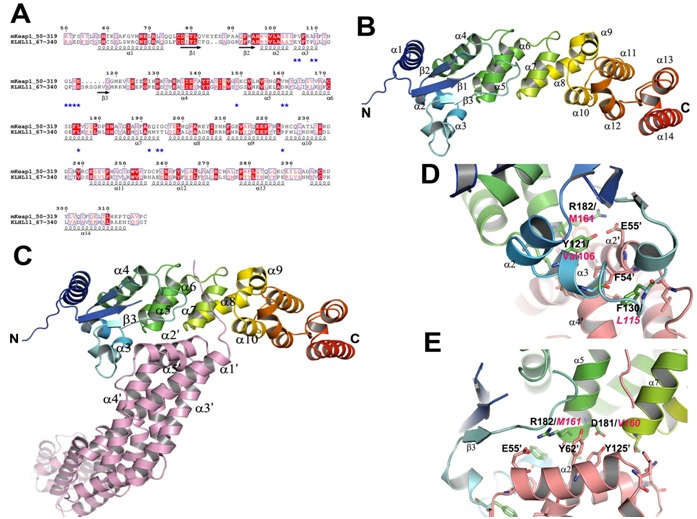
Comparison analysis of the BTB-BACK domains and its complex with Cul3. (A) Sequence alignment of mKeap1 (aa: 50- 319; KEAP1_MOUSE) with hKLHL11 (aa: 67-340; Q13618). The potential interface residues responsible for making complex with Cul3 are shown in blue stars. The secondary structural features from hKLHL11 (PDB Id: 4AP2) are shown above the alignments. The colors reflect the similarity (red boxes and white characters for conserved residues; red characters for similarity in a group; blue frames for similarity across groups). The sequence was aligned and rendered by Clustal W [21] and ESPript [23], respectively. (B) A cartoon ribbon diagram of the BTB-BACK domains (PDB Id: 4AP2). Only one chain of the homodimer is shown for clarity. The loop connecting β1 and β2 is absent in the crystal structure. (C) A cartoon ribbon diagram of the BTB-BACK domains in complex with Cul3 (salmon) (PDB Id: 4AP2), and labeled only the interacting secondary structure elements. (D) & (E) Showing representative diagrams at the Cul3 interface region. The corresponding residues in mKeap1are labeled in magenta.
