Abstract
Intestinal epithelial stem cell identity and location has been the matter of substantial research. Cells in the +4 niche are slow-cycling and label retaining, while a distinct stem cell niche located at the crypt base is occupied by crypt base columnar (CBC) cells. CBCs are distinct from +4 cells, and the relationship between them is unknown, though both give rise to all intestinal epithelial lineages. We demonstrate that Hopx, an atypical homeobox protein, is a novel and specific marker of +4 cells. Hopx-expressing cells give rise to CBCs and all mature intestinal epithelial lineages. Conversely, CBCs can give rise to +4 Hopx positive cells. These findings demonstrate a bi-directional lineage relationship between active and quiescent stem cells in their niches.
The multicellular epithelium of the intestine is replaced every few days, and this renewal process is maintained by multipotent intestinal stem cells (ISCs) (1, 2). The location and identity of ISCs has been a matter of significant research and debate, with implications for understanding gastrointestinal cancer, repair after intestinal injury, and normal physiology. Numerous previous reports suggest that ISCs are located at the +4 position relative to the crypt base (3, 4), while a separate body of work has identified a distinct stem cell niche at the crypt base where crypt base columnar (CBC) cells are interspersed between Paneth cells (5–7). The +4 cells correspond to the location of slow-cycling, label-retaining cells (LRCs) (3, 8) and co-localize with Bmi1-expressing cells (4) as well as those expressing an mTert transgene (9, 10). CBC stem cells, on the other hand, are marked by Lgr5 (5). Although +4 cells and CBCs are clearly distinct, lineage tracing studies have shown that both can give rise to all the various cell types comprising the small intestine epithelium: goblet cells, neuroendocrine cells, Paneth cells, and epithelial absorptive cells. However, the relationship between these two distinct stem cell populations remains incompletely understood. A recent report suggests that +4 cells can compensate for the loss of CBCs to maintain homeostasis after experimental ablation of Lgr5-expressing cells (11). However, a bi-directional lineage relationship between active and quiescent populations of stem cells in multiple tissues has also been postulated (2), though experimental evidence to support this proposal has been lacking. Here, we show that quiescent +4 ISCs express the atypical homeobox gene Hopx, and give rise to Lgr5-expressing CBCs. Conversely, rapidly cycling CBCs expressing Lgr5 give rise to +4 cells expressing Hopx. These findings reconcile controversies regarding the location and identity of ISCs and demonstrate inter-conversion between organ-specific stem cell niches.
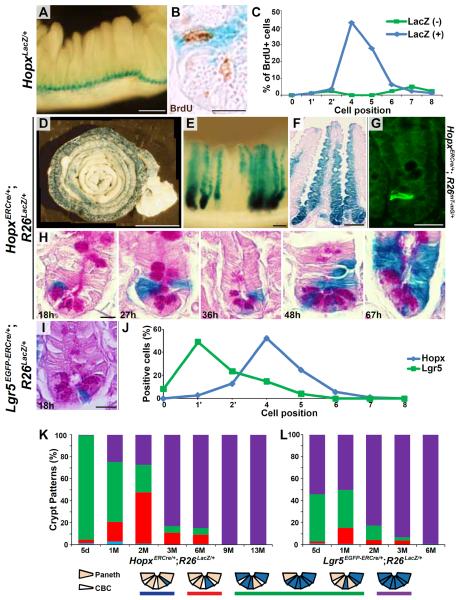
Hopx encodes an atypical homeodomain-containing protein that has previously been studied in the heart and neural stem cells (12–14). Analysis of the intestines of Hopx lacZ knockin (HopxLacZ/+) mice reveals robust expression of ß-galactosidase in intestinal crypts along the entire length of the intestine (Fig. 1A and fig. S1A). Expression is strongest in the +4 region and includes label-retaining cells identified after irradiation and pulse labeling with 5-bromodeoxyuridine (BrdU) (9, 15, 16) (Fig. 1B and fig. S1B). Eighty-six percent (68/79) of non-Paneth BrdU-retaining cells express ß-galactosidase, and nearly all are at or near the +4 position (Fig. 1C). Similar results were found in unirradiated animals; ninety-two percent (35/38) of non-Paneth BrdU-retaining cells express ß-galactosidase (fig. S1C). In order to track the fate of Hopx cells, we generated a tamoxifen-inducible Cre (ERCre) knockin targeted to the 3' untranslated region of the Hopx locus following an internal ribosomal entry sequence (IRES) (HopxERCre/+) (fig. S2) and crossed them with R26RstoplacZ (R26LacZ/+) indicator mice (fig. S3) (17, 18). Two months after tamoxifen induction, punctate staining indicative of ß-galactosidase activity in cells derived from Hopx-expressing precursors is evident in intestinal crypts with a proximal-to-distal gradient (Fig. 1D). Under the conditions used, tamoxifen induction is only partially efficient; nevertheless, entire crypt-villus structures are labeled suggesting clonal origins. Hopx descendants are present at least 13 months after induction (Fig. 1E, F), the latest time point we examined, despite the fact that the entire intestinal epithelium replenishes every ~5 days, suggesting that Hopx cells self renew and/or give rise to multipotent ISCs. All differentiated intestinal epithelial cell types can derive from Hopx cells, including Paneth, goblet, neuroendocrine, and absorptive cells (fig. S4). Eighteen hours after a single pulse of tamoxifen to HopxERCre/+;R26mT-mG/+ mice, distinct single cells at the +4 position express GFP (Fig. 1G). Serial analysis of Hopx descendants following initial pulse-labeling of Hopx clones indicates that Hopx cells at the +4 position give rise to progeny that populate the crypt base and the villus epithelium (Fig. 1H). The entire crypt base, including regions occupied by CBCs expressing Lgr5, expresses ß-galactosidase.
Fig. 1. Hopx labels ISCs at the +4 position in intestinal epithelial crypts.
(A) Whole mount X-gal stained small intestine from a HopxLacZ/+ mouse. (B) Double staining of HopxLacZ/+ intestine for LacZ and BrdU using a post-irradiation regeneration labeling protocol. (C) Quantification of BrdU positive cells at each crypt position. (D) Composite image (9 images combined into 1) of X-gal stained HopxERCre/+;R26LacZ/+ small intestine 2 months after a 5 day tamoxifen pulse. (E and F) X-gal staining 13 months after tamoxifen induction; whole-mount image (E) and eosin counter-stained section (F). (G) Immunohistochemical GFP staining in crypts of HopxERCre/+;R26mT-mG/+ mice 18h after tamoxifen induction. GFP-positive cells are at the +4 position. (H) Time course of Hopx lineage tracing (HopxERCre/+;R26LacZ/+) after a single tamoxifen pulse. (I) X-gal staining of Lgr5EGFP-ERCre/+;R26LacZ/+ intestine 18 hours after tamoxifen induction. Lgr5 cells are found between Paneth cells at the crypt base. (J) Comparison of the location of Lgr5 and Hopx positive cells in the small intestine. Lgr5-expressing cells are predominantly at the 1' or 2' position while most Hopx-expressing cells are at the +4 or +5 position (5). (Analysis performed 18 hours after a single pulse of tamoxifen.) (K and L) The pattern of X-gal staining was analyzed in HopxERCre/+;R26LacZ/+ (K) and Lgr5EGFP-ERCre/+;R26LacZ/+ (L) mice after a 5 day tamoxifen induction (chase periods as indicated, M=months). Staining patterns were scored according to the key below the graphs. Scale bars: 10 μm (B, H, I), 25 μm (G), 100 μm (E and F), 250 μm (A), and 1000 μm (D).
The location of Hopx cells in the intestine is distinct from that of Lgr5 cells (compare Fig. 1G to Fig. 1I). The position of ß-galactosidase positive cells in 334 crypts was recorded 18 hours after tamoxifen induction confirming a propensity for the +4 position (Fig. 1J). In contrast, a similar analysis performed with Lgr5EGFP-IRES-ERCre/+;R26LacZ/+ mice (Lgr5EGFP-ERCre/+;R26LacZ/+) (5) places Lgr5 cells predominantly between Paneth cells in the +1/+2 position (Fig. 1I, J). Serial analysis over the course of 13 months indicates that increasing numbers of crypt-villus structures are entirely labeled over time (Fig. 1K, purple). We observed a gradual decrease in the number of crypts that had 2 or more LacZ positive cells without ubiquitous labeling (Fig. 1K, green), and an increase in crypts with a single labeled PAS positive Paneth cell (Fig. 1K, red) consistent with the relatively long survival of Paneth cells compared with other epithelial cell types. Interestingly, parallel experiments using Lgr5EGFP-ERCre/+;R26LacZ/+ mice show more rapid acquisition of ubiquitous crypt-villus labeling (Fig. 1L), consistent with the interpretation that Lgr5 positive cells are more rapidly cycling stem cells (n=3 mice for each genotype; over 190 crypts were scored for each time point). Taken together, these data indicate that Hopx positive cells at the +4 position are multi-potent, slow-cycling, label-retaining ISCs, which are distinct from Lgr5 positive cells at the crypt base.
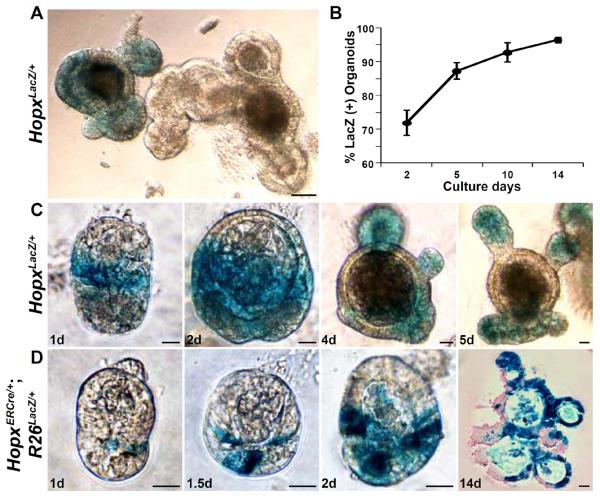
CBCs have been shown previously to form crypt-villus structures and generate all intestinal epithelial cell types in organoid culture (19). Cultures of crypt epithelial cells from HopxLacZ/+ mice, which constitutively express ß-galactosidase from the Hopx locus (18), produce two types of organoids: those that express ß-galactosidase and those that do not (Fig. 2A). Over time in culture, the percentage of organoids expressing ß-galactosidase increases from approximately 70% at day 2 to over 95% by day 14 (Fig. 2B). ß-galactosidase produced from the Hopx locus is relatively stable and can perdure, as has been reported in other cases (for example, see (20)). Thus, all cells expressing Hopx and their early descendants express ß-galactosidase. The presence of unlabeled organoids in these experiments indicates the existence of ISCs that do not express, and did not recently express, Hopx. Examination of organoids from HopxLacZ/+;Lgr5EGFP-ERCre/+ mice indicates that ß-galactosidase negative organoids express GFP from the Lgr5 locus (fig. S5A, B).
Fig. 2. Organoid cultures of Hopx-labeled cells.
(A) X-gal stained organoids from HopxLacZ/+ mice after 9 days of crypt culture. (B) Time course of the percentage of LacZ-positive organoids derived from HopxLacZ/+ mice. Two hundred organoids from three different HopxLacZ/+ mice were analyzed (error bars: 1 s.d.). (C) Examples of crypt organoids from HopxLacZ/+ mice stained with X-gal. (D) Examples of crypt organoids from HopxERCre/+;R26LacZ/+ mice (tamoxifen pulse for 12h on day 0.5 of culture). X-gal stained images are shown with a 14 day eosin counter-stained image. Scale bars: 50 μm (A) and 20 μm (C and D).
In cultures in which ß-galactosidase expression is identified, labeled cells are initially located immediately above Paneth cells (identified by their dense granules). Labeled cells expand to generate crypt-villus “buds” in organoid culture (Fig. 2C). Similar experiments using HopxERCre/+;R26LacZ/+ cultures exposed to a single pulse of tamoxifen confirms the clonal origin of developing crypt-villus structures and epithelial derivatives (Fig. 2D). Cultures derived from HopxLacZ/+;Lgr5EGFP-ERCre/+ mice also produce organoids in which ß-galactosidase (perduring in Hopx-derived cells) overlaps with expression of GFP derived from the Lgr5 locus (fig S5C, D).
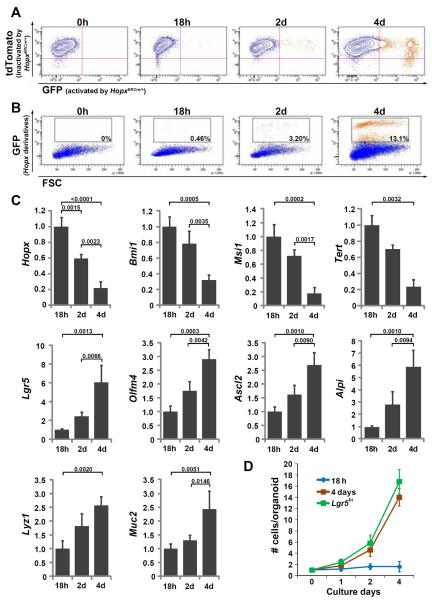
Hopx cells at the +4 position and Hopx descendants located between Paneth cells at the crypt base were isolated by laser capture microdissection (LCM) from HopxERCre/+;R26LacZ/+ mice 18 hours and 48 hours after tamoxifen induction, respectively, and expression levels of stem cell markers were compared. Lgr5 is robustly expressed in Hopx descendant CBCs, while Hopx and Bmi1 are more strongly expressed by +4 cells (fig. S6 and S7). In separate experiments, Hopx cells and their descendants were isolated by fluorescence activated cell sorting (FACS) from HopxERCre/+;R26mT-mG/+ mice 18 hours, 2 and 4 days after tamoxifen treatment (Fig. 3A and B), and the expression level of stem cell and differentiation markers was analyzed. Expression of Hopx, Bmi1, Msi1 and Tert, markers of +4 cells (4, 9, 10, 21), decreases over time while Lgr5, Olfm4 and Ascl2, expressed by CBCs (5, 22, 23), increases (Fig. 3C). Genes expressed by differentiated epithelial derivatives including Alpi, Lyz1, and Muc2 also increase (Fig. 3C). Interestingly, single Hopx cells isolated 18 hours after tamoxifen induction in these experiments remain quiescent in culture. For example, in one experiment only 1 of 7,500 cells isolated by FACS expanded significantly during 4 days of culture in the presence of Wnt3A (100ng/ml). This contrasts with cells isolated 4 days after tamoxifen treatment, which proliferate at the rate equivalent to Lgr5hi cells (those with the most robust GFP expression (5)) derived from Lgr5EGFP-ERCre/+ mice (Fig. 3D). Taken together, these findings are consistent with the interpretation that Hopx labels a quiescent population of ISCs that can give rise to more rapidly proliferating Lgr5-expressing ISCs. This conversion may take place more prominently in vivo than in vitro, perhaps due to signals present in the niche.
Fig. 3. FACS and gene expression of Hopx descendants.
(A and B) FACS sorted Hopx descendants after a pulse of tamoxifen (HopxERCre/+;R26mT-mG/+). Representative plots from one of three experiments are shown. Analysis of Hopx descendants at the indicated time periods after a single pulse of tamoxifen to HopxERCre/+;R26mT-mG/+ mice demonstrates a gradual increase in the number of cells expressing GFP (orange), representing Hopx derivatives, and a concomitant loss of the tdTomato signal (blue, ubiquitously expressed until inactivated by HopxERCre/+ expression). Percentages of cells expressing GFP are shown in the gated population in (B). (C) Gene expression of GFP-positive cells was determined by qRT-PCR (normalized to GAPDH). Results are expressed relative to the level of gene expression observed 18 hours after tamoxifen induction, n=3. (D) Rate of growth per organoid, n=5. Hopx derivatives 18 h (blue) or 4 d (brown) after tamoxifen induction of HopxERCre/+;R26mT-mG/+ mice, and Lgr5hi (green) cells from HopxLacZ/+;Lgr5EGFP-ERCre/+ mice were utilized (error bars: 1 s.d.).
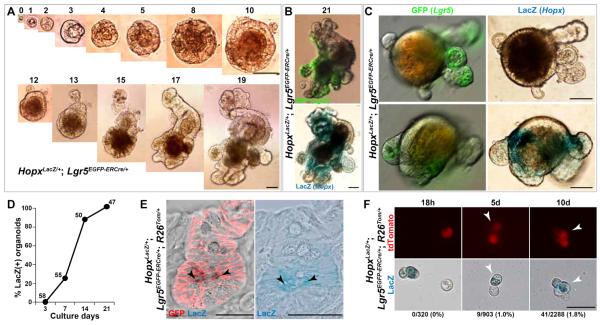
Lgr5 cells can also give rise to Hopx-expressing cells. Single Lgr5hi cells derived from HopxLacZ/+;Lgr5EGFP-ERCre/+ mice produce organoids with an efficiency of 13.0 ± 3.0% and 3.08 ± 0.57% with and without Wnt3A (100ng/ml), respectively (n=2,000 cells in each group from 3 different mice) (Fig. 4A), similar to results reported previously by others using Lgr5EGFP-ERCre/+ mice (19, 24). After 21 days in culture, robust ß-galactosidase expression is evident in a pattern distinct from that of GFP (Fig. 4B). At 3 days of culture, all organoids are LacZ negative, but by 7 days over 20% of the organoids express ß-galactosidase (Fig. 4C, D), and by 21 days 100% (47/47) express ß-galactosidase (Fig. 4D), demonstrating that Lgr5 positive cells can give rise to Hopx-expressing cells in vitro. In vivo, fate-mapping of Lgr5 cells using HopxLacZ/+;Lgr5EGFP-ERCre/+;R26mT-mG/+ mice, 5 months after a 5 day tamoxifen pulse, reveals entire crypt-villus structures that express membrane-bound GFP, including cells at the +4 position that simultaneously express ß-galactosidase, indicating that they are derived from Lgr5 precursors (Fig. 4E). We also prepared near single cell suspensions of crypts from HopxLacZ/+;Lgr5EGFP-ERCre/+;R26tdTomato/+ (HopxLacZ/+;Lgr5EGFP-ERCre/+;R26Tom/+) mice either 18 hours, 5 days, or 10 days after a single pulse of tamoxifen and analyzed the cells for LacZ and tdTomato expression. Eighteen hours after induction, we found no LacZ and tdTomato double positive cells, consistent with the fact that Hopx-expressing cells are distinct from Lgr5 positive cells. However, over the ensuing 10 days, double positive cells emerged, confirming that Lgr5 positive cells can give rise to Hopx-expressing, +4 cells (Fig. 4F).
Fig. 4. Lgr5 positive cells can give rise to Hopx positive cells.
(A and B) Organoid cultures from single Lgr5hi cells (HopxLacZ/+;Lgr5EGFP-ERCre/+). Days of growth above each panel. (B) Day 21 GFP and ß-galactosidase expression. (C) Day 7 single Lgr5hi cell organoid cultures. There are both LacZ negative (top) and positive organoids (bottom). (D) Percentage of organoids derived from single Lgr5hi cells (HopxLacZ/+;Lgr5EGFP-ERCre/+) that are LacZ-positive. (Number of organoids analyzed listed above each time point.) (E) Confocal image of LacZ and GFP double staining 5 months after 5 day tamoxifen pulse to HopxLacZ/+;Lgr5EGFP-ERCre/+;R26mT-mG/+ mice (black arrowheads points to double positive cells). The right panel (E) is a light microscope image of the same crypt demonstrating LacZ expression, and arrowheads point to LacZ positive, +4 cells. GFP expression (shown as red membrane-bound signal) demarcates Lgr5 derivatives while LacZ (blue) indicates Hopx expression. (F) Representative images of double positive cells isolated after a single pulse of tamoxifen to HopxLacZ/+;Lgr5EGFP-ERCre/+;R26Tom/+ mice. Percentage of double positive cells as compared to tdTomato cells are shown. Note, 18 hours after a single pulse, there are zero double positive cells. White arrowhead points to double positive cell in representative images. tdTomato (red) indicates Lgr5 derivatives; LacZ (blue) indicates Hopx expression. Scale bars: 25 μm (E, F) and 50 μm (A, B, C).
Our results provide experimental evidence to support a proposed model (2) in which slowly cycling ISCs at the +4 position are able to dynamically inter-convert with more rapidly cycling ISCs at the crypt base (CBCs). Both populations display properties of self-renewal and are multipotent, consistent with stem cell identity. These findings help to reconcile prior controversy in the field and suggest that adult organ-specific stem cells in distinct niches can regenerate one another. Further elucidation of the unique properties of each stem cell population and the signals that regulate inter-conversion will be likely to inform gastrointestinal pathophysiology and stem cell biology in the future.
Supplementary Material
Acknowledgements
We thank the Epstein laboratory for helpful discussions. We thank C.J. Lengner, A. Padmanabhan, N. Singh, and K.S. Zaret for critical reading of the manuscript. We thank the Penn Flow Cytometry core and Charles Pletcher for assistance with FACS experiments. This work was supported by an American Heart Association Physician-Scientist/Post-Doctoral fellowship to R.J. (AHA 0825548D) and funds from the NIH (R01 HL071546, U01 HL100405), the Spain fund for Regenerative Medicine, and WW Smith Endowed Chair to J.A.E.
Footnotes
Supporting Online Material www.sciencemag.org
References
- 1.Vries RG, Huch M, Clevers H. Molecular oncology. 2010 Oct;4:373. doi: 10.1016/j.molonc.2010.05.001. [DOI] [PMC free article] [PubMed] [Google Scholar]
- 2.Li L, Clevers H. Science. 2010 Jan 29;327:542. doi: 10.1126/science.1180794. [DOI] [PMC free article] [PubMed] [Google Scholar]
- 3.Potten CS, Kovacs L, Hamilton E. Cell and tissue kinetics. 1974 May;7:271. doi: 10.1111/j.1365-2184.1974.tb00907.x. [DOI] [PubMed] [Google Scholar]
- 4.Sangiorgi E, Capecchi MR. Nature genetics. 2008 Jul;40:915. doi: 10.1038/ng.165. [DOI] [PMC free article] [PubMed] [Google Scholar]
- 5.Barker N, et al. Nature. 2007 Oct 25;449:1003. doi: 10.1038/nature06196. [DOI] [PubMed] [Google Scholar]
- 6.Bjerknes M, Cheng H. Gastroenterology. 1999 Jan;116:7. doi: 10.1016/s0016-5085(99)70222-2. [DOI] [PubMed] [Google Scholar]
- 7.Cheng H, Leblond CP. The American journal of anatomy. 1974 Dec;141:537. doi: 10.1002/aja.1001410407. [DOI] [PubMed] [Google Scholar]
- 8.Potten CS, Al-Barwari SE, Hume WJ, Searle J. Cell and tissue kinetics. 1977 Nov;10:557. doi: 10.1111/j.1365-2184.1977.tb00312.x. [DOI] [PubMed] [Google Scholar]
- 9.Breault DT, et al. Proceedings of the National Academy of Sciences of the United States of America. 2008 Jul 29;105:10420. doi: 10.1073/pnas.0804800105. [DOI] [PMC free article] [PubMed] [Google Scholar]
- 10.Montgomery RK, et al. Proceedings of the National Academy of Sciences of the United States of America. 2011 Jan 4;108:179. [Google Scholar]
- 11.Tian H, et al. Nature. 2011 Sep 18; [Google Scholar]
- 12.Chen F, et al. Cell. 2002 Sep 20;110:713. [Google Scholar]
- 13.Shin CH, et al. Cell. 2002 Sep 20;110:725. [Google Scholar]
- 14.De Toni A, et al. Neural development. 2008;3:13. doi: 10.1186/1749-8104-3-13. [DOI] [PMC free article] [PubMed] [Google Scholar]
- 15.Potten CS, Owen G, Booth D. Journal of cell science. 2002 Jun 1;115:2381. doi: 10.1242/jcs.115.11.2381. [DOI] [PubMed] [Google Scholar]
- 16.He XC, et al. Nat Genet. 2004 Oct;36:1117. doi: 10.1038/ng1430. [DOI] [PubMed] [Google Scholar]
- 17.Soriano P. Nature genetics. 1999 Jan;21:70. doi: 10.1038/5007. [DOI] [PubMed] [Google Scholar]
- 18.Materials and methods are available as supporting material on Science Online.
- 19.Sato T, et al. Nature. 2009 May 14;459:262. [Google Scholar]
- 20.Relaix F, Rocancourt D, Mansouri A, Buckingham M. Nature. 2005 Jun 16;435:948. doi: 10.1038/nature03594. [DOI] [PubMed] [Google Scholar]
- 21.Potten CS, et al. Differentiation; research in biological diversity. 2003 Jan;71:28. doi: 10.1046/j.1432-0436.2003.700603.x. [DOI] [PubMed] [Google Scholar]
- 22.van der Flier LG, Haegebarth A, Stange DE, van de Wetering M, Clevers H. Gastroenterology. 2009 Jul;137:15. doi: 10.1053/j.gastro.2009.05.035. [DOI] [PubMed] [Google Scholar]
- 23.van der Flier LG, et al. Cell. 2009 Mar 6;136:903. [Google Scholar]
- 24.Sato T, et al. Nature. 2011 Jan 20;469:415. doi: 10.1038/nature09637. [DOI] [PMC free article] [PubMed] [Google Scholar]
Associated Data
This section collects any data citations, data availability statements, or supplementary materials included in this article.


