

Abstract
Objective
HIV viral load set point has long been used as a prognostic marker of disease progression and more recently as an end-point parameter in HIV vaccine clinical trials. The definition of set point, however, is variable. Moreover, the earliest time at which the set point is reached after the onset of infection has never been clearly defined.
Methods
In this study, we obtained sequential plasma viral load data from 60 acutely HIV-infected Chinese patients among a cohort of men who have sex with men (MSM), mathematically determined viral load set point levels, and estimated time to attain set point after infection. We also compared the results derived from our models and that obtained from an empirical method.
Results
With novel uncomplicated mathematic model, we discovered that setpoint may vary from 21 to 119 days dependent on the patients' initial viral load trajectory. The viral load set points were 4.28 ± 0.86 and 4.25 ± 0.87 log10 copies/ml (P = 0.08), respectively, as determined by our model and an empirical method, suggesting an excellent agreement between the old and new methods.
Conclusion
We provide a novel method to estimate viral load set point at the very early stage of HIV infection. Application of this model can accuratly and reliably determine set point, thus providing a new tool for physicians to better monitor early intervention strategies in acutely infected patients, and scientists to rationally design preventative vaccine studies.
Keywords: HIV-1, viral load, set point, acute infection, seroconversion
Introduction
HIV viral load set point has long been used as a predictor of disease progression [1-4], and more recently as a parameter of HIV vaccine efficacy [5]. The definition of viral load set point, however, is more variable. During the early phase of primary HIV-1 infection, plasma viral load increases sharply by several orders of magnitude to a peak in the first few weeks post-infection, then drops rapidly within months to a relatively stable level, which has been called the viral load set point [3]. HIV-infected individuals who have a higher viral load set point have a faster progression to AIDS and death [3, 6-8]. However, most data on the timing and clinical relevance of HIV-1 viral load set points have come from studies in North America, Europe and Africa[9-15]. To date, no longitudinal studies have been performed to examine the viral load set point in acute HIV-1 infected Chinese, who have a different genetic background from those of other races. In addition, there is no consensus on the time at which set point is reached due to modest numbers of subjects with well-defined dates of acquisition of infection or seroconversion, limited frequency of sampling in most acute infection cohorts, and more recently the use of early ART following infection acquisition which precludes determination of the natural evolution to set-point. In one study, plasma viral load set point was loosely defined as the viral load measured between 4–24 months after HIV-1 infection [1, 3, 16]. Alternatively, it was estimated using a method that calculates the average of all measurements taken after 4 months since the onset of infection, and with the assumption that all these observations were in the steady state [3, 17]. However, neither of the two methods can estimate the exact time at which viral load set point is attained.
In this study, we collected longitudinal clinical and laboratory data from patients with acute HIV-1 infection, and then used regression models to estimate the viral load set point values, and the exact time at which set point was attained. Our data showed that time to viral load set point after onset of infection was variable, but earlier than reported in other studies. This study also provides unique information for therapeutic and vaccine clinical trials to be conducted in Chinese patients.
Methods
Study population
This study used subjects from an ongoing prospective clinical cohort study of primary HIV-1-infected individuals in Beijing (Wu et al, unpublished data). Starting in October 2006, men who have sex with men (MSM) were enrolled into a longitudinal prospective cohort study if they were at least 18 years old and HIV-negative at baseline. After enrollment, these HIV-negative men were monitored every 2 months for plasma HIV antibodies, HIV RNA levels, and clinical signs of acute infection. The subjects for whom the HIV antibody status was negative or indeterminate but positive by nucleic acid amplification testing were defined as having acute HIV-1 infection[12]. Whole blood specimens were collected at week 1, 2, 4, 8 and 12, and then every three months thereafter from detection of seroconversion, and used to separate plasma, serum and peripheral blood mononuclear cells (PBMCs). None of the subjects were treated by ART during acute HIV infection. The study was approved by the Beijing YouAn Hospital Research Ethics Committee, and written informed consent was obtained from each subject.
Subjects with <4 available samples within the first 4 months after estimated date of HIV-1 infection were excluded. No HIV-1 RNA viral load determination after the initiation of therapy was included in the analysis. Overall, 87 individuals were diagnosed with Primary HIV Infection (PHI) who were estimated to have been infected in the mid-point between the last seronegative and the first seropositive. According to the estimated date of acquisition of HIV infection, they were divided into three groups: (A) 17 with an ELISA negative while HIV RNA positive, who were estimated that HIV-1 infection occurred 17 days before the first sample was found to be positive for HIV RNA in these patients based on a published algorithm[9]; (B) 25 with an indeterminate western blot who were estimated to have been infected 30 days prior to the index or enrollment specimen; and (C) 45 with a negative for HIV-1 antibody and also negative for HIV-1 RNA followed by a seropositive and RNA positive with a time between tests < 2 months. The study population had an average age of 33.2 (SD: 9.5) years at enrollment, a median of 7 (range, 4–14) sequential viral load measurements, and a median follow-up length of 283 days (range, 80–698 days).
Laboratory methods
Standard HIV type 1 (HIV-1) ELISA (Abbott recombinant HIV-1/2 3rd generation, Vironostika HIV Uni-Form II plus O) and western blot analysis (Genelabs, HIV Blot2.2, AE2029) kits were used for antibody tests. Plasma HIV-1 RNA copies were measured by a quantitative RT-PCR HIV-1 RNA test (Roche Cobas Amplicor HIV-1 Monitor Test). Samples that tested RNA positive with HIV-1 copy numbers below the limit of quantitation (400 copies/ml) were assigned a value of 200 copies/ml for statistical purposes.
Regression models for estimating viral set point
Notation
Suppose there are m untreated HIV-infected patients, each with ni viral load measurements with i =1,…,m. Let Vi j and ti j denote the logarithm (base 10) of the viral load and the days since infection for the jth examination of the ith patient (i =1,…,m and j =1,…, ni) respectively.
Let TSi and VSi be the estimated time to steady state post-infection for the ith patient and the estimated viral load at that time, namely the viral set point, respectively. Let VPi and TPi be the estimated peak value of the viral load and the time to viral load peak for the ith patient, respectively. Let VNi and TNi be the estimated lowest viral load (i.e. the viral load nadir) before day TSi post-infection and the time to the viral load nadir for the ith patient, respectively.
Viral load kinetic patterns
A linear segmented regression of viral load from the time since infection was fitted for each individual, to obtain estimates of the parameters (TSi, VSi), (TPi, VPi) and (TNi, VNi) described above for the ith patient.
We modeled the dynamic changes of viral load using a mathematical equation that has as many as four terms. The first term describes a linear increase to the viral load peak. The second term describes a linear decline of viral load from the peak to a nadir concentration. The third term describes a subsequent slight linear increase of viral load to the set-point. The last term corresponds to the steady phase of the change of viral load, during which the viral load approaches a stable value. For this last term, a constant viral load was used. In clinical practice, however, one or more parts of this idealized viral load pattern may not be observed in some patients. Thus, we eliminated terms corresponding to missing parts of the pattern. All the possible viral load kinetic patterns in our observations are illustrated in Fig. 1.
Fig. 1. Variable patterns of HIV plasma viremia change over time.
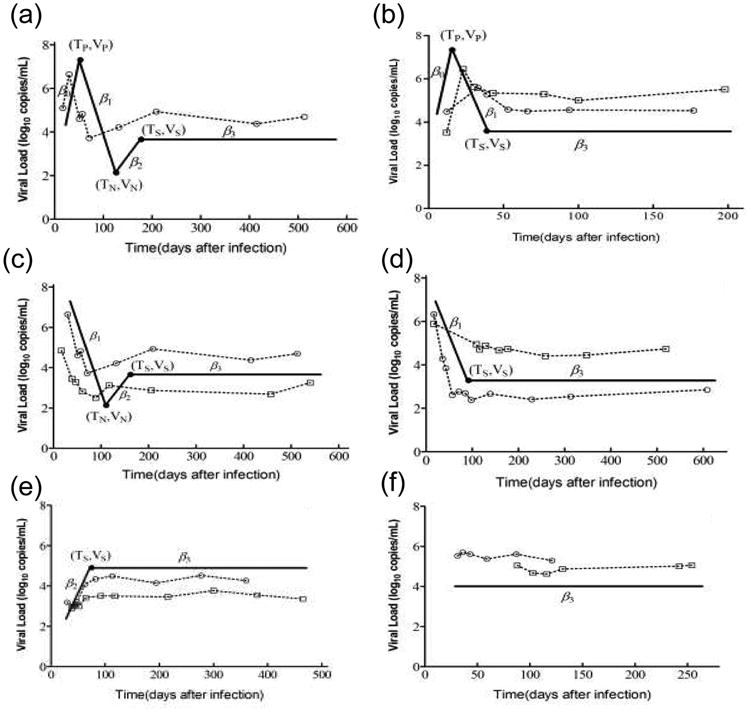
Six patterns of viral load kinetics were observed. Idealized patterns are illustrated by the solid line. (a) Pattern 1 is the idealized pattern of dynamic changes in viral load. Observed viral loads increase to a peak, then decrease rapidly from the peak to the nadir, followed by a rapid increase before reaching a stable value. (b) Viral loads in pattern 2 rapidly increased before reaching a peak, and then rapidly declined to the steady state. (c) In pattern 3, observed viral loads decreased rapidly to the nadir, and then increased to stable values. (d) and (e) Patterns 4 and 5 were defined by rapid decline and increase to steady state, respectively. (f) Viral loads in pattern 6 had already reached a steady state at the time of the first measurement post-infection. The parameter β0 represents the rate of change of viral load before reaching the peak. The parameter β1 represents the rate of change of initial viral load decline. The parameters β2 and β3 represent the rates of change during the adjustment and steady-state periods, respectively. Scatter dots along with dashed lines are sequences of measurements for selected patients with each viral load kinetic pattern.
Using the above terms, assumptions and notations, we obtained the following six equations:
| (1) |
| (2) |
| (3) |
| (4) |
| (5) |
| (6) |
where β1 < 0 and β2 and β0 > 0 in these models were the rates of the decline and the increment of viral load, respectively. β3 was the change in rate of viral load in the steady period. In general, individuals with viral load decline or increment of <0.5 log10 copies/ml in 6 months were defined as having achieved steady state. Thus, if the absolute value of β3 was <0.0027 log10 copies/ml/day (i.e. 1 log10 copies/ml/year), the viral loads were defined as achieving the steady state and the viral set point could then be obtained. Otherwise, the individual was defined as having experienced failure to reach a steady state, and no viral set point could be estimated.
Models (1)– (6) represent the kinetic patterns 1–6 shown in Fig 1a–f, respectively. After we obtained estimates of all the parameters that appeared in one of the six models by fitting the model to data for the ith patient using least squares regression, estimates of the viral load peak VPi and nadir VNi, , could then be obtained by substituting TPi and TNi for tij in the corresponding model, respectively. To estimate the parameter VSi more accurately, VSi was calculated as the average of all the observed viral loads after time TSi. In model (6), the time to steady state, i.e. TSi, could not be estimated due to the lack of significant change of all the observed viral loads.
Empirical method of viral set point calculation
Another goal of this study was to compare mathematical regression models with the empirical method to measure the value of the viral load set point. We also calculated the set point as the average of all measurements taken at 4 months after infection according to the empirical model [4].
Statistical analysis
All values were given as mean ± SD in log10 units. Paired samples t test was used to test for difference in viral set points estimated by the two methods. P<0.05 (two-sided) was considered statistically significant.
To examine the absolute agreement between the viral set points estimated by using the proposed viral load kinetic models and those estimated by the empirical method, the Lin's concordance correlation coefficient (CCC) [18] was calculated as well as the location shift and scale shift of the CCC. Visual assessment of agreement was obtained by the use of Bland–Altman plots [19,20].
Statistical analyses were done with SPSS for Windows version 15.0 (SPSS, Chicago, IL, USA) and GraphPad Prism version 5.01 for Windows (GraphPad Software, San Diego, CA, USA). The fitness of the viral load kinetic models and the estimation of parameters were done with MATLAB version 7.6 (MathWorks, Natick, MA, USA).
Results
Application of the proposed models
One of the six models discussed in the Materials and Methods section was used to estimate viral loads in all 87 enrolled patients (Fig. 1). Eighteen patients had either an increase or a decrease in viral load for more than 0.0027 log10 copies/ml/day, meaning that their viral load failed to reach a steady state. Another example of failure to reach a steady state was that viral load fluctuated beyond ±0.5 log10 copies/ml around the estimated levels of the steady state of viral loads for at least three times in a period of at least 3 months. Nine patients experienced this type of fluctuation and their viral load set points were not estimated. All these 27 patients failed to reach the steady state, resulting in being unable to estimate their viral load set points (two representative longitudinal viral load measurements in patients who failed to reach the steady state are shown in Fig. 2).
Fig. 2. Representative sequential viral load measurements in selected patients who failed to reach the steady state of viral replication within the first 8 months post-infection.
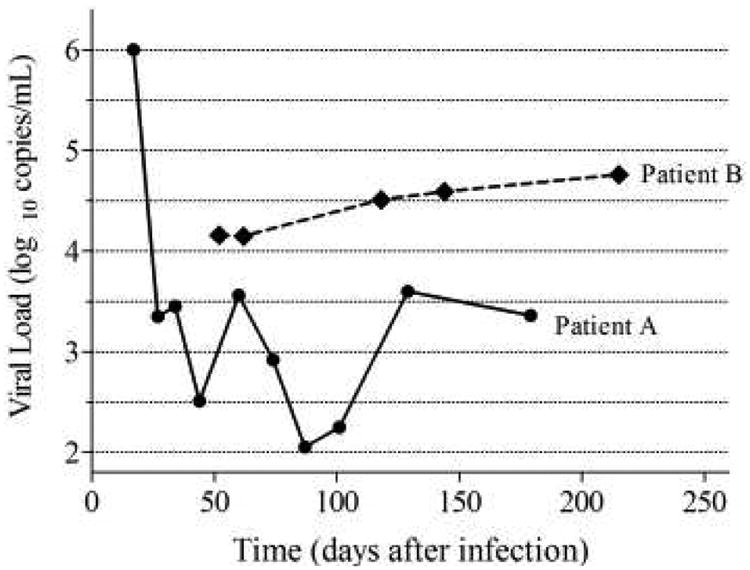
Viral loads measured from Patient A fluctuated between 2.05 and 3.6 log10 copies/ml from day 34 to 129 after infection, on four occasions, which was beyond the acceptable fluctuation range of ±0.5 log10 copies/ml against the estimated steady-state line. Viral loads measured from Patient B changed at a rate of 0.004 log10 copies/ml/day at day 52 post-infection, which was higher than 0.0027 log10 copies/ml/day.
Among the 60 remaining patients, 22 patients, grouped into Group I, had already reached the steady state at the first measurement post-infection (as shown in Fig.1f). Therefore, the time to steady state could not be estimated due to a lack of significant changes of all the observed viral loads for these patients. Then the rest 38 patients whose viral load set point could be estimated were grouped into Group II.
The results on the three kinds of outcome, i.e. being able to estimate both the viral load setpoint and the time to reach the setpoint, being able to estimate only the viral load setpoint, and failing to reach the steady state, are listed in Table 2.
Table 2. Numbers of patients with different kinds of predictive outcome (n).
| Patient Group | Predictive Outcome Ia | Predictive Outcome IIb | Predictive Outcome IIIc | Chi-square# | P-value |
|---|---|---|---|---|---|
| Group A (n=17) | 16 | 1 | 0 | ||
| Group B (n=25) | 22 | 2 | 1 | 72.8 | <0.0001 |
| Group C (n=45) | 0 | 19 | 26 | ||
|
| |||||
| Total | 38 | 22 | 27 | ||
Being able to estimate both the viral load setpoint and the time to reach the setpoint
Being able to estimate only the viral load setpoint
Failing to reach the steady state
Compare the proportions of Group A+B and Group C.
Estimate of viral load set points and the time to reach them
For the 60 patients who had achieved steady state, viral load set points were estimated as 4.28 ± 0.86 log10 copies/ml (range, 2.16–5.72 log10 copies/ml) by using our kinetic models. Viral load set points were estimated at the range of 2.73–5.55 log10 copies/ml (mean ± SD: 4.42 ± 0.80 log10 copies/ml) and 2.16–5.72 log10 copies/ml (mean ± SD: 4.19 ± 0.89 log10 copies/ml) for patients in Group I (n = 22) and Group II (n = 38), respectively. Sixty individuals were divided into three classes with differential progression by using our kinetic models. They are 18(30%), 29(48%) and 13(22%) that have viral load set point of <10,000, 10,000∼100,000 and >100,000copies/ml, respectively. Times to achieve the viral load set point for Group I patients were not calculated because their viral load had already reached the steady state at the first measurement post-infection. Times to viral load set point after infection for the 38 patients in Group II were estimated at the range of 21–119 days (mean ± SD: 63.8 ± 27.1 days) (Fig. 3). For the 38 patients in Group II whose time to viral load set point could be estimated, 7.9% (3/38, 95% CI: 2.7–20.8%), 50.0% (19/38, 95% CI: 34.9–65.1%), 18.4% (7/38, 95% CI: 9.2–33.4%) and 23.7% (9/38, 95% CI: 13.0–39.2%) of them have reached viral load steady state within 30 days, 31–60 days, 61–90 days and after 90 days, respectively. In other words, a patient had a 50% probability of reaching viral load set point between 31 and 60 days, and had a 76.3% probability of reaching viral load set point within 90 days.
Fig. 3. Time to the establishment of viral load set point varies among patients.
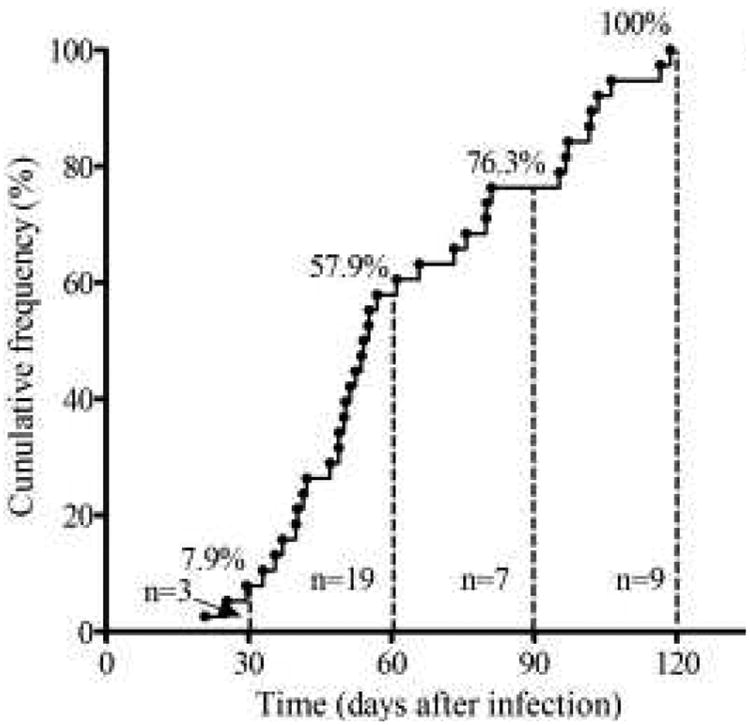
Dots represent the time to viral load set point for each patient. The cumulative frequency of patients whose viral load measurements reached the steady state at day 30, 60, 90 and 120 was 7.9%, 57.9%, 76.3% and 100%, respectively.
Agreement between viral load set points estimated by two different methods
To validate our new method, we compared its estimates with those of a published method [4]. For the 60 patients who had achieved the steady state, their viral load set points were estimated as 4.28 ± 0.86 log10 copies/ml (range, 2.16–5.72 log10 copies/ml) by using our kinetic models, compared to 4.25 ± 0.87 log10 copies/ml (range, 2.16–5.82 log10 copies/ml) by the empirical method published by others [4].Table 1 presents the absolute agreement assessment between our new model and the empirical method by addressing means as well as scale and location components of the CCC for each group. The bias correction factors for Group I and Group II and total were all very close to 1, meaning that the best-fit lines deviated very little from the perfect fit 45° line (measurement of accuracy) (Fig. 4a).
Table 1. Comparison of viral set points estimated by the proposed models and by the empirical method.
| Viral set point (mean±SD) | Agreement | ||||||
|---|---|---|---|---|---|---|---|
|
|
|
||||||
| N | Proposed method | Empirical method | CCCa (95% CI) | Location Shift | Scale Shift | Cbb | |
| Group I | 22 | 4.423±0.801 | 4.376±0.845 | 0.989 (0.977, 0.995) | 0.057 | 0.948 | 0.997 |
| Group II | 38 | 4.192±0.889 | 4.172±0.886 | 0.987 (0.976, 0.993) | 0.023 | 1.003 | 1.000 |
| Total | 60 | 4.277±0.858 | 4.247±0.870 | 0.988 (0.980, 0.993) | 0.035 | 0.986 | 0.999 |
CCC = Concordance Correlation Coefficient.
Cb= Bias correction factor.
Fig. 4. Linear correlation and good agreement in viral load set point levels estimated using two methods.
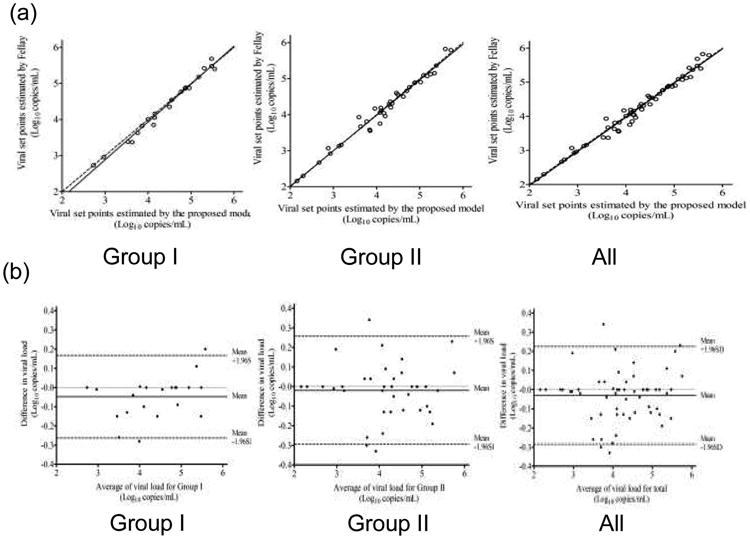
(a) Viral load set points determined with Fellay et al.'s method compared with those of our estimates with the concordance line (dashed 45° line) through the origin for patients in Group I, Group II and all patients. (b) Bland–Altman plots for the viral load set points for patients in Group I, Group II and all patients. Means of the estimate pairs are plotted against the differences between them.
The Bland–Altman plots that assess agreement between our new model and the empirical method are shown in Fig. 4b. About 90.9% (20/22), 92.1% (35/38) and 93.3% (56/60) of the differences between each pair of estimated viral load set points, lay within the 95% limits of agreement for Group I, Group II and total, respectively. No significant systematic bias was observed, i.e. the average differences between paired viral load set points were all close to zero.
Discussion
Our study described a novel model to estimate viral load set point in patients with acute HIV infection. It is general acknowledged that viral load set point is one of the key predictors for disease progression and prognosis of HIV-1 infection[12,21-23]. The concept has more recently be applied to gauge the efficacy of preventative HIV vaccine by comparing early post infection set points in cases of breakthrough infections in vaccines with set points in infected persons in the control arm of the studies [24]. Therefore, precise determination of the set point is important for the field. The current approach for estimating the viral load set point is to measure a series of viral loads at 4 month and later after the initial detection of infection, and then calculate their average level which is defined as the set point. This is acceptable since frequently the set point is reached after 4 months of HIV infection [3,5,17,25]. However, this method can only be used to obtain viral load set point level after the acute phase of HIV infection, which is an important window for viral reservoir formation and rapidity of HIV transmission. To date, there is no model available to estimate time to development of set points or predict distributions of VLs within the acute phase of HIV infection.
In this study, we presented a novel set of mathematical models to predict viral load set point early during the acute phase of HIV infection. There are a number of strengths of our data and models. First, to generate this model, we used a large series of viral load measurements that were collected as early as week 1 after acute infection when patients were still HIV antibody negative, but RNA positive. For each subject, all the viral load measurements were put into one or more mathematic models to estimate the viral load set point and the time to reach that set point. Second, for subjects who were already in the steady state at the time of the first test, the average of all the viral load measurements was considered as the set point, but the time to set point could not be estimated due to the lack of significant change of all the observed viral loads. Third, for those who had not reached the steady state at the first measurement but finally reached that state, viral load kinetics was used to estimate the set point and the time to reach it, as well as the peak and nadir of the viral load if present. Another advantage of our method is that the set point was estimated based on all observed viral loads. Thus, our approach is more systematic than the current used empirical method which only uses the viral loads at 4 month and later after the onset of infection to estimate the viral load set point [3, 5, 17].
To evaluate the validity of our new method, we compared results derived from our models and those that were obtained using the empirical method in our patient cohort. By using our method and that of Fellay et al [4], viral load set points were calculated to be 4.28 ± 0.86 and 4.25 ± 0.87 log10 copies/ml (P = 0.08), respectively. Consistency between the two methods was further tested by CCC measurement, which showed >95% in agreement. Additional tests with CCC on means, scales and location components of each group showed a bias correction factor very close to 1, which also indicates excellent agreement between the two methods. Moreover, we used Bland–Altman plots to compare these two set of viral load set points further, and again the results showed no significant systematic bias. Finally, viral load set points were estimated to be at 4.42 ± 0.80 and 4.19 ± 0.89 log10 copies/ml for subjects who were already in a steady state in the first test (Group I), and who had not reached a steady state during the first test (Group II), respectively. Both numbers are comparable to the results by using different methods reported in previous studies [19, 22, 26]. These results demonstrate that our novel method is as accurate and reliable as the existing methods.
Our new method has an additional advantage of being able to estimate the time to reach viral load set point after infection in each individual, whereas empirical methods [3, 5, 17] can only analyze a group of individuals. Furthermore, our method eliminates the influence of patient's failure to adhere to the scheduled follow-up visits during which critical viral load measurements are obtained to estimate the viral load set point. Lastly, the time to reach viral load set point was estimated to be between 21–119 days (63.8 ± 27.1 days) in the present study, which was earlier than the commonly accepted 120 days in primarily Caucasian patient cohort [6][27-29]. However, whether these results are attributable to different modeling methods or a reflection of different patient populations remains to be studied.
There are limitations to this study. The results were obtained from a relatively limited number of cases. Therefore, our models could benefit from additional verification in a larger prospective study of acute HIV-1 infection. Despite a lack of perfection, it would be interesting to apply our newly developed models to HIV vaccine study or therapeutic clinical trials.
In summary, we have demonstrated a novel approach to estimate viral load set point at the very early stage of HIV infection. Application of this method may help physicians to gain insight into early intervention strategies that prevent viral reservoir formation and viral transmission in acutely HIV-infected patients. Its application may also help scientists to more rationally design end-point measures for HIV vaccine trials.
Acknowledgments
This study was supported in part by Major Project of Beijing Municipal Science and Technology Committee (D09050703590901), the National 12th Five-Year Major Projects of China (2012ZX10001-003, 2012ZX10001-006), and Beijing Key Laboratory (BZ0089). Portions of this work were done under the auspices of the U.S. Department of Energy under contract DE-AC52-06NA25396 and supported by NIH grants AI028433, and RR006555 (ASP).
Work attributed to Beijing PRIMO Cohort Study Group
Study conception and design (Hao Wu and Xiaoning Xu). PRIMO Cohort follow-up and data collection (Xiaojie Huang). Screening test for HIV infection (Zhiying Liu, Feili Wei and Yunxia Ji). Data collection for HIV-1 negative MSM individuals (Tong Zhang, Haiying Li, Yan Fu and Wei Xia). Sample collection and storage (Huiping Yan, Xin Zhang and Weihua Li). Pooling HIV-1RNA test results (Yan Jiang, Hong Shang and PinLiang Pan). Establishing and validating mathematic models (Hui Chen and Xiaojie Huang). Drafting the manuscript (Hui Chen, Wei Li, Xia Jin and Alan Perelson).
Footnotes
All authors contributed to manuscript revisions and provided advice on data analysis and interpretation.
Conflicts of interest: None
Publisher's Disclaimer: This is a PDF file of an unedited manuscript that has been accepted for publication. As a service to our customers we are providing this early version of the manuscript. The manuscript will undergo copyediting, typesetting, and review of the resulting proof before it is published in its final citable form. Please note that during the production process errors may be discovered which could affect the content, and all legal disclaimers that apply to the journal pertain.
References
- 1.Henrard DR, Phillips JF, Muenz LR, Blattner WA, Wiesner D, Eyster E, et al. Natural History of HIV-1 Cell-Free Viremia. JAMA. 1995;274:554–558. [PubMed] [Google Scholar]
- 2.Ho DD. Viral Counts Count in HIV Infection. Science. 1998;272:1124–1125. doi: 10.1126/science.272.5265.1124. [DOI] [PubMed] [Google Scholar]
- 3.Mellors JW, Munoz A, Giorgi JV, Margolick JB, Tassoni CJ, Gupta P, et al. Plasma viral load and CD4+ lymphocytes as prognostic markers of HIV-1 infection. Annals of Internal Medicine. 1997;126(12):946–954. doi: 10.7326/0003-4819-126-12-199706150-00003. [DOI] [PubMed] [Google Scholar]
- 4.Fellay J, Shianna KV, Ge D, Colombo S, Ledergerber B, Weale M, et al. A whole-genome association study of major determinants for host control of HIV-1. Science. 2007;317(5840):944–947. doi: 10.1126/science.1143767. [DOI] [PMC free article] [PubMed] [Google Scholar]
- 5.Buchbinder Susan P, Mehrotra Devan V, Duerr Ann, Fitzgerald Daniel W, Robin Mogg MS, Li David, et al. Efficacy assessment of a cell-mediated immunity HIV-1 vaccine (the Step Study): a double-blind, randomised, placebo-controlled, test-of-concept trial. The Lancet. 2008;372(9653):1881–1893. doi: 10.1016/S0140-6736(08)61591-3. [DOI] [PMC free article] [PubMed] [Google Scholar]
- 6.Schacker T, Collier AC, Hughes J, Shea T, Corey L. Clinical and epidemiologic features of primary HIV infection. Annals of Internal Medicine. 1996;125(4):257–264. doi: 10.7326/0003-4819-125-4-199608150-00001. [DOI] [PubMed] [Google Scholar]
- 7.Pedersen C, Katzenstein T, Nielsen C, Lundgren JD, Gerstoft J. Prognostic value of serum HIV-RNA levels at virologic steady state after seroconversion: relation to CD4 cell count and clinical course of primary infection. J Acquir Immune Defic Syndr Hum Retrovirol. 1997;16:93–99. doi: 10.1097/00042560-199710010-00004. [DOI] [PubMed] [Google Scholar]
- 8.Lavreys Ludo, Baeten Jared M, Chohan Varsha, McClelland R Scott, Hassan Wisal M, Richardson Barbra A, et al. Higher Set Point Plasma Viral Load and More-Severe Acute HIV Type 1 (HIV-1) Illness Predict Mortality among High-Risk HIV-1–Infected African Women. Clinical Infectious Diseases. 2006;42:1333–39. doi: 10.1086/503258. [DOI] [PubMed] [Google Scholar]
- 9.Katzenstein TL, Pedersen C, Nielsen C, Lundgren JD, Jakobsen PH, Gerstoft J. Longitudinal serum HIV RNA quantification: Correlation to viral phenotype at seroconversion and clinical outcome. AIDS. 1996;10:167–173. doi: 10.1097/00002030-199602000-00006. [DOI] [PubMed] [Google Scholar]
- 10.Vidal C, Garcia F, Romeu J, Ruiz L, Miro JM, Cruceta A, et al. Lack of evidence of a stable viral load set-point in early stage asymptomatic patients with chronic HIV-1 infection. AIDS. 1998;12:1285–1289. doi: 10.1097/00002030-199811000-00009. [DOI] [PubMed] [Google Scholar]
- 11.O'Brien TR, Rosenberg PS, Yellin F, Goedert JJ. Longitudinal HIV-1 RNA Levels in a Cohort of Homosexual Men. J Acquir Immune Defic Syndr Hum Retrovirol. 1998;18(2):155–161. doi: 10.1097/00042560-199806010-00007. [DOI] [PubMed] [Google Scholar]
- 12.Hubert JB, Burgard M, Dussaix E, Tamalet C, Deveau C, Le Chenadec J, et al. the SEROCO Study Group. Natural history of serum HIV-1 RNA levels in 330 patients with a known date of seroconversion. AIDS. 2000;14:123–131. doi: 10.1097/00002030-200001280-00007. [DOI] [PubMed] [Google Scholar]
- 13.Lyles RH, Muñoz RH, Yamashita TE, Bazmi H, Detels R, Rinaldo CR, et al. for the Multicenter AIDS Cohort Study. Natural history of human immunodeficiency virus type 1 viremia after seroconversion and proximal to AIDS in a large cohort of homosexual men. The Journal of Infectious Diseases. 2000;181:872–880. doi: 10.1086/315339. [DOI] [PubMed] [Google Scholar]
- 14.Touloumi G, Pantazis N, Babiker AG, Walker SA, Katsarou O, Karafoulidou A, et al. on behalf of the CASCADE Collaboration. Differences in HIV RNA levels before the initiation of antiretroviral therapy among 1864 individuals with known HIV-1 seroconversion dates. AIDS. 2004;18:1697–1705. doi: 10.1097/01.aids.0000131395.14339.f5. [DOI] [PubMed] [Google Scholar]
- 15.Richardson BA, Mbori-Ngacha D, Lavreys L, John-Stewart GC, Nduati R, Panteleeff DD, et al. Comparison of human immunodeficiency virus type 1 viral loads in Kenyan women, men, and infants during primary and early infection. Journal of Virology. 2003;77(12):7120–7123. doi: 10.1128/JVI.77.12.7120-7123.2003. [DOI] [PMC free article] [PubMed] [Google Scholar]
- 16.Farzadegan H, Henrard DR, Kleeberger CA, Schrager L, Kirby AJ, Saah AJ, et al. Virologic and serologic markers of rapid progression to AIDS after HIV-1 seroconversion. J Acquir Immune Defic Syndr Hum Retrovirol. 1996;13:448–55. doi: 10.1097/00042560-199612150-00008. [DOI] [PubMed] [Google Scholar]
- 17.Sabin CA, Devereux H, Phillips AN, Hill A, Janossy G, Lee CA, et al. Course of viral load throughout HIV-1 infection. J Acquir Immune Defic Syndr Hum Retrovirol. 2000;23(2):172–177. doi: 10.1097/00126334-200002010-00009. [DOI] [PubMed] [Google Scholar]
- 18.Lin LIK. A concordance correlation coefficient to evaluate reproducibility. Biometrics. 1989;45:255–268. [PubMed] [Google Scholar]
- 19.Bland JM, Altman DG. Statistical methods for assessing agreement between two methods of clinical measurement. Lancet. 1986;i:307–310. [PubMed] [Google Scholar]
- 20.Bland JM, Altman DG. Measuring agreement in method comparison studies. Statistical Methods in Medical Research. 1999;8:135–160. doi: 10.1177/096228029900800204. [DOI] [PubMed] [Google Scholar]
- 21.O'Brien TR, Blattner WA, Waters D, Eyster M Elaine, Hilgartner Margaret W, Cohen Alan R, et al. Serum HIV-1 RNA levels and time to development of AIDS in the Multicenter Hemophilia Cohort Study. JAMA. 1996;276:105–10. [PubMed] [Google Scholar]
- 22.Mei Y, Wang L, Holte SE. A comparison of methods for determining HIV viral set point. Stat Med. 2008 Jan 15;27(1):121–39. doi: 10.1002/sim.3038. [DOI] [PubMed] [Google Scholar]
- 23.Schacker TW, Hughes JP, Shea T, Coombs RW, Corey L, et al. Biological and Virologic Characteristics of Primary HIV Infection. Ann Intern Med. 1998;128:613–20. doi: 10.7326/0003-4819-128-8-199804150-00001. [DOI] [PubMed] [Google Scholar]
- 24.Benlahrech A, Harris J, Meiser A, Papagatsias T, Julia Hornig, Peter Hayes, et al. Adenovirus vector vaccination induces expansion of memory CD4 T cells with a mucosal homing phenotype that are readily susceptible to HIV-1 infection. Proc Natl Acad Sci U S A. 2009;106(47):19940–5. doi: 10.1073/pnas.0907898106. [DOI] [PMC free article] [PubMed] [Google Scholar]
- 25.Geskus RB, Miedema FA, Goudsmit J, Reiss P, Schuitemaker H, Coutinho RA. Prediction of residual time to AIDS and death based on markers and cofactors. J Acquir Immune Defic Syndr Hum Retrovirol. 2003;32(5):514–521. doi: 10.1097/00126334-200304150-00008. [DOI] [PubMed] [Google Scholar]
- 26.Kaufmann GR, Cunningham P, Kelleher AD, Zaunders J, Carr A, Vizzard J, et al. Patterns of viral dynamics during primary human immunodeficiency virus type 1 infection. The Sydney Primary HIV Infection Study Group. The Journal of Infectious Diseases. 1998;178(6):1812–1815. doi: 10.1086/314480. [DOI] [PubMed] [Google Scholar]
- 27.Achhra Amit C, Zhou Jialun, Dabis Francois, Pujari Sanjay, Thiebaut Rodolphe, Law Matthew G, et al. Difference in Absolute CD4+ Count According to CD4 Percentage between Asian and White population HIV-Infected Patients. Journal of AIDS & Clinical Research. 2010;1(1):1–4. doi: 10.4172/2155-6113.1000101. [DOI] [PMC free article] [PubMed] [Google Scholar]
- 28.Bofill M, Janossy G, Lee CA, Macdonald-Burns D, Phillips AN, Sabin C, et al. Laboratory control values for CD4 and CD8 T lymphocytes. Implications for HIV-1 diagnosis. Clinical & Experimental Immunology. 1992;88:243–252. doi: 10.1111/j.1365-2249.1992.tb03068.x. [DOI] [PMC free article] [PubMed] [Google Scholar]
- 29.Chng WJ, Tan GB, Kuperan P. Establishment of adult peripheral blood lymphocyte subset reference range for an Asian population by single-platform flow cytometry: influence of age, sex, and race and comparison with other published studies. Clin Diagn Lab Immunol. 2004;11:168–173. doi: 10.1128/CDLI.11.1.168-173.2004. [DOI] [PMC free article] [PubMed] [Google Scholar]