Short abstract
The mechanical properties of human joints (i.e., impedance) are constantly modulated to precisely govern human interaction with the environment. The estimation of these properties requires the displacement of the joint from its intended motion and a subsequent analysis to determine the relationship between the imposed perturbation and the resultant joint torque. There has been much investigation into the estimation of upper-extremity joint impedance during dynamic activities, yet the estimation of ankle impedance during walking has remained a challenge. This estimation is important for understanding how the mechanical properties of the human ankle are modulated during locomotion, and how those properties can be replicated in artificial prostheses designed to restore natural movement control. Here, we introduce a mechatronic platform designed to address the challenge of estimating the stiffness component of ankle impedance during walking, where stiffness denotes the static component of impedance. The system consists of a single degree of freedom mechatronic platform that is capable of perturbing the ankle during the stance phase of walking and measuring the response torque. Additionally, we estimate the platform's intrinsic inertial impedance using parallel linear filters and present a set of methods for estimating the impedance of the ankle from walking data. The methods were validated by comparing the experimentally determined estimates for the stiffness of a prosthetic foot to those measured from an independent testing machine. The parallel filters accurately estimated the mechatronic platform's inertial impedance, accounting for 96% of the variance, when averaged across channels and trials. Furthermore, our measurement system was found to yield reliable estimates of stiffness, which had an average error of only 5.4% (standard deviation: 0.7%) when measured at three time points within the stance phase of locomotion, and compared to the independently determined stiffness values of the prosthetic foot. The mechatronic system and methods proposed in this study are capable of accurately estimating ankle stiffness during the foot-flat region of stance phase. Future work will focus on the implementation of this validated system in estimating human ankle impedance during the stance phase of walking.
Keywords: artificial organs and prostheses, biomechanics, design and control of biological systems
1. Introduction
The dynamic mechanical properties of human joints, collectively known as joint impedance, govern the relationship between joint torque and joint position [1–3]. These properties are modulated during dynamic tasks, such as reaching or ambulation. The modulation of these properties enables humans to interact seamlessly with their environment, naturally and efficiently completing complex dynamic tasks (i.e., picking up a glass of water or walking on uneven terrain). A thorough understanding of joint impedance during dynamic tasks has many significant implications including the quantification and understanding of impaired and unimpaired human motor control, the development of bio-inspired robotics, and the design of natural and efficient man-machine interfaces. Consistent with each of these applications is using knowledge of how the impedance of the human ankle varies during locomotion to design more effective powered ankle prosthesis control systems [4–7], a major effort of our research group.
Several previous studies have quantified the impedance of the elbow joint during dynamic tasks [8–11] and these investigations provide a framework for estimating ankle impedance during locomotion. Bennett et al. [9] used a custom air jet actuator [12] to apply a torque to the elbow joint while subjects alternated sinusoidally between two targets. Pseudorandom binary sequence perturbations were applied and a time varying identification technique was employed that subtracted a scaled intra-subject average angle and torque profile. This technique enabled the estimation of parameterized, time-varying values of impedance during the task. Furthermore, Popescu et al. [8] estimated the impedance of the elbow joint during goal directed movements. In their study, the elbow was perturbed by a custom robotic device that was centered on the elbow joint's center of rotation. A parametric model was used to estimate the impedance and the nonperturbed profiles were removed by subtracting a “nearest neighbor” approach, where the nonperturbed trial that most closely matched was subtracted from the perturbed trial. Similarly, Selen et al. [10] estimated elbow impedance using a custom robot that applied perturbations about the joint's center of rotation. The disturbance was a 5 nm assist-desist or desist-assist perturbation during elbow movement and the nonperturbed torque and angle profile that most closely resembled the perturbed trial (in the least-squares sense) was subtracted. Thus, the previous literature in estimation of joint impedance during dynamic activities consists of perturbations about the joint's center of rotation, and the nonperturbed torque and angle profiles are accounted for by subtraction of a mean or approximately equivalent trial.
There has been previous work estimating the time varying impedance of the ankle under nonstationary conditions, though not during locomotion. MacNeil et al. [13] estimated time varying impulse response functions while supine subjects rapidly changed ankle torque. This same technique also was used to estimate the time varying impedance of the ankle during an imposed movement [14]. Kirsch and Kearney estimated how ankle impedance varied during an imposed ramp displacement and determined that the low frequency impedance gain increased by 60% throughout the ramp displacement. These studies provide insight into how the ankle joint behaves when the operating point—conditions that describe the joint's state—is changing, as is the case during locomotion. Although this work is encouraging, there remains a gap in our understanding of how ankle impedance is modulated during locomotion—likely a result of the lack of the required perturbation devices and analytical methods.
The development of machines to mechanically interact with the ankle has spanned several fields, including biomedical system identification, reflex investigation and exoskeleton design [15–17]. Historically, ankle impedance identification studies employed electro/hydraulic actuators that were fixed to the ankle via a fiberglass cast [15]. The low inertia of these systems enabled high-frequency perturbations and reduced the transient torques that resulted from the acceleration. These devices provided high quality estimates that have been obtained for a wide array of ankle joint conditions [1]. Alternatively, studies estimating ankle impedance during standing have used platform devices [16,17] that have also provided estimates of ankle impedance. However, these previously developed devices are unable to estimate impedance during locomotion because they are either fixed rigidly to the ankle or are not able to be practically implemented in a locomotion paradigm.
Devices that are able to be used during locomotion were not designed to investigate ankle impedance estimation, and therefore may not be able to provide reliable estimates [18–21]. Andersen and Sinkjaer developed a bowden cable actuated orthosis [18] that provided a novel means to study the reflex response to perturbations. This design enabled significant torque to be applied to the ankle without requiring the subject to wear the actuators during the study. Similarly, Noel et al. designed an electrohydraulic orthosis device [19] that was able to apply ankle perturbations during locomotion via a hydraulic master-slave configuration, where the hydraulic pump could be located remotely and connected to the subject via a hydraulic hose. This device was equipped with a force sensor in series with the hydraulic slave that enabled it to behave with reduced impedance, as the controller attempted to minimize force on the series sensor during locomotion. Gordon et al. designed a powered orthosis using pneumatic (McKibben) actuators [22] that was capable of providing substantial torque during locomotion. This innovative device was used to test accommodation to applied torques during walking [23]. Lastly, a three degree of freedom robot developed by Roy et al. provided a method for robot aided ankle neurorehabilitation [21] and estimation of multidirectional ankle impedance [24]. However, all of the devices mentioned in this section span the ankle joint, causing the subject to wear the additional weight of the orthosis device on their ankle as they walk. Additionally, as a result of the device spanning the ankle joint, the subject's ankle impedance would be influenced by the intrinsic impedance of the device.
The purpose of this study was to propose and validate experimental and analytical methods for estimating the stiffness component of impedance of the human ankle during the foot-flat portion of stance phase walking, where stiffness denotes the static component of impedance. These methods included the design of a mechatronic platform to perturb the ankle, analysis for the removal of the platform's intrinsic impedance and the techniques used to estimate the ankle impedance during walking. The methods were validated by estimating the stiffness of a prosthetic foot and comparing those estimates to values obtained from an independent prosthetic foot testing machine. The overarching purpose of this study was to lay the foundation for future work estimating the ankle impedance during the stance phase of walking.
2. Methods
2.1. Design of the Mechatronic Platform.
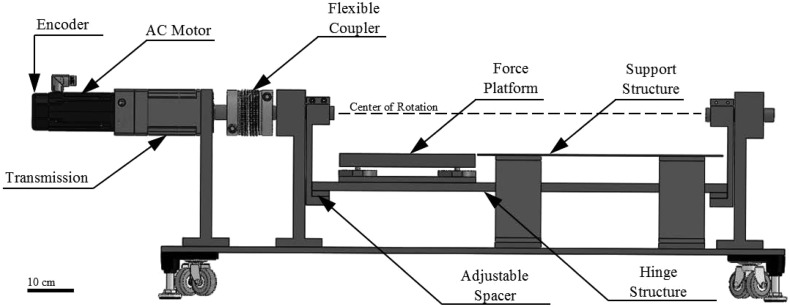
To estimate the impedance of the ankle during walking, the ankle joint must be perturbed from its intended trajectory and the resultant torque response must be measured. To this end, a single degree of freedom mechatronic platform was designed, termed the Perturberator Robot. The overarching platform-style design implementation was chosen such that the perturbation device was not in parallel with the ankle joint. Therefore, the ankle joint would not directly interact with the actuator control system or the platform's mechanical impedance (Fig. 1). To provide the perturbation, the angle of a hinge structure that included a portable force platform was actively controlled. The height of the center of rotation of the hinge structure could be adjusted vertically for each subject by the addition/removal of spacers. To increase the overall stiffness of the device, all components were machined out of AISI 1020 steel. The platform was designed to span an adjustable aluminum walkway to facilitate the application of the perturbation while subjects walked across the walkway.
Fig. 1.
Model of the Perturberator Robot with prominent design features highlighted
The drivetrain components were selected based on their ability to meet worst-case torque-velocity requirements during the perturbation (see Sec. 2.4.1). The worst-case scenario was defined as a perturbation that raised a 90 kg subject who stepped on the edge of the platform, creating the largest moment arm. Additionally, the requirements to accelerate the reflected inertias of the components involved were superimposed on the requirements to raise the subject, yielding the total torque-velocity demands from the perturbation.
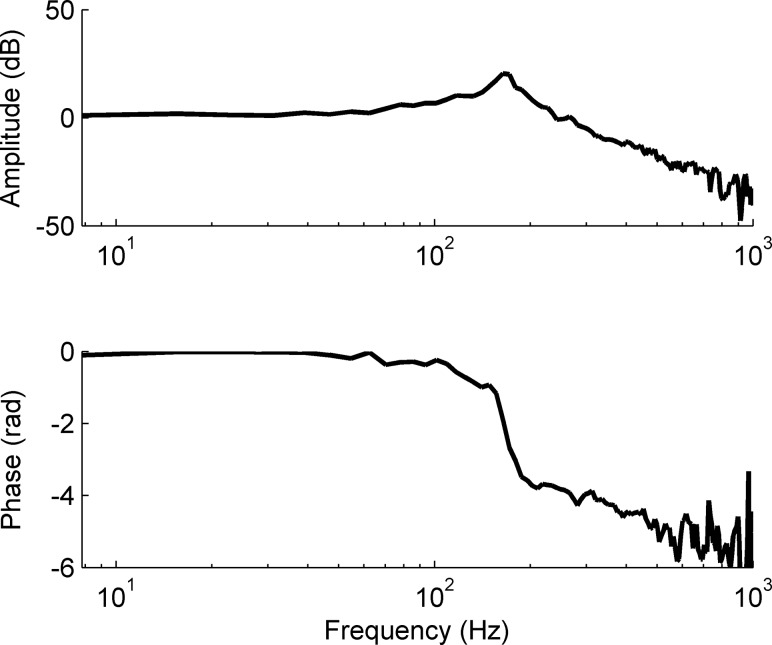
The angle of the hinge structure was actuated by a brushless ac motor (model: AKM-42 H, Kollmorgen, Radford, VA) with a rated power of 1.25 kW that met the design power requirements. The motor used a standard 120 V ac supply and was fused at 15 A. The motor output was augmented by a 70:1 transmission, resulting in an overall peak torque of 653 Nm. The transmission output was coupled to a flexible coupler (model: KM-400, GAM, Mount Prospect, IL), with a rated torque of 400 Nm. The coupler was chosen for its combination of low inertia, high rated torque and high torsional stiffness. The series torsional stiffness of the coupler and transmission was 12 nm/arc minute. The motor was controlled by a servodrive (model: AKD-B00606, Kollmorgen) that closed the position, velocity, and current loops with update rates of 8 kHz, 16 kHz, and 1.5 MHz, respectively. The closed loop transfer function was obtained by the servodrive's autotune process, using a small displacement pseudorandom binary sequence. In position control, the natural frequency of the servodrive closed loop response was approximately 200 Hz (Figs. 2 and 3) with a gain margin of 8 dB and phase margin of π/4 radians. The motor was equipped with a smart feedback device encoder with a resolution of 0.001 arc min. The servodrive had an analog output that corresponded to the position of the motor. This analog output signal, which had a resolution of 1 × 10⁻⁴ radians, was subsequently sampled by a 16-bit data acquisition system (model: USB-6218, National Instruments, Austin, TX) and used as part of the intrinsic inertial removal algorithm. The servodrive received a motion plan via step/direction inputs that were output from a master PIC32 microcontroller (Microchip, Chandler, AZ). The microcontroller specified position increments by varying the frequency of the pulse width modulation (PWM), where the frequency was proportional to motor velocity (20,000 steps/revolution). The frequency of the PWM was updated at a rate of 2.5 kHz.
Fig. 2.
Servodrive controller closed loop bode plot denoting the position bandwidth of the Perturberator Robot. Note the natural frequency at approximately 200 Hz.
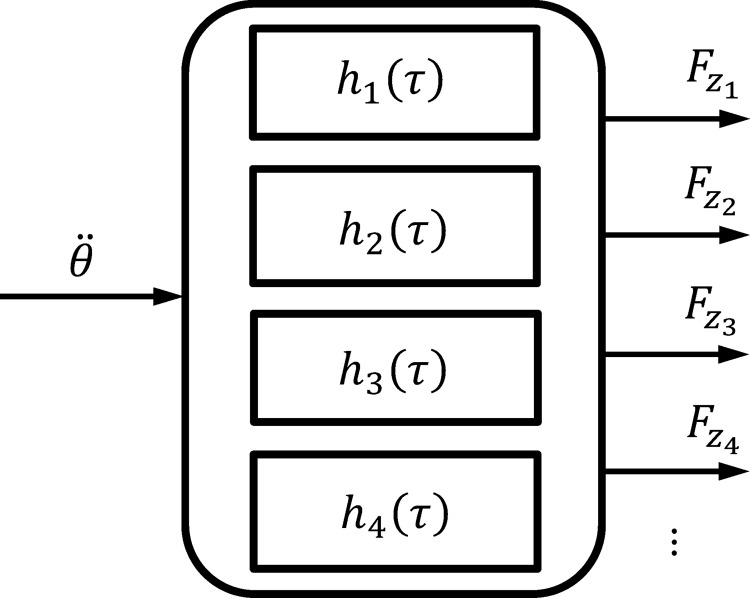
Fig. 3.
A series of parallel linear filters are shown mapping acceleration of the Perturberator Robot's motor angle to the forces from the force platform. Note, z-axis (vertical) force channels shown, but analysis used for all channels.
A portable force platform (model: 9260AA3, Kistler, Winterthur, Switzerland) was mounted to the hinge structure to record the ground reaction force data. The vertical axis natural frequency was approximately 300 Hz, and the two horizontal axes had a natural frequency of 500 Hz. The drift associated with the platform was approximately 10 mN/s. The force platform signals were acquired by the 16-bit data acquisition system.
2.2. Removal of Perturberator Robot's Intrinsic Impedance.
During each perturbation, the hinge structure of the Perturberator Robot was rotated, causing force transients on the embedded force platform. In order to obtain an accurate estimate of impedance, the forces resulting from the platform's intrinsic impedance needed to be removed, ideally isolating the forces from the subject alone.
A set of parallel nonparametric filters were used to map the acceleration of the Perturberator Robot's motor angle to the transient forces on each channel of the force platform Fig. 3. The force platform had four vertical axis sensors (one in each corner), and two horizontal sensors in each direction, for a total of eight force channels. The filters were assumed to be causal, with a length of 100 ms. A time domain correlation based approach was used for estimation. The filter length was chosen because it adequately captured the response dynamics of the forces.
With no subject present, the Perturberator Robot made a series of zero mean, pseudorandom perturbations sequences, consisting of approximately forty 0.035 rad ramp and hold perturbations. The perturbation ramp had a length of 75 ms followed by a 100 ms hold and a negative ramp to return the platform to the original position. Each perturbation was randomly chosen to be in either the dorsiflexion or plantarflexion direction and included a random time interval between each perturbation that varied between zero and two seconds. Five total trials were completed, each differing in the exact timing and directions of the perturbations, with an overall trial length of approximately 20 s The motor angle and force platform data were acquired from the 16-bit data acquisition system at a rate of 1 kHz and were subsequently low-pass filtered using a bidirectional fourth order Butterworth filter with a cutoff frequency of 20 Hz. The correlation based approach was used to estimate a single set of filters [2] from one of the trials. To quantify the performance of the filters, they were used to estimate the force profiles in each channel for the remaining four trials. The estimated force profiles were compared to the experimentally acquired force data for all channels and variance accounted for (VAF) was used to quantify the performance of the filters.
2.3. Estimation of Prosthetic Foot Stiffness in Testing Machine.
The stiffness of a prosthetic foot was estimated to have an independent, an accurate measure with which to compare the stiffness values estimated during walking. The prosthetic foot was chosen as a validation tool because the magnitude of the stiffness is likely to be similar to that of the human ankle during walking and it avoided the complications associated with studying a physiological system.
The stiffness component of impedance was measured in a servo-hydraulic prosthetic foot testing machine used to apply periodic vertical loads to the prosthetic foot. The system consisted of a high-capacity frame with an Instron 8800 controller (Norwood, MA), WaveMatrix acquisition software and a single axis load cell (model: 3170-101, MTS, Eden Prairie, MN), calibrated onsite by an Instron representative. The machine conformed to ISO 10,328 standards for prosthetic forefoot loading and was chosen because of its ability to apply precise displacements while synchronously measuring resultant forces. The right prosthetic foot (model: SLF165-22-R-H7, Trulife, Poulsbo, WA) was secured in the testing machine with the long axis of the foot perpendicular to the hydraulic actuator's direction of deflection. Five trials were collected while the foot was deflected 1.5 cm over 10 s. A spacer was added between the foot and the actuator to prevent deflection of the foam foot shell. Measurements of the setup geometry were used to convert to angular displacement and torque. The location of the actuator was varied to provide measurements of stiffness as a function of the force location beneath the foot (this is analogous to the location of the center of pressure during locomotion). Three actuator placement distances were tested that spanned the bottom of the foot, ranging from approximately 6 cm to 11 cm from the foot's “center of rotation” (i.e., the axis that was specified about which the torque estimates were determined). Linear regression was used to determine a single stiffness value for each actuator location.
2.4. Estimation of Impedance During Walking
2.4.1. Experimental Protocol.
The Perturberator Robot was recessed into an aluminum walkway 5.25 m in total length. A subject wore custom modified Aircast (Vista, CA) pneumatic walking braces with the same Trulife prosthetic feet mounted below the braces. Ideally, these braces held the ankle joint rigid and permitted the subject to walk with the prosthetic feet. The subject was given ample time to become comfortable walking on the prosthetic feet and wore a safety harness that was secured to an overhead gantry. The subjects gave written informed consent and the experiment was approved by the Northwestern University Institutional Review Board.
During each trial the subject walked across the entire walkway, stepping the right prosthetic foot onto the Perturberator Robot's force platform. The starting position of the subject was adjusted such when the subject stepped on the force platform, the foot was aligned with the platform's center of rotation. Previous work has shown that stiffness estimates are relatively insensitive to foot placement on the Perturberator Robot [25]. On half of the trials, a 0.035 rad ramp perturbation was randomly applied to ankle joint. The perturbation ramp had a length of 75 ms and was in either the dorsiflexion or plantarflexion, chosen with equal probability. Only the dorsiflexive perturbations were included in the analysis to ensure there was no error from the foot separating from the platform as a result of the solid prosthetic ankle, however both directions were included in the experiments to prevent accommodation. Four points in stance phase were investigated that corresponded to 100, 225, 350, 475 ms following heel contact. The exact perturbation onset was determined by a counter on the microcontroller program that was triggered by a vertical threshold force of 25 N (e.g., counter to 100 ms for the first perturbation timing point). Slight differences in the loading translated to disparities in the exact timing to trigger the embedded counter. These differences caused variability in the perturbation onset timing. The standard deviations of the timing point onset distributions were 3.3 ms, 3.2 ms, 4.2, and 5.2 ms, corresponding to increasing perturbation timing point; thus perturbation triggering occurred within approximately 2% of the intended onset time. The points investigated correspond to a specific location of the center of pressure (analogous to the actuator distance previously described), and were chosen to span the region where the foot is in full contact with the ground (i.e., post foot-flat and pre heel-rise). One hundred trials were recorded at each point in stance phase and approximately 400 trials were recorded when no perturbation occurred. Following the completion of 40 perturbation trials, the subject was encouraged to rest. The data acquired included force platform information, perturberator motor angle, and prosthetic ankle angle obtained from an electrogoniometer (model: S700 Shapesensor, Delsys, Boston, MA). The electrogoniometer was previously calibrated using a protractor as an independent angle measure (sensitivity: 1.05 rad/V, with 95% confidence interval: ±0.09 rad/V). A custom small displacement (0.09 rads) test for precision was completed by the manufacturer to estimate the random error that may occur during a perturbation; the precision of the sensor was 2.6 × 10⁻³ radians for small displacements and 8.7 × 10⁻³ radians at full scale displacements.
2.4.2. Data Analysis.
All data were low pass filtered with a bi-directional fourth order Butterworth filter with a cutoff frequency of 20 Hz and segmented to include 100 ms beginning with the ramp perturbation. The forces caused by the platform's intrinsic impedance were removed using the parallel filter method described above. Following the subtraction of the forces, the remaining forces were attributed to the impedance of the prosthetic foot. The ankle torque was calculated by resolving the ground reaction force in the sagittal plane to the equivalent force-torque at the ankle's center of rotation (Fig. 4).
Fig. 4.
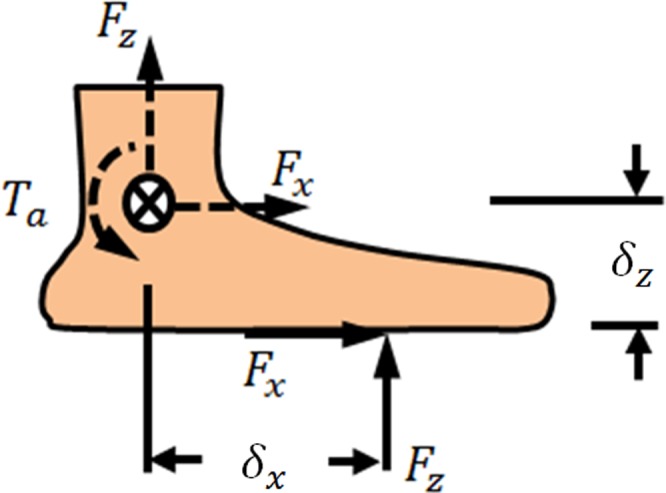
Diagram showing ground reaction forces acting on the foot (solid). The resultant (dashed) ankle torque, Ta, is computed by multiplying the ground reaction force components by their respective perpendicular distances.
where Ta is the resultant torque about the ankle and Fz is the vertical component of the ground reaction force and Fx is the anterior-posterior component of the ground reaction force; δz is the vertical location of the center of pressure and δx is the anterior-posterior location of the center of pressure, both with respect to the ankle's center of rotation. In this study, the δx value was determined from the instantaneous force platform measurements and the δz was measured prior to the analysis and assumed to be constant. Dorsiflexion was specified as the positive angular direction and the angle of the ankle was zeroed upon heel contact. Ankle torques determine in this manner have been shown to have negligible differences when compared to inverse dynamics analysis [26]. The center of pressure data was zeroed upon heel contact and transformed into the foot's coordinate system by subtracting the distance from the center of rotation of the ankle to the location of heel strike. This distance was determined by measurements of the prosthetic foot and was the identical location of the axis that was used as the center of rotation during the testing machine measurements. In other words, the axis at which the moments were calculated was identical for both the walking analysis and the testing machine analysis.
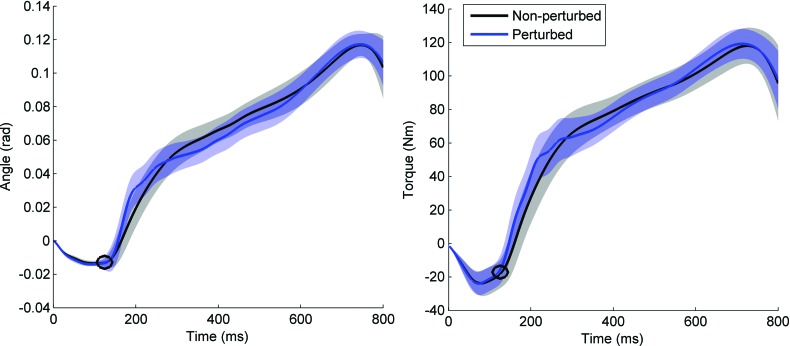
The estimation of ankle impedance depended on the isolation of the perturbation angle and torque response. That is, the torque and angle profiles that occurred naturally as a result of walking needed to be removed (Fig. 5). This removal was accomplished by subtracting the average unperturbed torque and angle profiles from the average of perturbed trials. In order to accurately estimate the variability of these data, a bootstrapping technique was used. A random selection of the angle and torque profiles from 60% of the perturbed trials for a specific timing point and perturbation direction were selected and averaged together. From these averaged angle and torque profiles, the average nonperturbed angle and torque profile was subtracted. The resultant angle and torque profiles had any offset removed such that both began with zero. This technique was repeated 100 times for each timing point and the resultant angle and torque, each time differing in the specific perturbation trials included in the averaging. The resultant profiles were then used to obtain estimates of impedance.
Fig. 5.
Prosthetic ankle angle (a) and ankle torque (b) shown during stance phase, beginning with heel contact. The nonperturbed trials are shown in black and the perturbed trials are shown in blue with the average shown in bold and the standard deviation in translucent. The circle denotes the onset of the perturbation.
Following the determination of the torque and angle response to the perturbation, a second order model was used to represent the impedance of the prosthetic ankle
where Tp represents the torque about the ankle in response to the perturbation, I tot is the inertia of the prosthetic foot and other coupled body segments, ba and ka are the damping and stiffness components of impedance respectively; and finally, θp is the angular perturbation; it is time derivatives were computed numerically in MATLAB (The Mathworks, Natick, MA). The derivatives were approximated by fitting a second order polynomial to four points surrounding each time point, and the polynomial coefficient was used to quantify the derivative [27]. The impedance parameters were estimated using linear regression over the 100 ms window. VAF was used to quantify the agreement between the model predicted ankle torque responses and experimental results.
3. Results
3.1. Removal of Perturberator Robot's Intrinsic Impedance.
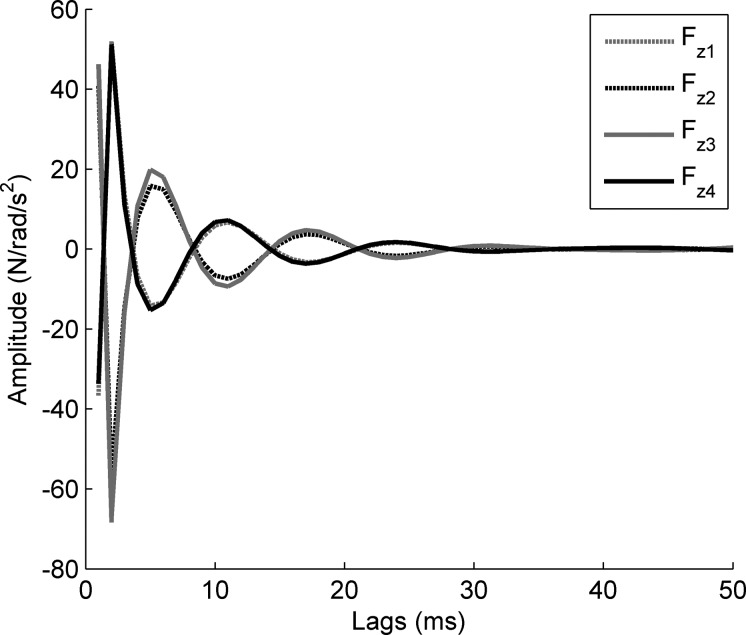
To remove the transient forces that resulted from the Perturberator Robot's intrinsic impedance, a set of parallel filters were estimated (Fig. 6). The estimated filters accurately described the dynamics accounting for 96% (standard deviation: 3%) of the variance of the forces, when averaged across channels and trials. The filters began with an initial impulse and decayed at the mechanical resonant frequency of the platform.
Fig. 6.
Estimated filters shown for vertical (z) axis channels. Note, the initial impulse, denoting the dominant feature of the dynamics is the robot's inertia.
3.2. Comparison of Prosthetic Foot Stiffness Values Measured From the Testing Machine and During Walking.
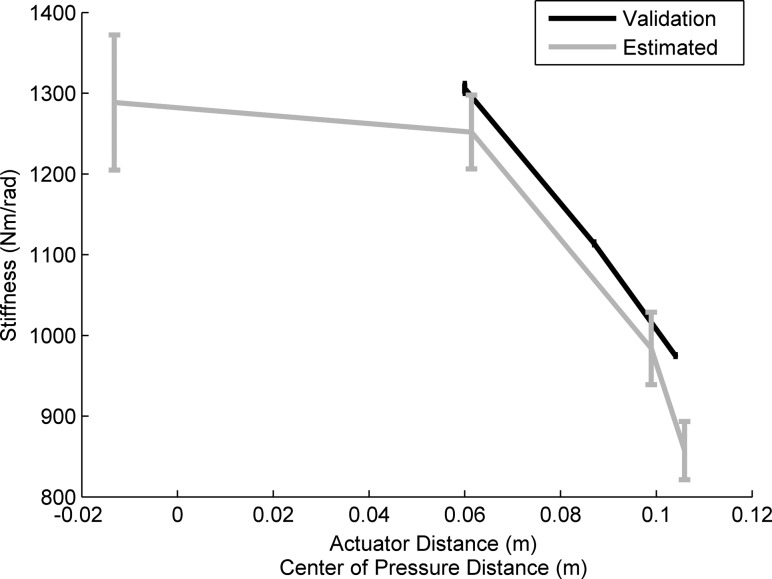
When stiffness was determined using the prosthetic foot testing machine, the linear regression model provided an accurate description, with an average coefficient of determination of 0.96 (standard deviation: 0.05). The stiffness of the prosthetic foot decreased linearly from 1300 Nm/rad to 975 Nm/rad as the distance of the actuator was varied from 6 cm to 11 cm.
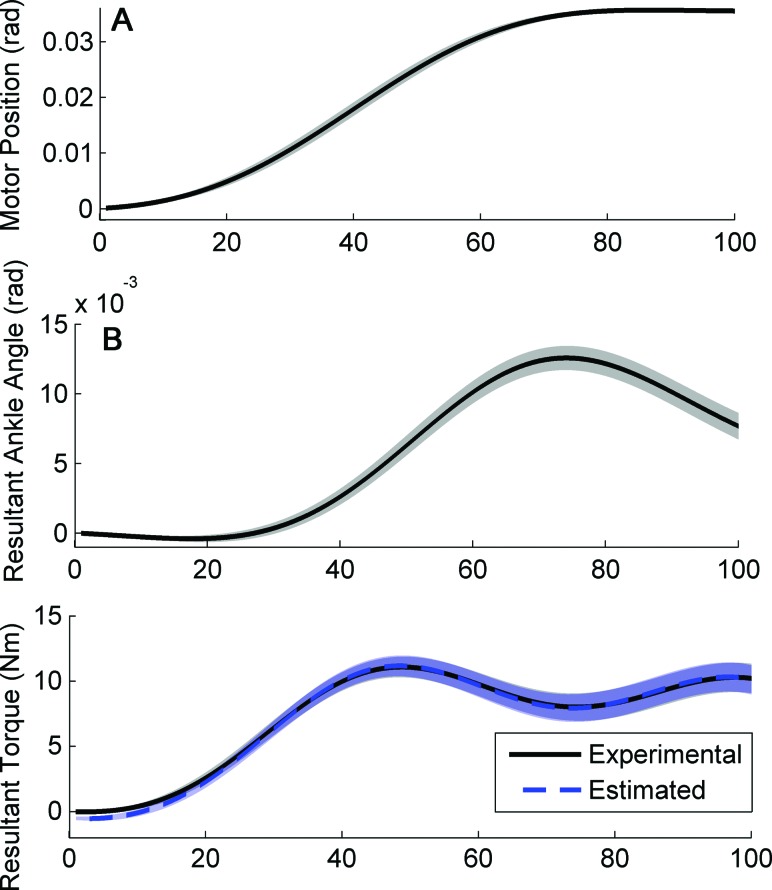
Similarly, when estimated using the Perturberator Robot, the impedance model accurately described the dynamics, on average accounting for 99.1% of variance (standard deviation across timing points: 0.7) (Fig. 7(b)). The estimated stiffness component of impedance ranged from 1277 Nm/rad to 860 Nm/rad, and was found to vary as a function of the location of the center of pressure (Fig. 8). The length of the timing analysis window was varied to 75 ms and 125 ms investigate the sensitivity of this parameter to the stiffness estimates. When varied, the average difference in stiffness values was found to be 5% and 1% (standard deviation: 0.7% and 0.6%) for the 75 ms and 125 ms windows, respectively.
Fig. 7.
Means are shown in bold with standard deviations in translucent. (a) Perturberator Robot's motor angle as a function of time, showing the 0.035 rad ramp perturbation with 75 ms ramp length and 25 ms hold. (b) resultant ankle angle and torque as a function of time, during the 100 ms analysis window. The model estimated torque profiles are also shown. Signals shown have been filtered by a bi-directional low-pass filter, with a cutoff frequency of 20 Hz.
Fig. 8.
Experimentally determined prosthetic foot stiffness plotted as a function of actuator distance (black) and the stiffness values estimated during walking (gray). Error bars denote standard deviation and perturbations were in the dorsiflexion direction.
The prosthetic foot stiffness estimates determined by the Perturberator Robot and associated methods were similar to values measured from the independent testing machine. Using linear interpolation, the estimates were compared to the independently measured stiffness values and the appropriate values of actuator distance/center of pressure. The percent error in the estimated values ranged from 3.6% to 8.4%, with an average error of 5.4% and a standard deviation of 0.7%, when compared during the three greatest actuator distances.
Although the estimated inertia was not compared to a benchmark, it was observed to be relatively invariant across perturbation timing points. The average inertia value was 0.30 kgm2 with a standard deviation of 0.016 kgm2, varying by less than 12% across all perturbation timing points.
4. Discussion
The purpose of this study was to present the development of a mechatronic device that was designed to perturb the ankle during walking. Furthermore, methods were presented for (1) the removal of forces caused by the platform's intrinsic impedance and (2) the estimation of ankle impedance during the stance phase of walking. The methods were validated using a prosthetic foot, and the estimated stiffness was compared to stiffness values obtained from an independent testing machine. Overall, the methods presented in this study provide an accurate (within 5%) estimation of ankle stiffness during the foot-flat portion of the stance phase of walking.
The estimated parallel filters accurately predicted the forces during the perturbation when no subject was present, and should be incorporated into the analysis methods. The filters had substantial values at zero lags (Fig. 6) which was representative of the inertial forces that are directly proportional to acceleration. During the subsequent lags (<30 lags), slight ringing was observed that was associated with the platform's mechanical natural frequency. Given the accurate representation of the forces, future analyses with the Perturberator Robot should subtract the forces from the parallel filters from the force data recorded during experimental trials. This removal by subtraction is permissible because the Perturberator Robot's interaction with the ankle joint is not in parallel with the system being identified.
The proposed methods for estimating ankle impedance during walking accurately predicted the stiffness component of impedance during the region of stance phase tested. When the estimated stiffness values were compared to those obtained from the testing machine, there was an average of 5% error. The proposed methods consistently underestimated the stiffness of the prosthetic foot, possibly a result of the compliance of the foam foot shell or the nonrigid connection from the pneumatic walking braces. Additionally, the error could result from the misalignment of the prosthetic ankle with respect to the center of rotation of the Perturberator Robot. Across all the trials, the average deviation in the center of rotation of the prosthetic foot from the center of rotation of the Perturberator Robot was 1.6 cm. This error has been previously shown to contribute as much as 6% error per cm, which could translate to up to 9.6% error [25].
The timing points chosen in this study correspond to the portions of stance phase when the foot is flat on the ground and the methods are not valid outside of this region. The vertical distance between the center of pressure and the ankle center of rotation was specified as a constant, limiting the methods to this specific region of stance phase. Furthermore, beyond this region, there could be deformations in other joints of the ankle-foot complex (e.g., tarsometatarsal joint) that would introduce error into the simple biomechanical ankle model used. Thus, the methods are valid within the portion of stance phase that includes the foot flat on the ground, and future work can focus on validations beyond this region.
The bootstrapping method used in this study provides a more robust estimate of the variance of ankle stiffness values at each point in stance phase, at the expense of averaging out the inter-trial variability. By averaging perturbation trials and removing the average nonperturbed trials, the average torque and angle response to the perturbation were obtained. As a result, low variance and high accuracy was achieved, but no information can be provided regarding how impedance is modulated between trials. An alternate method would be the removal of a “similar” nonperturbed trial, however, as a result of the length of the analysis window (100 ms), it was unclear that the similarities would remain consistent. This provides an interesting avenue for future research.
The difference between the solid ankle joint of the prosthetic foot and the “hingelike” geometry of the human ankle joint is not expected to impact the validity of the stiffness estimates. The measured forces (from the force platform or testing machine) were converted to the equivalent force/torque couple about a location specified to be the ankle's center of rotation (Fig. 4)—this step is not strictly necessary. An equivalent validation would be obtained using linear stiffness at each distance, independent of a center of rotation (assumed or actual). However, error in the measurement of the location of the center of rotation would have an effect, and it can be quantified as a percentage of the vector length from heel strike to the ankle's center of rotation. An error of 1 mm in length discrepancy translates to torque errors of approximately 1.1%. Thus, the specific location of the center of rotation used is arbitrary, assuming it is equivalent in both analyses; and error in vector measurement has an effect on torque calculations, approximately 1.1% per mm.
The relatively invariant values of the estimated parameters strengthen the quality of the analysis. The average inertia values were shown to vary by less than 12% across timing points. This supports quality estimates, as the true inertia value remains constant throughout stance phase. The inertia is difficult to quantify, since the prosthetic foot was flexing and was coupled to other body segments. Additionally, the stiffness estimates were insensitive to the length of the analysis window used. When the length of the window was increased and decreased by 25%, the estimates varied by only 1% and 5%. These properties add strength to the quality of the validation.
The prosthetic foot and walking experiment were chosen as a validation paradigm because of their similarities in mechanical properties and protocol, respectively. The stiffness of the prosthetic foot is comparable to the stiffness of the human ankle, when previously tested across position and activation levels while subjects were laying supine [28]. Therefore, the stiffness of the prosthetic foot accurately conveys the overall signal-to-noise ratio of the torque that resulted from the position perturbation. Additionally, testing during a walking protocol (as opposed to estimating a static mechanical system) was not only chosen because it represents the future task but also because any error associated with the nonmechanically fixed shank could be assessed. That is, typical estimates of ankle impedance are made while the shank is secured, reducing any “closed-loop” effects of the torque. However, during walking, this is not possible and the effect of the additional closed-loop torques is minimal.
Acknowledgment
This work was supported by the U.S. Army Telemedicine and Advanced Technology Research Center (TATRC) under award W81XWH-09-2-0020; award number F31NS074687 from the National Institute of Neurological Disorders and Stroke; and award number T32HD007318 from the National Institute of Child Health and Human Development. The authors wish to thank Mariah Whitmore for her assistance in collecting portions of the data included in this manuscript and Seeni Komolafe for his assistance with data collection at the Northwestern University Prosthetics and Orthotics Center.
Contributor Information
Elliott J. Rouse, Department of Biomedical Engineering, Northwestern University, 2145 Sheridan Road, Room E310, Evanston, IL 60208; Center for Bionic Medicine, Rehabilitation Institute of Chicago, 345 East Superior Street, Room 1309, Chicago, IL 60611, e-mail: erouse@media.mit.edu
Levi J. Hargrove, Center for Bionic Medicine, Rehabilitation Institute of Chicago, 345 East Superior Street, Room 1309, Chicago, IL 60611; Department of Physical Medicine and Rehabilitation, Northwestern University, 710 North Lake Shore Drive, Chicago, IL 60611, e-mail: l-hargrove@northwestern.edu
Eric J. Perreault, Department of Biomedical Engineering, Northwestern University, 2145 Sheridan Road, Room E310, Evanston, IL 60208; Sensory Motor Performance Program, Rehabilitation Institute of Chicago, 345 East Superior Street, Room 1396, Chicago, IL 60611, e-mail: e-perreault@northwestern.edu
Michael A. Peshkin, Department of Mechanical Engineering, Northwestern University, 2145 Sheridan Road, Room B224, Evanston, IL 60208, e-mail: peshkin@northwestern.edu
Todd A. Kuiken, Department of Biomedical Engineering, Northwestern University, 2145 Sheridan Road, Room E310, Evanston, IL 60208; Center for Bionic Medicine, Rehabilitation Institute of Chicago, 345 East Superior Street, Room 1309, Chicago, IL 60611; and, Department of Physical Medicine and Rehabilitation, Northwestern University, 710 North Lake Shore Drive, Chicago, IL 60611, e-mail: tkuiken@northwestern.edu
References
- [1]. Kearney, R. E. , and Hunter, I. W. , 1990, “System Identification of Human Joint Dynamics,” Crit. Rev. Biomed. Eng., 18(1), pp. 55–87. [PubMed] [Google Scholar]
- [2]. Perreault, E. J. , Kirsch, R. F. , and Acosta, A. M. , 1999, “Multiple-Input, Multiple-Output System Identification for Characterization of Limb Stiffness Dynamics,” Biol. Cybern., 80(5), pp. 327–337. 10.1007/s004220050529 [DOI] [PubMed] [Google Scholar]
- [3]. Perreault, E. J. , Kirsch, R. F. , and Crago, P. E. , 2004, “Multijoint Dynamics and Postural Stability of the Human Arm,” Exp. Brain Res., 157(4), pp. 507–517. 10.1007/s00221-004-1864-7 [DOI] [PubMed] [Google Scholar]
- [4]. Au, S. , and Herr, H. , 2008, “On the Design of a Powered Ankle-Foot Prosthesis. The Importance of Series and Parallel Motor Elasticity,” IEEE Rob. Autom. Mag., 15(3), pp. 52–59. 10.1109/MRA.2008.927697 [DOI] [Google Scholar]
- [5]. Au, S. K. , Weber, J. , and Herr, H. , 2007, “Biomechanical Design of a Powered Ankle-Foot Prosthesis,” Proceedings of 2007 IEEE 10th International Conference on Rehabilitation Robotics, pp. 298–303. [Google Scholar]
- [6]. Sup, F. , Bohara, A. , and Goldfarb, M. , 2008, “Design and Control of a Powered Transfemoral Prosthesis,” Int. J. Robot. Res., 27(2), pp. 263–273. 10.1177/0278364907084588 [DOI] [PMC free article] [PubMed] [Google Scholar]
- [7]. Hitt, J. K. , Sugar, T. G. , Holgate, M. , and Bellman, R. , 2010, “An Active Foot-Ankle Prosthesis With Biomechanical Energy Regeneration,” J. Med. Devices, 4, p. 011003. 10.1115/1.4001139 [DOI] [Google Scholar]
- [8]. Popescu, F. , Hidler, J. M. , and Rymer, W. Z. , 2003, “Elbow Impedance During Goal-Directed Movements,” Exp. Brain Res., 152(1), pp. 17–28. 10.1007/s00221-003-1507-4 [DOI] [PubMed] [Google Scholar]
- [9]. Bennett, D. , Hollerbach, J. , Xu, Y. , and Hunter, I. , 1992, “Time-Varying Stiffness of Human Elbow Joint During Cyclic Voluntary Movement,” Exp. Brain Res., 88(2), pp. 433–442. 10.1007/BF02259118 [DOI] [PubMed] [Google Scholar]
- [10]. Selen, L. P. , Beek, P. J. , and Van Dieen, J. H. , 2006, “Impedance is Modulated to Meet Accuracy Demands During Goal-Directed Arm Movements,” Exp. Brain Res., 172(1), pp. 129–138. 10.1007/s00221-005-0320-7 [DOI] [PubMed] [Google Scholar]
- [11]. Gomi, H. , and Kawato, M. , 1997, “Human Arm Stiffness and Equilibrium-Point Trajectory During Multi-Joint Movement,” Biol. Cybern., 76(3), pp. 163–171. 10.1007/s004220050329 [DOI] [PubMed] [Google Scholar]
- [12]. Xu, Y. , Hunter, I. W. , Hollerbach, J. M. , and Bennett, D. J. , 1991, “An Airjet Actuator System for Identification of the Human Arm Joint Mechanical Properties,” IEEE Trans. Biomed. Eng., 38(11), pp. 1111–1122. 10.1109/10.99075 [DOI] [PubMed] [Google Scholar]
- [13]. Macneil, J. B. , Kearney, R. , and Hunter, I. , 1992, “Identification of Time-Varying Biological Systems From Ensemble Data (Joint Dynamics Application),” IEEE Trans. Biomed. Eng., 39(12), pp. 1213–1225. 10.1109/10.184697 [DOI] [PubMed] [Google Scholar]
- [14]. Kirsch, R. F. , and Kearney, R. E. , 1997, “Identification of Time-Varying Stiffness Dynamics of the Human Ankle Joint During an Imposed Movement,” Exp. Brain Res., 114(1), pp. 71–85. 10.1007/PL00005625 [DOI] [PubMed] [Google Scholar]
- [15]. Morier, R. , Weiss, P. , and Kearney, R. , 1990, “Low Inertia, Rigid Limb Fixation Using Glass Fibre Casting Bandage,” Med. Biol. Eng. Comput., 28(1), pp. 96–99. 10.1007/BF02441686 [DOI] [PubMed] [Google Scholar]
- [16]. Loram, I. D. , and Lakie, M. , 2002, “Direct Measurement of Human Ankle Stiffness During Quiet Standing: The Intrinsic Mechanical Stiffness is Insufficient for Stability,” J. Physiol., 545(3), pp. 1041–1053. 10.1113/jphysiol.2002.025049 [DOI] [PMC free article] [PubMed] [Google Scholar]
- [17]. Casadio, M. , Morasso, P. G. , and Sanguineti, V . , 2005, “Direct Measurement of Ankle Stiffness During Quiet Standing: Implications for Control Modelling and Clinical Application,” Gait and Posture, 21(4), pp. 410–424. 10.1016/j.gaitpost.2004.05.005 [DOI] [PubMed] [Google Scholar]
- [18]. Andersen, J. B. , and Sinkjaer, T. , 1995, “An Actuator System for Investigating Electrophysiological and Biomechanical Features Around the Human Ankle Joint During Gait,” IEEE Trans. Rehabil. Eng., 3(4), pp. 299–306. 10.1109/86.481969 [DOI] [Google Scholar]
- [19]. Noel, M. , Fortin, K. , and Bouyer, L. J. , 2009, “Using an Electrohydraulic Ankle Foot Orthosis to Study Modifications in Feedforward Control During Locomotor Adaptation to Force Fields Applied in Stance,” J. Neuroeng. Rehabil., 6(1), p. 16. 10.1186/1743-0003-6-16 [DOI] [PMC free article] [PubMed] [Google Scholar]
- [20]. Gordon, K. E. , and Ferris, D. P. , 2007, “Learning to Walk With a Robotic Ankle Exoskeleton,” J. Biomech., 40(12), pp. 2636–2644. 10.1016/j.jbiomech.2006.12.006 [DOI] [PubMed] [Google Scholar]
- [21]. Roy, A. , Krebs, H. I. , Williams, D. J. , Bever, C. T. , Forrester, L. W. , Macko, R. F. , and Hogan, N. , 2009, “Robot-Aided Neurorehabilitation: A Novel Robot for Ankle Rehabilitation,” IEEE Trans. Robotics, 25(3), pp. 569–582. 10.1109/TRO.2009.2019783 [DOI] [Google Scholar]
- [22]. Gordon, K. E. , Sawicki, G. S. , and Ferris, D. P. , 2006, “Mechanical Performance of Artificial Pneumatic Muscles to Power an Ankle-Foot Orthosis,” J. Biomech., 39(10), pp. 1832–1841. 10.1016/j.jbiomech.2005.05.018 [DOI] [PubMed] [Google Scholar]
- [23]. Cain, S. , Gordon, K. , and Ferris, D. , 2007, “Locomotor Adaptation to a Powered Ankle-Foot Orthosis Depends on Control Method,” J. Neuroengineering Rehabil., 4(1), p. 48. 10.1186/1743-0003-4-48 [DOI] [PMC free article] [PubMed] [Google Scholar]
- [24]. Roy, A. , Krebs, H. I. , Patterson, S. L. , Judkins, T. N. , Khanna, I . , Forrester, L. W. , Macko, R. M. , and Hogan, N. , eds., 2007. , “Measurement of Human Ankle Stiffness Using the Anklebot,” IEEE 10th International Conference, Rehabilitation Robotics, 2007, ICORR, MIT, Cambridge, MA, June 13–15, pp. 356–363. [Google Scholar]
- [25]. Rouse, E. J. , Hargrove, L. J. , Akhtar, A. , and Kuiken, T. A. , 2012, “Validation of Methods for Determining Ankle Stiffness During Walking Using the Perturberator Robot,” Proceedings of the IEEE International Conference on Biomedical Robotics and Biomechatronics, pp. 1650–1655. [Google Scholar]
- [26]. Wells, R. , 1981, “The Projection of the Ground Reaction Force as a Predictor of Internal Joint Moments,” Bull. Prosthet. Res., 10, pp. 15–19. [PubMed] [Google Scholar]
- [27]. Scheid, F. , 1968, Schaum's Outline of Theory and Problems of Numerical Analysis, McGraw-Hill, New York. [Google Scholar]
- [28]. Weiss, P. L. , Kearney, R. E. , and Hunter, I . W. , 1986, “Position Dependence of Ankle Joint Dynamics–II. Active Mechanics,” J. Biomech., 19(9), pp. 737–751. 10.1016/0021-9290(86)90197-1 [DOI] [PubMed] [Google Scholar]


