Short abstract
Though remarkably robust, articular cartilage becomes susceptible to damage at high loading rates, particularly under shear. While several studies have measured the local static and steady-state shear properties of cartilage, it is the local viscoelastic properties that determine the tissue's ability to withstand physiological loading regimens. However, measuring local viscoelastic properties requires overcoming technical challenges that include resolving strain fields in both space and time and accurately calculating their phase offsets. This study combined recently developed high-speed confocal imaging techniques with three approaches for analyzing time- and location-dependent mechanical data to measure the depth-dependent dynamic modulus and phase angles of articular cartilage. For sinusoidal shear at frequencies f = 0.01 to 1 Hz with no strain offset, the dynamic shear modulus |G*| and phase angle δ reached their minimum and maximum values (respectively) approximately 100 μm below the articular surface, resulting in a profound focusing of energy dissipation in this narrow band of tissue that increased with frequency. This region, known as the transitional zone, was previously thought to simply connect surface and deeper tissue regions. Within 250 μm of the articular surface, |G*| increased from 0.32 ± 0.08 to 0.42 ± 0.08 MPa across the five frequencies tested, while δ decreased from 12 deg ± 1 deg to 9.1 deg ± 0.5 deg. Deeper into the tissue, |G*| increased from 1.5 ± 0.4 MPa to 2.1 ± 0.6 MPa and δ decreased from 13 deg ± 1 deg to 5.5 deg ± 0.2 deg. Viscoelastic properties were also strain-dependent, with localized energy dissipation suppressed at higher shear strain offsets. These results suggest a critical role for the transitional zone in dissipating energy, representing a possible shift in our understanding of cartilage mechanical function. Further, they give insight into how focal degeneration and mechanical trauma could lead to sustained damage in this tissue.
Introduction
The surface of every long bone is covered by a protective layer of articular cartilage comprised of a fluid-saturated network of cross-linked collagen fibers interspersed with cells and charged proteoglycans. Both the structure and composition of this network are known to vary with depth z from the articular surface [1–4]. For example, collagen fibril alignment is parallel to the surface in the superficial zone (z < 100 μm), random in the transitional zone (100 < z < 500 μm), and, for mature tissue, perpendicular to the bone-cartilage interface in the deep zone (z > 500 μm). Like collagen orientation, collagen content, proteoglycan concentration, and cell shape also depend strongly on depth. More recently, it was shown that this variation in zonal architecture produces significant variation in the cartilage modulus [5]. For example, shear measurements have demonstrated that cartilage is an order of magnitude more compliant near the surface than in deeper regions [6–8]. However, to date, such studies of the local mechanical properties have focused on static or steady state behavior and do not give insight to the time-dependent response.
Studies of bulk or average mechanical properties have shown that time-dependent behavior of cartilage in compression and shear arise from poroelastic/biphasic and flow-independent viscoelastic effects, respectively [9–11]. These investigations demonstrated that, for frequencies between 0.01 Hz and 1000 Hz, the shear modulus varies by nearly a factor of five, indicating a significant dissipative response. Whether this dissipative response is distributed evenly throughout the tissue or is concentrated in specific regions remains poorly understood. Resolving this question is particularly important, given the fact that diseases, such as arthritis, initiate in focal regions. If variations in tissue properties are highly concentrated, then local damage has the potential to disproportionately affect tissue function. As such, determining whether the dynamic shear response of the tissue varies with depth is vital for understanding the initiation and progression of such diseases.
Measuring the local viscoelastic behavior of cartilage is considerably more challenging than the static or steady state measurements reported previously, since, in addition to the dynamic shear modulus |G*|, the local phase angle δ must be measured as well. Since δ can be as low as a few degrees, according to bulk measurements on cartilage explants [11], resolving this parameter to within tens of microns requires recently developed, state-of-the-art techniques for high-resolution tissue strain mapping, synchronized measurements of both force and strain, and procedures for careful differentiation of the resultant data. In addition, obtaining location-dependent dynamic modulus and phase angle profiles requires analytical tools for extracting viscoelastic parameters from time-dependent measurements of local deformation. Because deformation in a heterogeneous, viscoelastic material varies both spatially and temporally, a number of approaches can be used to calculate location-dependent values of |G*| and δ. In particular, viscoelastic properties can be extracted from the time-dependent deformation at a given depth, from the depth-dependent deformation at a given time or from the location- and time-dependent stress-strain curve.
Here, we have implemented these tools and approaches to map |G*(z)| and δ(z) in articular cartilage sheared over a wide range of frequencies (0.01–1 Hz). Using these newly developed techniques, we have found that the region of tissue that is most compliant is also the most viscous. This confluence of properties results in a profound focusing of shear energy absorption in a narrow band of tissue just below the articular surface, suggesting a novel and important mechanical role for this region.
Materials and Methods
Sample Preparation.
Cylindrical explants 6 mm in diameter with thickness L0 = 3–4 mm along the long (depth) direction were harvested from the patellofemoral groove of 15 1–3-day-old calves using a biopsy punch. In accordance with previous studies [6,12], during dissection, each explant was detached from the bone with a scalpel blade, thereby ensuring that the bottom surface connected to the load cell was plane parallel with the articular surface. Six explants were designated for shear testing at f = 0.01, 0.1, and 1 Hz with an initial shear strain γi of 0%, four were designated for testing at f = 1 Hz with γi = 0% and 12%, and five were designated for confocal reflectance imaging (see below). After dissection, cartilage plugs were stored in phosphate-buffered saline (PBS) supplemented with 100 U/mL penicillin and 100 μg/mL streptomycin at room temperature for less than 24 h. This protocol is consistent with prior literature that shows little to no change in mechanical behavior of fresh cartilage up to 72 h [13]. Before mechanical testing, each specimen was bisected along its long axis into two equally sized hemicylinders and placed into PBS with 7 μg/mL 5-dichlorotriazinylaminofluorescein (5-DTAF) for 2 h. 5-DTAF is a fluorescent dye that binds to amines in proteins. It fully stains the extracellular matrix of articular cartilage.
Mechanical Testing.
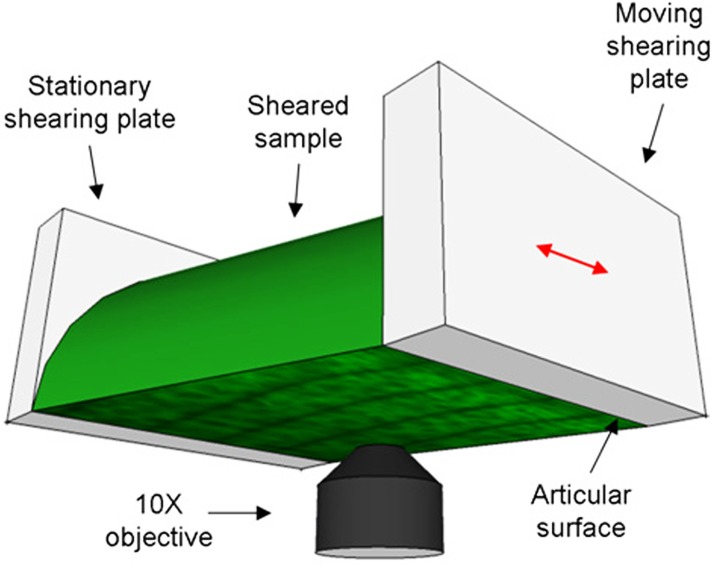
One hemicylinder from each cartilage plug was tested in a tissue deformation imaging stage (TDIS) with sandblasted glass-shearing plates [6,12,14] (Fig. 1). The articular surface was adjacent to the actuated or moving shearing plate, while the deep zone was glued to the stationary shearing plate. The stationary shearing plate was attached to a leaf spring with a known spring constant. Displacements of this shearing plate were used to calculate the shear stress τ. After loading the sample and adjusting the axial compression εc to 20%, five lines separated by 50 μm were photo-bleached along its long (depth) axis as described previously [12,15]. The sample was then imaged under 20X magnification with a Zeiss LSM 5 Live microscope as it was sheared sinusoidally at a frequency f = 0.01, 0.1, or 1 Hz with a shearing plate absolute amplitude of 16 μm. The applied compressive strain (20%) and friction with the sandblasted glass prevented slip at the actuated plate (as verified optically). Since phase angle calculations are highly sensitive to noise, long sequences of 1000 images 317 × 317 μm in size were taken at each of 10 tile locations along the sample and stitched together. For each frequency, the imaging rate was chosen such that 100 images were obtained for each oscillation cycle. After testing, each sample was imaged across its cross-section to determine its area A.
Fig. 1.
Schematic diagram of the tissue deformation imaging stage (TDIS). The sample is sheared between the stationary and moveable plates, while it is imaged from below with an inverted confocal microscope.
To measure the arrangement of collagen in loaded and unloaded tissue, cartilage samples were imaged using high-resolution confocal reflectance, a modality commonly used to visualize collagen in gels and tissues [16]. Unstained hemicylinders from bisected explants were loaded into the TDIS and imaged with a Zeiss LSM 710 microscope in reflectance mode using a 488-nm laser for illumination. Samples were compressed by 20% and imaged under 0% and 12% shear strain. Aspect ratios and characteristic angles of the Fourier transform of each confocal micrograph were measured to quantify fibril alignment.
Theory and Data Analysis.
Three separate approaches were considered to calculate the depth-dependent viscoelastic tissue properties from the acquired images. In all approaches, sample displacement u(z,t) relative to the undeformed state along the direction of deformation was first determined by tracking each of the photobleached lines using an image analysis algorithm described previously [12]. t = 0 was taken as the time the tissue first reached its maximally deformed state, and depth z = 0 was taken as the articular surface. The time-dependent displacement of the stationary shearing plate was converted to a force F(t) using the known stiffness of the leaf spring, and the applied stress τ(t) (assumed to be depth-independent) was calculated from the sample area as τ(t) = F(t)/A. Samples were cut to ensure that A did not vary with depth. To determine the amplitude and phase of the stress, τ(t) was then fit to a cosine function according to
| (1) |
where the phase angle δτ was calculated relative to the displacement of the moving shearing plate at z = 0.
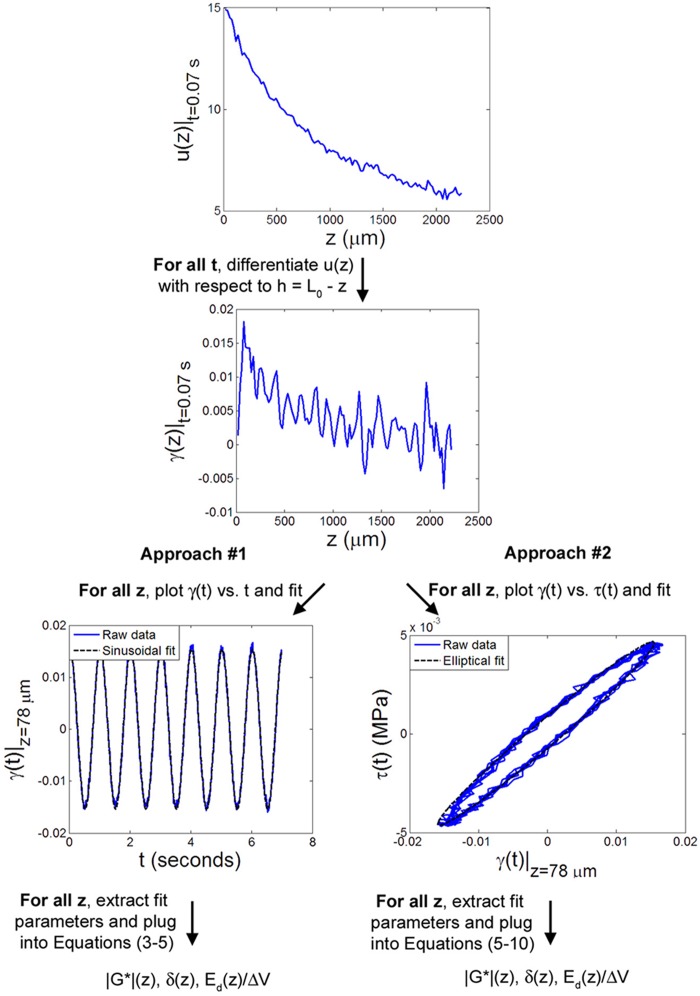
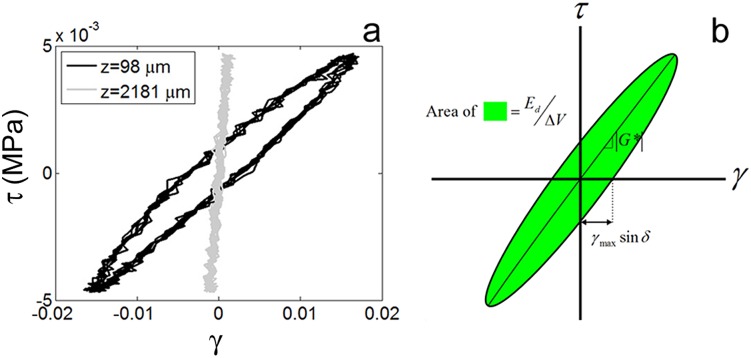
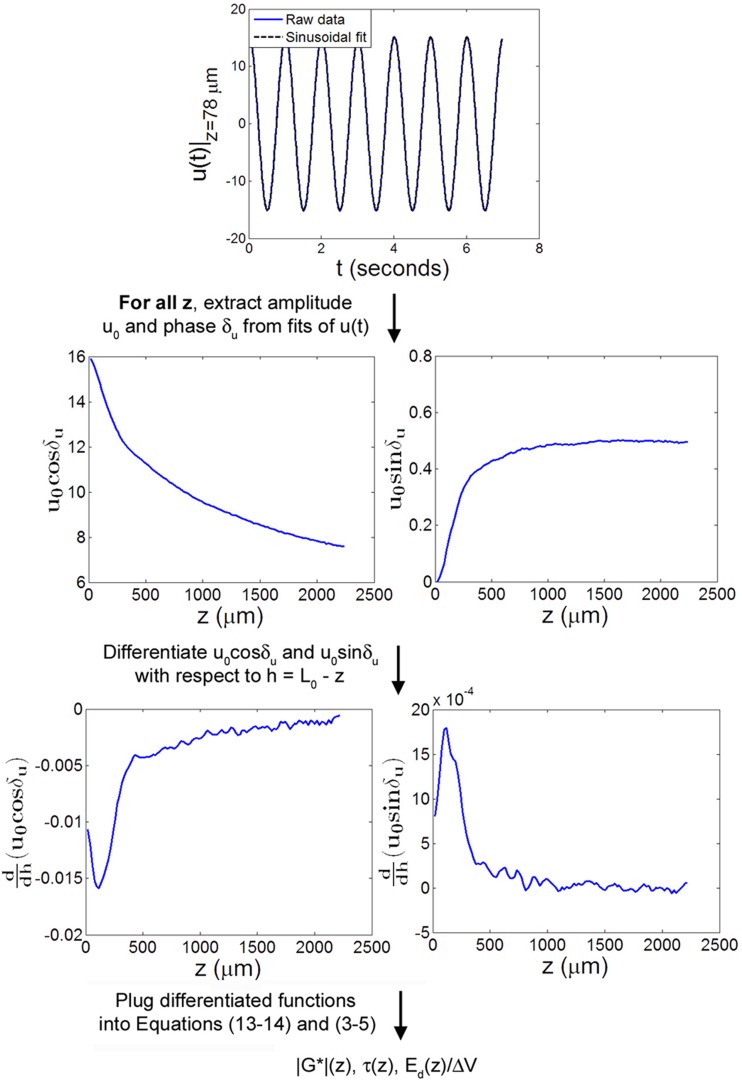
In the first two approaches (Fig. 2), γ(z,t), the local shear strain in the sample was obtained by direct numerical differentiation of u(z) at all times t. The strain γ(t) at each depth z was either fit with a periodic function to determine the local dynamic shear modulus, phase angle, and other viscoelastic properties (approach #1) or used to construct Lissajous plots of τ versus γ (Fig. 3) that enabled direct extraction of the local modulus, phase angle, and dissipated energy (approach #2). In the third approach (Fig. 4), u(z,t) was first fit at each depth z with a cosine function. Functions of the fit parameters were then differentiated with respect to to determine |G*(z)|, δ(z), and, ultimately, the energy absorbed during each cycle.
Fig. 2.
Flow diagram of approaches #1 and #2 for determination of viscoelastic mechanical parameters from the measured displacement u(z,t). Approach #1 involves sinusoidal fitting of the calculated strain γ versus time t at each depth z, while approach #2 involves elliptical fitting of γ versus stress τ for all z. All plotted data is from a representative sample sheared at f = 1 Hz with γi = 0%.
Fig. 3.
(a) Shear stress τ versus shear strain γ at depths z = 98 μm and z = 2182 μm in a representative sample sheared at 1 Hz with γi = 0% with equilibrium values of τ and γ set to zero. (b) From stress strain curves, such as those shown in (a), |G*|, δ, and Ed/ΔV can be obtained from the slope of the major axis, the positive x-intercept, and the enclosed area, respectively (approach #2).
Fig. 4.
Flow diagram of approach #3 for determination of viscoelastic mechanical parameters from the measured displacement u(z,t). u(t) was fit to a periodic function at all z, and calculations involving derivatives of the fit parameters were used to compute |G*|(z), τ(z), and Ed(z)/ΔV. All plotted data is from a representative sample sheared at f = 1 Hz with γi = 0%.
Approach #1.
γ(z,t), the local shear strain in the sample as a function of time, was calculated by numerically differentiating the displacement profile u(z) (with respect to height ) at each time point t using five-point linear least squares fitting (5PLSQ). At each depth z, the resulting curves were fit to the function
| (2) |
where δg was measured relative to the displacement of the moving shearing plate at z = 0. The local dynamic shear modulus was computed using the expression
| (3) |
while the local phase angle δ(z) of the stress with respect to the strain was computed using
| (4) |
Finally, the energy dissipated per cycle per unit volume at a depth z was calculated from the expression
| (5) |
Approach #2.
γ(z,t), the local shear strain in the sample as a function of time, was determined by numerically differentiating the displacement profile u(z) with respect to height at each time point t. Lissajous curves were obtained by plotting the measured stress τ(t) versus γ(t) at each depth z. Each Lissajous plot was fit to an ellipse of the form
| (6) |
using the Taubin algorithm [17]. The complex shear modulus |G*(z)| is equal to the slope of the major axis of the ellipse [18] and was obtained from the expression
| (7) |
The phase angle between the stress and the strain was determined using
| (8) |
where γmax and γ|τ=0 were calculated from Eq. (6). Finally, the energy dissipated per cycle per volume is given by the area in between the ellipse, which was computed according to
| (9) |
where and are the major and minor axes lengths of the fitted ellipse and are given by
| (10) |
| (11) |
Approach #3.
At each depth z, u(t) was fit to a cosine curve of the form
| (12) |
in order to determine the displacement amplitude u0(z) and the displacement phase angle δu(z), where δu(z) is defined relative to the shearing plate at z = 0 μm. For a shear stress τ that is uniform with z, γ0(z), the shear strain amplitude, is given by vector sum of the real and imaginary components of the strain
| (13) |
while δγ(z), the phase angle of the strain relative to the displacement of the shearing plate, is given by
| (14) |
In the limit where δu(z) is independent of z, Eq. (13) reduces to γ0(z) = and Eq. (14) reduces to δγ(z) = δu(z). 5PLSQ was used to differentiate u0cosδu and u0sinδu with respect to in order to calculate γ0 and δg from experimental data. The local dynamic shear modulus |G*|(z) was computed from Eq. (3), and the local phase angle δ(z) was computed from Eq. (4). Finally, the energy dissipated per cycle per unit volume at a depth z was calculated as described in Eq. (5).
Statistical Analysis.
The repeated effects of depth and either frequency f or initial strain γi on the mean values of |G*|, δt, and near the surface (z ≤ 250 μm) and in the bulk (z > 250 μm) were assessed using two-way analyses of variance with Bonferroni post hoc analysis. Significance was set at p ≤ 0.05.
Results
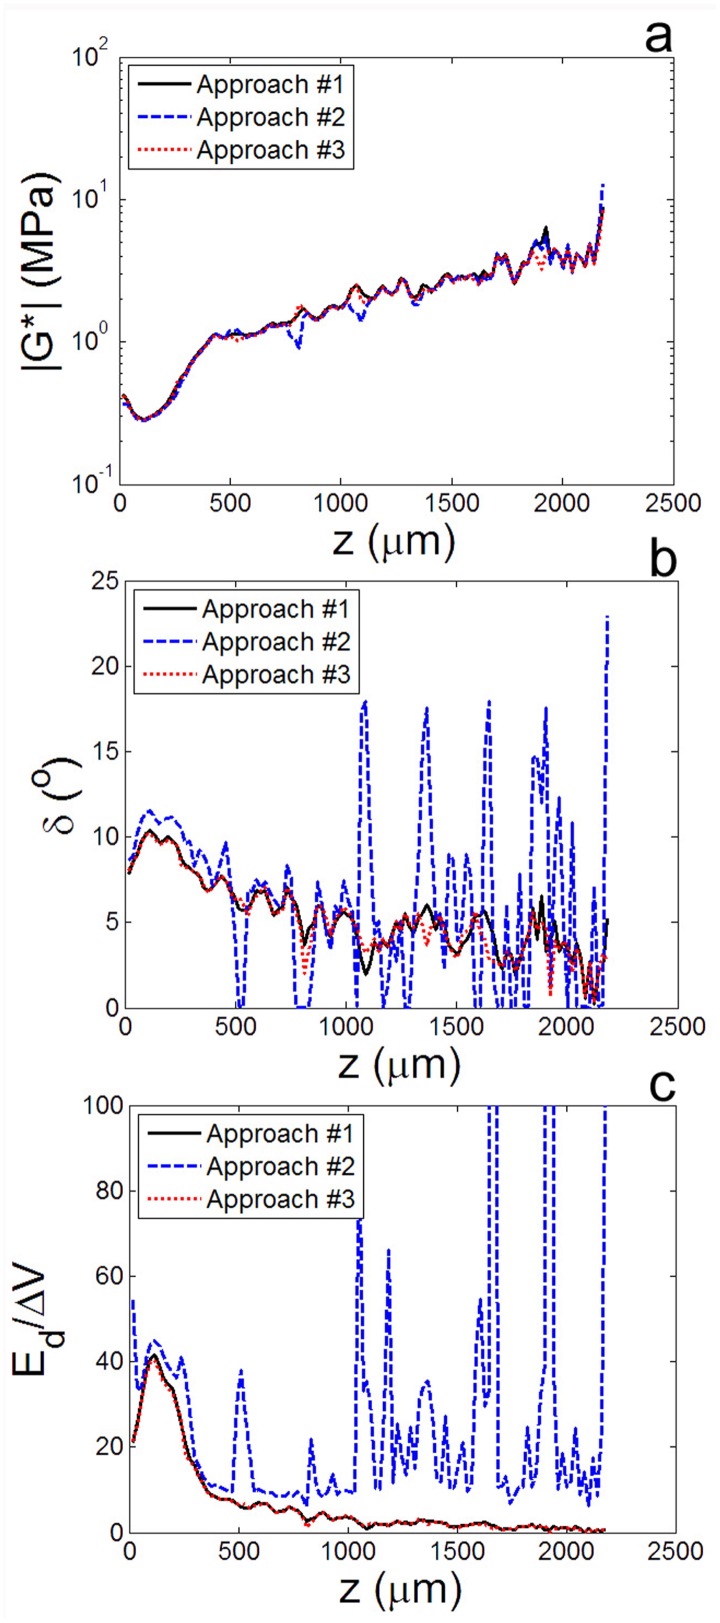
All three approaches demonstrated that viscoelastic properties of articular cartilage vary dramatically with depth. For example, from approach #2, it is clear that the shape of the stress-strain curve of articular cartilage under shear at f = 1 Hz had a distinct z dependence (Fig. 3(a)). Far from the articular surface (z = 2128 μm), it was nearly linear, indicative of an elastic response (Fig. 3(b)). However, near the surface (z = 98 μm), it was elliptical, indicating a phase lag δ between the stress and the strain. Similarly, approaches #2 and #3 demonstrated a distinct peak in δ(z) roughly 50–150 μm below the articular surface (Fig. 5). Direct comparison of these methods for calculating |G*(z)|, δτ(z), and Ed(z)/ΔV (Fig. 5) shows that, while all approaches revealed similar trends, approaches #1 and #3 yielded nearly identical results and were substantially less noisy than approach #2.
Fig. 5.
Comparison of the results of approaches #1, #2, and #3 for calculating the (a) dynamic shear modulus |G*|, (b) phase angle δ, and (c) local fraction of energy-dissipated as a function of depth z for a representative sample sheared at f = 1 Hz with γi = 0%. All approaches yielded similar |G*| profiles, but approach #2 was much more susceptible to noise in calculating δ(z) and . Data from approaches #1 and #3 were consistent and accurate for all measured parameters.
The fundamental difference between the three approaches is that approach #2 involves fitting plots of τ versus γ, containing raw data on both the x- and y-axes, while approaches 1 and 3 always fit strain γ and displacement u plotted over time t, a precisely known quantity. As a result, approach #2 was highly susceptible to noise. Furthermore, while it was accurate for measuring the dynamic modulus |G*|, this approach had a noticeable tendency to overestimate both the phase angle δ and energy dissipated Ed/ΔV. While approaches #1 and #3 yielded virtually indistinguishable results, approach #1 involves numerical differentiation of Ni curves and fitting of Nz curves (where Ni is the number of images taken and Nz is the number of locations analyzed). On the other hand, approach #3 involves Ni sinusoidal fits and numerical differentiation of just two curves (u0cosδu and u0sinδu). Since Nz 2, approach #3 is substantially less computationally intensive than approach #1. Therefore, we used approach #3 for the remaining analyses.
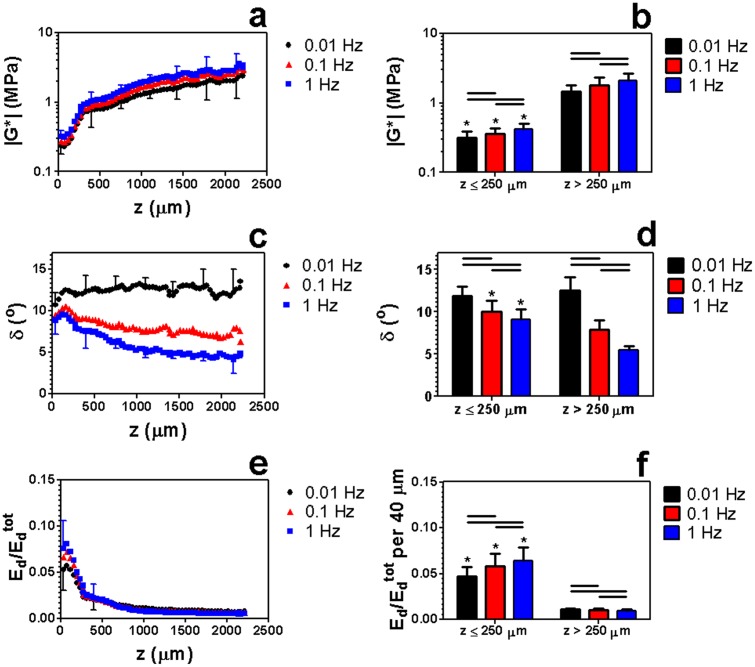
All measured mechanical parameters varied significantly with frequency both near the surface and in the bulk (Fig. 6). Specifically, increasing f from 0.01 Hz to 0.1 Hz or from 0.1 Hz to 1 Hz increased |G*|(z) and while decreasing δτ(z). At all tested frequencies, |G*(z)| exhibited a global minimum near the surface (50 < z < 150 μm) (Figs. 6(a) and 6(b)) and was significantly lower near the surface (z ≤ 250 μm) than in the bulk (z > 250 μm). Conversely, δ(z) peaked just below the surface, a trend that was more pronounced at high frequencies (Figs. 6(c) and 6(d)). In particular, δ(z) was significantly lower at z > 250 μm than at z ≤ 250 μm at f = 0.1 and 1 Hz, but not at 0.01 Hz. For all frequencies, was significantly lower at z > 250 μm than at z ≤ 250 μm. Furthermore, the energy dissipation profile exhibited a global maximum at 50 < z < 150 μm that was up to 15 times larger than in deeper regions (Figs. 6(e) and 6(f)). Therefore, we define the region within 50 μm < z < 150 μm as the maximal energy absorbing region (MEAR).
Fig. 6.
[(a) and (b)] Complex shear modulus |G*|, [(c) and (d)] phase angle δ, and [(e) and (f)] relative energy dissipated versus z in articular cartilage sheared at f = 0.01, 0.1, and 1 Hz with γi = 0 μm and εc = 20%. Data are mean ± SD, horizontal bars denote p ≤ 0.05/3, and (*) denotes p ≤ 0.05 versus (*) z > 250 μm. In (a), (c), and (e), only upper or lower error bars for selected points are shown to enhance clarity.
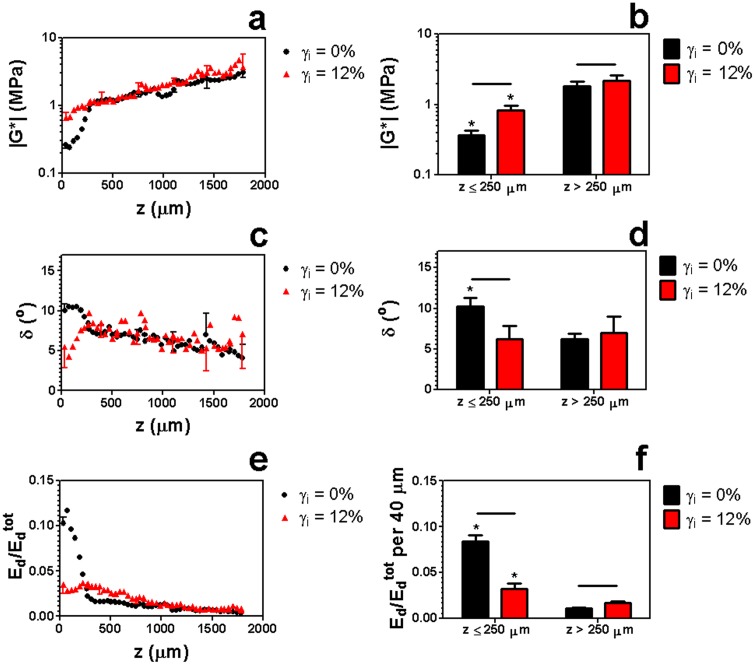
Previous studies have demonstrated that the static shear properties of cartilage are shear strain-dependent [6]. Therefore, we examined the effect of shear strain offset on the dynamic properties of this tissue (Fig. 7). At a frequency of 1 Hz, we found that increasing the shear strain offset from γi = 0% to γi = 12% caused a dramatic flattening of the energy dissipation profile (Figs. 7(e) and 7(f)). In particular, decreased significantly in the surface region (z ≤ 250 μm) and increased significantly in the bulk. This flattening was a result of a local increase in |G*| and decrease in δ near the surface (z ≤ 250 μm) at the higher shear strain offset (Figs. 7(a)–7(d)).
Fig. 7.
[(a) and (b)] vs. depth z in articular cartilage sheared from initial strains γi = 0% and γi = 12% with f = 1 Hz and εc = 20%. Data are mean ± SD, horizontal bars denote p ≤ 0.05/3, and (*) denotes p ≤ 0.05 versus (*) z > 250 μm. In (a), (c), and (e), only upper or lower error bars for selected points are shown to enhance clarity.
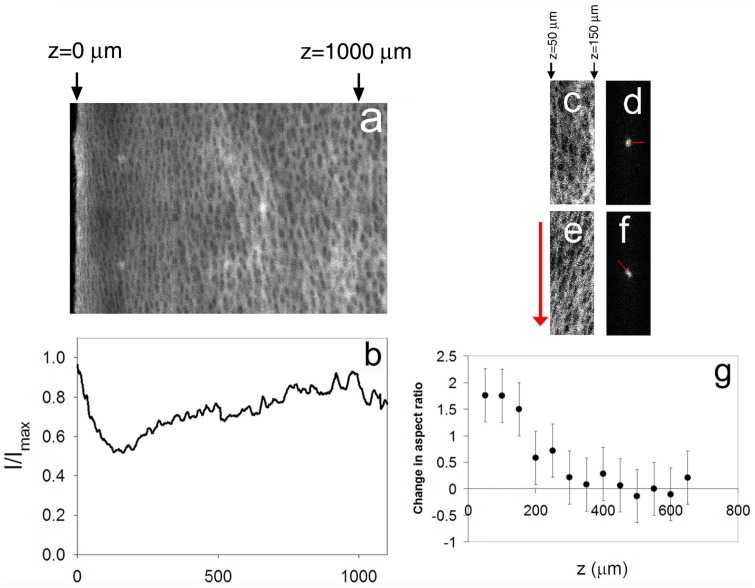
Because collagen structure is believed to have a strong influence on shear behavior, we used confocal reflectance microscopy to observe changes in the collagen structure in the presence and absence of prestrain. In compressed samples of articular cartilage imaged under confocal reflectance prior to shear loading (Fig. 8), the maximal energy-absorbing region (MEAR) (50 < z < 150 μm) appeared as a dim, structurally distinct band just below the brighter superficial zone. Confocal reflectance intensity was lowest at z = 150 μm, nearly the same location where shear energy absorption peaked. With no applied shear strain, collagen fibrils near z = 100 μm were oriented randomly (Fig. 8(c)), resulting in a symmetric Fourier transform (Fig. 8(d)). In this configuration, small shear strains can induce bending of the fibrils. However, application of a 12% shear strain offset caused these collagen fibrils to rotate and stretch in the direction of shear (Fig. 8(e)), generating aligned structures that skew the Fourier transform and increase its aspect ratio considerably (Fig. 8(f)), especially in the MEAR (Fig. 8(g)).
Fig. 8.
(a) Confocal reflectance micrograph of a representative sample of articular cartilage subjected to 20% compression and (b) the corresponding average intensity profile along the long axis. (c)–(f) Confocal reflectance micrographs with corresponding Fourier transforms (contrast enhanced) taken near the surface (50 < z < 150 μm) of a sample of articular cartilage [(c) and (d)] before and [(e) and (f)] after application of a 12% shear strain. The arrow to the left of (e) depicts the direction of shear, while the lines in (d) and (f) denote the angles of maximal alignment. (g) Change in Fourier transform aspect ratio before and after application of a 12% shear strain versus depth z. Error bars in (g) represent the experimental uncertainty for measurements on the specimen shown in (a).
Discussion
In this paper, we developed a methodology for measuring the local viscoelastic properties of cartilage under shear for the first time. First, local deformations were mapped by tracking photobleached lines imaged with a high-speed confocal microscope. To extract viscoelastic parameters from the measured deformations, we compared three approaches in which the sequence of numerical differentiation and nonlinear curve fitting was varied. Approach #2 is perhaps the most intuitive, since the target measures can be determined graphically from Lissajous plots (Fig. 3(b)). However, while all approaches were able to closely resolve the shear modulus profile |G*|, we found that accurate measurements of the phase angle and energy dissipation profiles δ(z) and Ed(z)/ΔV required approaches #1 or #3, which involve sequential steps of numerical differentiation and fitting to sinusoidal functions. Note that, since all three approaches involve differentiation of raw data and nonlinear curve fitting, they are highly susceptible to noise and require accurately resolved spatial and temporal data. This is particularly true of the phase angle δ, which is as low as 4 deg in deep regions of the tissue and therefore difficult to measure.
Regardless of the approach used, we found that the thin region of cartilage located at a depth 50 < z < 150 μm, known previously to be the most compliant region of tissue, is also the most viscous. That is, the location-dependent phase angle δ between stress and strain, measured here for the first time, peaks near z = 100 μm (Fig. 6(c)). As demonstrated by Eq. (5), articular cartilage is highly effective at absorbing shear energy near the surface, because it is both compliant (low |G*|) and lossy (high δ) in this region (Figs. 6(a) and 6(c)). Additionally, we have found that, unlike under compression [19,20], energy dissipation in cartilage under shear is substantially higher than that of the underlying bone (see appendix 1: Estimate of shear energy dissipation in cartilage relative to bone) and is therefore likely to represent a substantial contribution to in vivo damping of joint vibrations.
This study also reports the first measurements of the frequency dependence of local shear mechanical properties in articular cartilage. As the frequency of deformation increases above 0.01 Hz, the fraction of energy dissipated at low depths increases (Fig. 6(e)), suggesting that focal shear energy dissipation near the surface is particularly relevant for physiological frequencies (f > 0.1 Hz) and possibly for sudden impacts as well.
While these novel measurements identify the MEAR as a distinct tissue region with unique mechanical properties, they are also consistent with previous bulk mechanical measurements. According to our measurements, |G*| was 2.1 ± 0.6 and δ was 5.5 ± 0.2 at depths greater than 250 μm for f = 1 Hz. Results for the dynamic modulus are consistent with prior investigations that reported |G*| = 1.5 ± 0.4 for f = 1 Hz [11] and |G*| = 1.8 for f = 20 Hz [9]. Since both of these studies tested specimens after removal of the superficial zone to facilitate gripping, their findings should be nearly comparable to our results at large depths (z > 250 μm). Our phase angle measurements are slightly lower than the previously reported value of δ = 9.4 ± 1.8 deg for f = 1 Hz [11]. However, these differences are reasonable, given that the previous study tested specimens in a torsional geometry.
Confocal reflectance images of articular cartilage suggest that the maximal energy absorbing region of cartilage corresponds to the transitional zone sandwiched between the superficial and intermediate zones (Figs. 8(a) and 8(b)). This area is known to have the lowest concentration of collagen [1], which accounts for the observed reduction in confocal reflectance intensity. In addition, using differential interference contrast microscopy, chevron-shaped discontinuities have been observed in the transition zone (100–300 μm below the articular surface) in compressed specimens of cartilage [21]. These unique features suggest buckling or crimping of collagen fibrils that could be related to the high deformability and dissipative nature of tissue in this region. Therefore, while traditionally thought to exist out of structural necessity, our results suggest that the transitional region between the aligned superficial zone and randomly oriented intermediate zone may serve an important mechanical function: concentrating energy dissipation to protect the joint from damage.
We have also shown that the mechanical properties and physical structure of the MEAR are altered under increasing shear strain (Figs. 8(c)–8(g)). In particular, the collagen fibrils become more aligned. The collagen network is stiffer in this stretched state [22], causing the material to resist deformation and absorb less energy. Thus, the capacity of the MEAR to dissipate shear energy is compromised at large shear strains (Fig. 7(e)), an effect that could explain its susceptibility to shear-induced structural damage during traumatic loading.
One potential limitation of this study is the use of neonatal tissue, known to be more cellular and less organized than mature tissue [23,24]. However, previous work has demonstrated qualitative similarities in the depth-dependent shear properties of young bovine and adult human cartilage [12]. In addition, previous investigations have tested the shear properties of two samples of articular cartilage articulating against one another with slip [7,8]. These studies have the advantage of a physiological, low-friction boundary condition with a low coefficient of friction. On the other hand, a sinusoidal sample displacement cannot be induced in such a configuration, nor can the shear stress on the sample be measured. Therefore, our measurements of phase angle and complex modulus would not be possible were slip to occur between the shearing plate and the sample. In addition, as long as the sample strains are the same, our shear configuration should produce local deformations similar to those obtained using the cartilage-on-cartilage shear configuration. A final potential limitation of this study is the assumption of uniform shear stress as a function of depth. Due to boundary effects, nonuniform stresses may develop near the shearing plates. However, according to Saint-Venant's principle, away from the shearing plates, the depth-independent cross-sectional area and shear force of each tested specimen imply a uniform shear stress. Moreover, similar tests in our laboratory on homogeneous, fluorescently stained rubber phantoms of equivalent size and shape (data not shown) yielded uniform strain profiles, suggesting that our testing protocol induces negligible boundary-associated stress concentrations within the resolution of our measurements.
The existence of a significant shear-energy absorbing region near the surface of articular cartilage may also have implications for understanding the progression of osteoarthritis. Recent studies have shown that osteoarthritis first manifests itself near the surface of articular cartilage before progressing deeper into the tissue [25]. Damage to the primary shear energy dissipating region (z ≤ 250 μm) in the early stages of osteoarthritis would exacerbate the effects of shear stress elsewhere in the tissue and facilitate the progression of the disease. Furthermore, such damage would lead to altered loading on chondrocyte cells deeper in the tissue, an effect that has been shown to promote catabolic activity [26] and, potentially, cell death [27].
In addition to advancing our understanding of basic cartilage mechanics, these results may also have direct bearing on clinical practices. For example, articular cartilage that has been damaged by injury is often treated by a class of surgical procedures known as cartilage debridement. These may involve the removal of loose debris in the joint, shaving the top section of damaged cartilage to smooth the surface (chondral shaving), or completely abrading a region of cartilage and a thin section of the underlying bone to promote regrowth (subchondral abrasion). The results of this study suggest that, in addition to compromising cartilage integrity and inducing an inadequate healing response [28–30], removal of the energy-absorbing surface region could increase susceptibility to shear-induced damage in the rest of the tissue. This hypothesis is supported by studies that have demonstrated that chondral shaving can lead to enhanced cell death in the underlying tissue [28]. Consequently, it may be important for orthopedic surgeons to weigh this effect against the potential benefits of surface smoothing in injured articular cartilage.
Acknowledgment
We thank Matthew Farrar for his valuable input and assistance. This work was supported by NIH R21AR054867 and Cornell's IGERT program in Nonlinear Systems (NSF Grant No. DGE-9870631).
Contributor Information
Mark R. Buckley, Department of Physics, Clark Hall C7, Cornell University, Ithaca, NY 14853, e-mail: mbuck@mail.med.upenn.edu
Lawrence J. Bonassar, Department of Biomedical Engineering and, Sibley School of Mechanical and, Aerospace Engineering, Weill Hall 149, Cornell University, Ithaca, NY 14853, e-mail: lb244@cornell.edu
Itai Cohen, Department of Physics, Clark Hall 508, Cornell University, Ithaca, NY 14853, e-mail: ic64@cornell.edu.
References
- [1]. Bi, X. , Yang, X. , Bostrom, M. P. , and Camacho, N. P. , 2006, “Fourier Transform Infrared Imaging Spectroscopy Investigations in the Pathogenesis and Repair of Cartilage,” Biochim. Biophys. Acta, 1758(7), pp. 934–941. 10.1016/j.bbamem.2006.05.014 [DOI] [PubMed] [Google Scholar]
- [2]. Bullough, P. , and Goodfellow, J. , 1968, “The Significance of the Fine Structure of Articular Cartilage,” J. Bone Joint Surg. Br., 50(4), pp. 852–857. [PubMed] [Google Scholar]
- [3]. Guedes, R. M. , Simoes, J. A. , and Morais, J. L. , 2006, “Viscoelastic Behaviour and Failure of Bovine Cancellous Bone Under Constant Strain Rate,” J. Biomech., 39(1), pp. 49–60. 10.1016/j.jbiomech.2004.11.005 [DOI] [PubMed] [Google Scholar]
- [4]. Spatz, H. C. , O'Leary, E. J. , and Vincent, J. F. , 1996, “Young's Moduli and Shear Moduli in Cortical Bone,” Proc. R. Soc. London, Ser. B, 263(1368), pp. 287–294. 10.1098/rspb.1996.0044 [DOI] [PubMed] [Google Scholar]
- [5]. Schinagl, R. M. , Ting, M. K. , Price, J. H. , and Sah, R. L. , 1996, “Video Microscopy to Quantitate the Inhomogeneous Equilibrium Strain Within Articular Cartilage During Confined Compression,” Ann. Biomed. Eng., 24(4), pp. 500–512. 10.1007/BF02648112 [DOI] [PubMed] [Google Scholar]
- [6]. Buckley, M. R. , Gleghorn, J. P. , Bonassar, L. J. , and Cohen, I. , 2008, “Mapping the Depth Dependence of Shear Properties in Articular Cartilage,” J. Biomech., 41(11), pp. 2430–2437. 10.1016/j.jbiomech.2008.05.021 [DOI] [PubMed] [Google Scholar]
- [7]. Wong, B. L. , Bae, W. C. , Chun, J. , Gratz, K. R. , Lotz, M. , and Sah, R. L. , 2008, “Biomechanics of Cartilage Articulation: Effects of Lubrication and Degeneration on Shear Deformation,” Arthritis Rheum., 58(7), pp. 2065–2074. 10.1002/art.23548 [DOI] [PubMed] [Google Scholar]
- [8]. Wong, B. L. , Bae, W. C. , Gratz, K. R. , and Sah, R. L. , 2008, “Shear Deformation Kinematics During Cartilage Articulation: Effect of Lubrication, Degeneration, and Stress Relaxation,” Mol. Cell Biomech., 5(3), pp. 197–206. [PMC free article] [PubMed] [Google Scholar]
- [9]. Hayes, W. C. , and Bodine, A. J. , 1978, “Flow-Independent Viscoelastic Properties of Articular Cartilage Matrix,” J. Biomech., 11(8–9), pp. 407–419. 10.1016/0021-9290(78)90075-1 [DOI] [PubMed] [Google Scholar]
- [10]. Mow, V. C. , Kuei, S. C. , Lai, W. M. , and Armstrong, C. G. , 1980, “Biphasic Creep and Stress Relaxation of Articular Cartilage in Compression? Theory and Experiments,” J. Biomech. Eng., 102(1), pp. 73–84. 10.1115/1.3138202 [DOI] [PubMed] [Google Scholar]
- [11]. Zhu, W. , Mow, V. C. , Koob, T. J. , and Eyre, D. R. , 1993, “Viscoelastic Shear Properties of Articular Cartilage and the Effects of Glycosidase Treatments,” J. Orthop. Res., 11(6), pp. 771–781. 10.1002/jor.1100110602 [DOI] [PubMed] [Google Scholar]
- [12]. Buckley, M. R. , Bergou, A. J. , Fouchard, J. , Bonassar, L. J. , and Cohen, I. , 2009, “High-Resolution Spatial Mapping of Shear Properties in Cartilage,” J. Biomech., 43(4), pp. 796–800. 10.1016/j.jbiomech.2009.10.012 [DOI] [PMC free article] [PubMed] [Google Scholar]
- [13]. Bonassar, L. J. , Frank, E. H. , Murray, J. C. , Paguio, C. G. , Moore, V. L. , Lark, M. W. , Sandy, J. D. , Wu, J. J. , Eyre, D. R. , and Grodzinsky, A. J. , 1995, “Changes in Cartilage Composition and Physical Properties Due to Stromelysin Degradation,” Arthritis Rheum., 38(2), pp. 173–183. 10.1002/art.1780380205 [DOI] [PubMed] [Google Scholar]
- [14]. Michalek, A. J. , Buckley, M. R. , Bonassar, L. J. , Cohen, I. , and Iatridis, J. C. , 2009, “Measurement of Local Strains in Intervertebral Disc Anulus Fibrosus Tissue Under Dynamic Shear: Contributions of Matrix Fiber Orientation and Elastin Content,” J. Biomech., 42(14), pp. 2279–2285. 10.1016/j.jbiomech.2009.06.047 [DOI] [PMC free article] [PubMed] [Google Scholar]
- [15]. Bruehlmann, S. B. , Matyas, J. R. , and Duncan, N. A. , 2004, “ISSLS Prize Winner: Collagen Fibril Sliding Governs Cell Mechanics in the Anulus Fibrosus: An In Situ Confocal Microscopy Study of Bovine Discs,” Spine, 29(23), pp. 2612–2620. 10.1097/01.brs.0000146465.05972.56 [DOI] [PubMed] [Google Scholar]
- [16]. Vader, D. , Kabla, A. , Weitz, D. , and Mahadevan, L. , 2009, “Strain-Induced Alignment in Collagen Gels,” PLoS ONE, 4(6), p. e5902. 10.1371/journal.pone.0005902 [DOI] [PMC free article] [PubMed] [Google Scholar]
- [17]. Taubin, G. , 1991, “Estimation of Planar Curves, Surfaces, and Nonplanar Space-Curves Defined by Implicit Equations With Applications to Edge and Range Image Segmentation,” IEEE Trans. Pattern Anal. Mach. Intell., 13(11), pp. 1115–1138. 10.1109/34.103273 [DOI] [Google Scholar]
- [18]. Lakes, R. S. , 2009, Viscoelastic Materials, Cambridge University Press, Cambridge, England. [Google Scholar]
- [19]. Radin, E. L. , and Paul, I. L. , 1970, “Does Cartilage Compliance Reduce Skeletal Impact Loads? The Relative Force-Attenuating Properties of Articular Cartilage, Synovial Fluid, Periarticular Soft Tissues and Bone,” Arthritis Rheum., 13(2), pp. 139–144. 10.1002/art.1780130206 [DOI] [PubMed] [Google Scholar]
- [20]. Radin, E. L. , Paul, I. L. , and Lowy, M. , 1970, “A Comparison of the Dynamic Force Transmitting Properties of Subchondral Bone and Articular Cartilage,” J. Bone Joint Surg. Am., 52(3), pp. 444–456. [PubMed] [Google Scholar]
- [21]. Thambyah, A. , and Broom, N. , 2006, “Micro-Anatomical Response of Cartilage-on-Bone to Compression: Mechanisms of Deformation Within and Beyond the Directly Loaded Matrix,” J. Anat., 209(5), pp. 611–622. 10.1111/j.1469-7580.2006.00646.x [DOI] [PMC free article] [PubMed] [Google Scholar]
- [22]. Storm, C. , Pastore, J. J. , Mackintosh, F. C. , Lubensky, T. C. , and Janmey, P. A. , 2005, “Nonlinear Elasticity in Biological Gels,” Nature, 435(7039), pp. 191–194. 10.1038/nature03521 [DOI] [PubMed] [Google Scholar]
- [23]. Clark, J. M. , Norman, A. , and Notzli, H. , 1997, “Postnatal Development of the Collagen Matrix in Rabbit Tibial Plateau Articular Cartilage,” J. Anat., 191(Pt 2), pp. 215–221. 10.1046/j.1469-7580.1997.19120215.x [DOI] [PMC free article] [PubMed] [Google Scholar]
- [24]. Van Turnhout, M. C. , Schipper, H. , Engel, B. , Buist, W. , Kranenbarg, S. , and Van Leeuwen, J. L. , 2010, “Postnatal Development of Collagen Structure in Ovine Articular Cartilage,” BMC Dev. Biol., 10, p. 62. 10.1186/1471-213X-10-62 [DOI] [PMC free article] [PubMed] [Google Scholar]
- [25]. Hollander, A. P. , Pidoux, I. , Reiner, A. , Rorabeck, C. , Bourne, R. , and Poole, A. R. , 1995, “Damage to Type II Collagen in Aging and Osteoarthritis Starts at the Articular Surface, Originates Around Chondrocytes, and Extends Into the Cartilage With Progressive Degeneration,” J. Clin. Invest., 96(6), pp. 2859–2869. 10.1172/JCI118357 [DOI] [PMC free article] [PubMed] [Google Scholar]
- [26]. Sah, R. L. , Doong, J. Y. , Grodzinsky, A. J. , Plaas, A. H. , and Sandy, J. D. , 1991, “Effects of Compression on the Loss of Newly Synthesized Proteoglycans and Proteins From Cartilage Explants,” Arch. Biochem. Biophys., 286(1), pp. 20–29. 10.1016/0003-9861(91)90004-3 [DOI] [PubMed] [Google Scholar]
- [27]. Quinn, T. M. , Grodzinsky, A. J. , Hunziker, E. B. , and Sandy, J. D. , 1998, “Effects of Injurious Compression on Matrix Turnover Around Individual Cells in Calf Articular Cartilage Explants,” J. Orthop. Res., 16(4), pp. 490–499. 10.1002/jor.1100160415 [DOI] [PubMed] [Google Scholar]
- [28]. Kim, H. K. , Moran, M. E. , and Salter, R. B. , 1991, “The Potential for Regeneration of Articular Cartilage in Defects Created by Chondral Shaving and Subchondral Abrasion. An Experimental Investigation in Rabbits,” J. Bone Joint Surg. Am., 73(9), pp. 1301–1315. [PubMed] [Google Scholar]
- [29]. Milgram, J. W. , 1985, “Injury to Articular Cartilage Joint Surfaces. I. Chondral Injury Produced by Patellar Shaving: A Histopathologic Study of Human Tissue Specimens,” Clin. Orthop. Relat. Res., 192, pp. 168–173. 10.1097/00003086-198501000-00023 [DOI] [PubMed] [Google Scholar]
- [30]. Bevill, S. L. , Thambyah, A. , and Broom, N. D. , 2010, “New Insights Into the Role of the Superficial Tangential Zone in Influencing the Microstructural Response of Articular Cartilage to Compression,” Osteoarthritis Cartilage, 18(10), pp. 1310–1318. 10.1016/j.joca.2010.06.008 [DOI] [PubMed] [Google Scholar]


