Short abstract
In a previous work (Raghupathy and Barocas, 2010, “Generalized Anisotropic Inverse Mechanics for Soft Tissues,”J. Biomech. Eng., 132(8), pp. 081006), a generalized anisotropic inverse mechanics method applicable to soft tissues was presented and tested against simulated data. Here we demonstrate the ability of the method to identify regional differences in anisotropy from full-field displacements and boundary forces obtained from biaxial extension tests on soft tissue analogs. Tissue heterogeneity was evaluated by partitioning the domain into homogeneous subdomains. Tests on elastomer samples demonstrated the performance of the method on isotropic materials with uniform and nonuniform properties. Tests on fibroblast-remodeled collagen cruciforms indicated a strong correlation between local structural anisotropy (measured by polarized light microscopy) and the evaluated local mechanical anisotropy. The results demonstrate the potential to quantify regional anisotropic material behavior on an intact tissue sample.
1. Introduction
Load-bearing tissues (e.g., ligament, heart valve leaflet) are dependent on their underlying structures for proper function. In fibrous soft tissues, the structural anisotropy of collagen fibers in the extracellular matrix is a major determinant of the tissue’s mechanical response. When that structure is altered, as in disease or injury, the tissue’s mechanical performance and functionality are diminished. Although the importance of microstructure in controlling tissue function is well known, how a tissue’s precise composition and structure gives rise to its functionality, and how that functionality is affected by alterations in that structure from disease and damage, remain difficult questions to answer. Part of that difficulty lies in simultaneously characterizing a tissue’s mechanical behavior and obtaining sufficient microstructural information. Both pieces of information are essential for understanding how regional variation in extracellular matrix composition and organization contributes to the coordinated response of the tissue to mechanical loads, and for analyzing the large variability in the response of tissues in terms of basic principles. Thus, a method to extract region-specific anisotropic material properties on intact tissue samples would afford several advantages: (1) it could provide direct information on the mechanical function of healthy tissue subjected to complex physiologic loads, such as the supraspinatus tendon of the rotator cuff [1]; (2) it could identify regions within a tissue that exhibit irregular mechanical behavior in comparison to healthy tissue, allowing more accurate assessment of the injury or disease state (similar to isotropic elastography for tumor detection, [2,3]); and (3) because of the relationship between structural and mechanical anisotropy (e.g., [4]), it could serve as a surrogate for structural measurement in tissues that are not amenable to standard structural tests. In addition, many mechanically important tissues (e.g., heart valve leaflet [5,6], facet capsule ligament [7], and rat ventricular wall [8]) are small enough that dissection and testing of different sections of the sample would be difficult if not impossible. Therefore, a technique to analyze tests on a larger specimen and extract complex mechanical information about its different regions would be extremely valuable.
Our previous work [9] demonstrated that an inverse method based on the general linear model (, with six independent components of in two dimensions) could be used to extract mechanical information from simulated experiments on linear and nonlinear materials. In the current study, we test the method experimentally on isotropic polydimethylsiloxane (PDMS) samples and on anisotropic cell-compacted collagen cruciforms, which exhibit predictable regional variation in mechanical properties [4,10]. Thus, the objective of this study was to determine whether our general anisotropic inverse method, applied to biaxial mechanical tests on tissue analogs, could reliably extract regional mechanical properties and distinguish among samples with different regional architectures.
2. Methods
2.1. Generalized Anisotropic Inverse Mechanics.
In a previous work [9], we presented a generalized anisotropic inverse mechanics (GAIM) method for soft tissues. Summarized briefly, the technique involves solving the Cauchy stress balance ((Eq. (1)) in the tissue directly for the unknown components of the general linear elasticity tensor :
| (1) |
where the strains are known throughout the tissue, and appropriate boundary conditions are applied based on experimental force measurements. Throughout this study, we use the linear, anisotropic model in two dimensions (2D). Full-field displacements and boundary forces from biaxial extension tests are used to determine the components as a function of position by partitioning the domain into subdomains over which is assumed constant. The domain partitioning is determined by probing various choices of homogeneous subdomains starting from the gripped boundary, removing the solved elements from the domain, and advancing inwards by repeating this process on the reduced domain with resultant forces from the solved partitions. Direct calculation of parameters allows for rapid computation, and 95% confidence intervals provide an estimate of the model’s performance. As noted in Ref. [9], multiple experiments are necessary in order to make the problem well-posed. The linear model equations are solved for all experiments combined in a least-squares sense. Strain eigentensors and Kelvin moduli (see appendix for details) are computed from the six components of in each partition and are indicative of the preferred fiber orientation and stiffness, respectively. We convert the principal values of the strain eigentensor corresponding to the largest Kelvin modulus into a measure of degree of alignment similar to the normalized retardation in polarized light microscopy [4]
| (2) |
Hence, the range of values for vary from 0 (for an isotropic sample) to 1 (for a completely aligned sample). An alignment map is generated from the major anisotropy direction and value of over each partition. The vectors in the alignment map indicate the direction of alignment, and the vector lengths are scaled according to the value. The value of is also used for the background contour in the alignment map to indicate the degree of anisotropy. A stiffness map is also generated by plotting the largest Kelvin modulus over each partition.
2.2. Sample Preparation.
In previous work we were able to demonstrate the utility of GAIM in analyzing material anisotropy and heterogeneity for simulated data. In this study we apply the method to in vitro model systems in a step-wise fashion starting with a homogeneous, isotropic PDMS sample, followed by a heterogeneous, isotropic sample, and ending with a heterogeneous, anisotropic tissue analog.
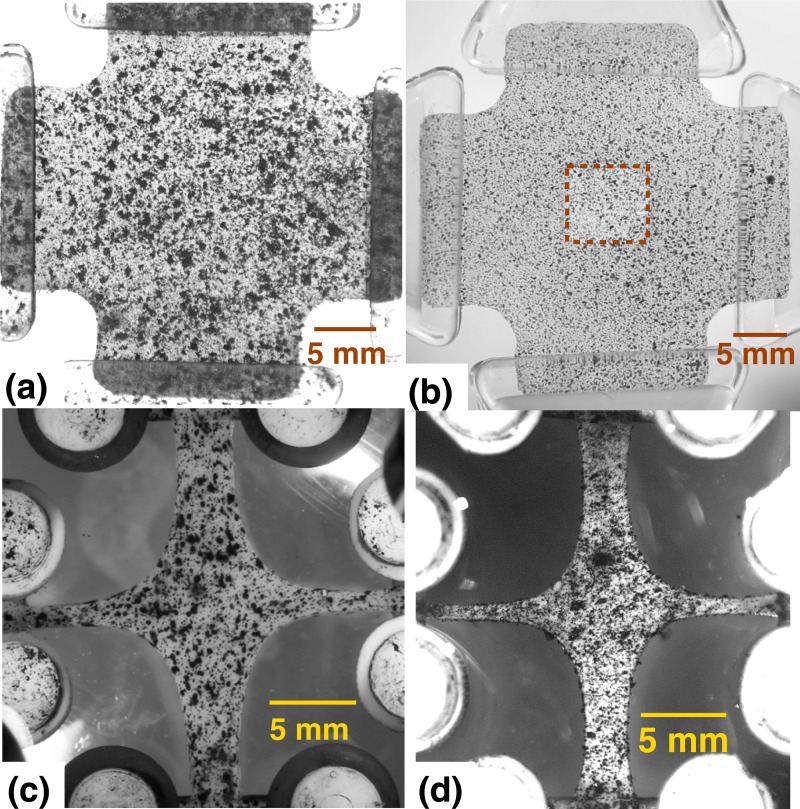
Homogeneous, isotropic samples (Fig. 1(a)) were prepared by casting polydimethylsiloxane (PDMS) gels in a cruciform mold. PDMS solution (Sylgard ® 184 Silicone Elastomer Kit; Dow Corning) was made by mixing the curing agent and base at a 1:10 ratio. Rice flour was added to the mixture to opacify the clear polymers for better visualization. The mixture was poured into an aluminum mold of cruciform geometry. The PDMS solution was left open to the atmosphere and allowed to cure overnight at room temperature. The final sample was approximately 15 mm square in the center with 7.5 mm wide arms, and it was 2.1 mm thick throughout.
Fig. 1.
Samples with visual texture added for strain tracking: (a) PDMS cruciform (isotropic, homogeneous) textured with graphite powder. (b) PDMS cruciform (isotropic, heterogeneous) textured with spray paint. The central square region is of one-tenth the surrounding thickness. (c) Collagen TE (anisotropic, heterogeneous) with arm-width ratio of 1:0.5 textured by Verhoeff stain and incubated for seven days. (d) Collagen TE sample similar to (c) but incubated for 11 days.
Heterogeneous, isotropic samples (Fig. 1(b)) were prepared by using a cruciform mold of identical geometry but with a square step in the center. As a result, this sample had a square depression (7 mm wide, 1.9 mm deep) in the center. Analyzed in 2D, the nonuniform thickness led to a compliant central region surrounded by a more stiff region.
Heterogeneous, anisotropic collagen tissue-equivalent (TE) cruciforms [4,11] were formed by seeding neonatal human dermal fibroblasts ( cells/mL) in a collagen gel-forming solution (initial collagen concentration of 1.5 mg/mL) as described in [10.12]. Briefly, 2.2 mg/mL of bovine dermal collagen (Organogenesis, Canton, MA), 1M 4-(2-hydroxyethyl)-1-piperazineethanesulfonic acid (HEPES, Cellgro, Manassas, VA), 0.1M NaOH, 10X Modified Eagle’s Medium (MEM, Sigma-Aldrich, St. Louis, MO), fetal bovine serum (FBS, HyClone, Logan, UT), and fibroblasts were mixed and cast into cross-shaped Teflon molds in which the fixtures needed for testing were already in place ([12]) so that all samples could be tested in the in-mold reference configuration. After gelation for 30 min at , high glucose DMEM (Invitrogen), supplemented with 10% FBS, 1% fungizone, 1% penicillin-streptomycin, 0.1% insulin, 50 /mL ascorbic acid (Sigma-Aldrich) and 1 ng/mL TGF-, was added to each sample and changed every 48 h. Samples with an arm-width ratio of 1:0.5 were made (Figs. 1(c) and 1(d)) and incubated for either 7 or 11 days. In contrast to a symmetric 1:1 cruciform where the center region is isotropic [10], the asymmetric 1:0.5 configuration produces moderate alignment in the center along the axis with wider arms. With longer incubation times we expect to observe increased alignment in the center due to continued cell-induced contraction and remodeling of the collagen network, resulting in samples with varying patterns of anisotropy. Since the collagen fiber-alignment of these samples can be confirmed by polarized light microscopy, these cell-compacted tissue analogs will serve as convenient tests cases for GAIM.
2.3. Polarimetry And Biaxial Testing.
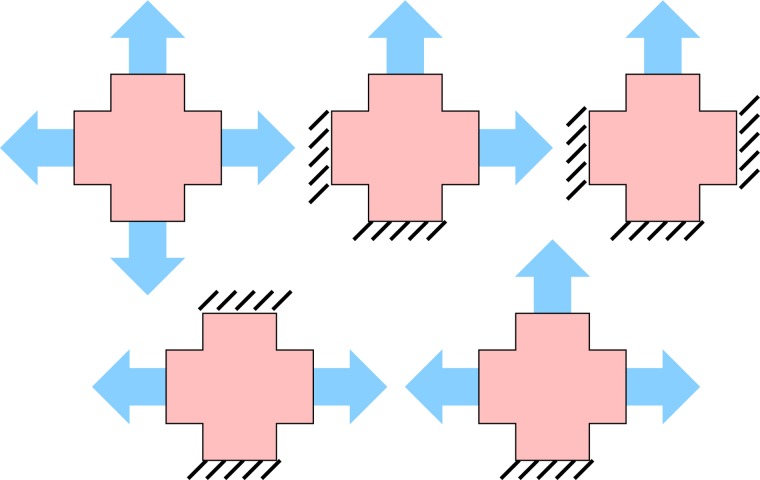
Prior to mechanical testing, polarized light microscopy (PLM) [13] was used to quantify the localized direction and strength of fiber alignment in the collagen TE samples. Visual texture (Fig. 1) was subsequently added to the samples to facilitate strain-tracking. Spray paint and Verhoeff’s stain were used for speckling the PDMS and TE samples, respectively. The samples were tested on an Instron planar biaxial testing unit. PDMS samples were tested in air and TE samples were tested while immersed in phosphate buffered saline (PBS) at room temperature. After a preload (0.01 N) had been applied to each of the four arms, the samples were preconditioned by nine equibiaxial stretch tests (7.5% stretch) and then loaded equibiaxially followed by cyclic combinations of asymmetric stretches holding one or more arms and stretching the others. A total of 15 tests were performed, giving all possible combinations of hold/stretch of the four arms except for the trivial four-way hold (Fig. 2). Typical extension ratios for equibiaxial and asymmetric tests were 7.5% and 11.3%, respectively. Each loading and unloading cycle lasted ten seconds. Grip displacement rates of all samples tested ranged from 0.19–0.35 mm/sec and were set so as to apply the desired extension in five seconds. Grip forces and images were acquired for all tests. The grip force data for all loading cycles were zeroed with respect to the preload.
Fig. 2.
Each of the four arms of the cruciform sample are either extended or held fixed. A total of fifteen biaxial tests are performed by these five basic protocols: equibiaxial (1), two-adjacent arms (4), single arm (4), strip biaxial (2), and three arms (4), where the number in parenthesis represents the number of cyclic permutations of each test.
2.4. Strain Tracking.
Grayscale images of the continuous tissue deformation were analyzed by digital image correlation (DIC). The domain of the sample before the start of the loading, which was treated as the undeformed configuration, was meshed in Abaqus® and mapped onto the images. Custom software developed based on the iterative Newton-Raphson method for sub-pixel displacements [14] was used to calculate the displacement field. The displacement fields were smoothed prior to computing strains.
3. Results
3.1. Homogeneous, Isotropic.
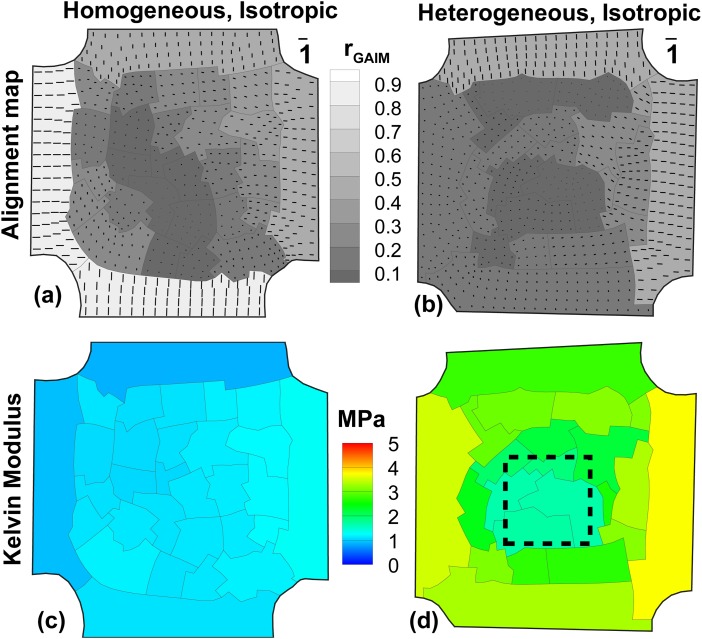
Using the boundary forces and displacement fields from all fifteen tests on the PDMS sample of uniform thickness, GAIM automatically partitioned the domain into 30 regions. The alignment map (Fig. 3(a)) shows that partitions in the belly region of the cruciform are in the isotropic range as expected. The higher anisotropy values in the arms are believed to be due to the reduced accuracy in determining the transverse component of the elastic tensor at the arms. However, this is not a factor for the belly region where GAIM successfully identified the isotropy.
Fig. 3.
GAIM alignment maps (a,b) and Kelvin moduli plots (c,d) for isotropic PDMS samples. The length of vectors in (a,b) is the relative anisotropy in each partition. (a) Homogeneous sample shows low anisotropy values at the belly, indicating a largely isotropic sample. (b) Heterogeneous sample also shows low anisotropy, indicating an isotropic sample. (c) Homogeneous sample has uniform values in Kelvin modulus at the belly. (d) Heterogeneous sample shows a relatively compliant region at the center which corresponds to the location of the thin section (shown in dashed lines).
The contour of the largest Kelvin modulus (Fig. 3(c)) is nearly uniform (0.88–1.29 MPa) over the sample. In particular, the belly region has negligible variation (1.06–1.25 MPa) in Kelvin modulus, indicating homogeneity. Hence, GAIM successfully identified the isotropy and homogeneity in the belly of the sample.
In order to validate the stiffness predicted by GAIM, we prepared dog-bone shaped PDMS samples by the same procedure used for the cruciforms. The dog-bone samples were tested uniaxially after being textured for strain tracking. The value of Young’s modulus for this material was found from the force-displacement curve and the homogeneous strain value in the center of the dog-bone sample. We calculated the Young’s modulus to be 0.97 MPa and obtained a corresponding Kelvin modulus of 1.2 MPa. These values are in good agreement to the Kelvin moduli values at the belly of the homogeneous cruciform predicted by GAIM (1.06–1.25 MPa) and the equivalent Youngs moduli of 0.82–1.1 MPa.
3.2. Heterogeneous, Isotropic.
Generalized anisotropic inverse mechanics (GAIM) automatically partitioned the heterogeneous PDMS sample into 22 regions. The alignment map (Fig. 3(b)) shows the belly region to be isotropic () with an average anisotropy value of 0.14. The contour of Kelvin modulus (Fig. 3(d)) shows a range of values between 1.7–3.7 MPa over the entire sample. The central region corresponding to the thin section (box with dashed lines) was measured to be more compliant ( MPa) than the surrounding region at the belly ( MPa).
3.3. Heterogeneous, Anisotropic.
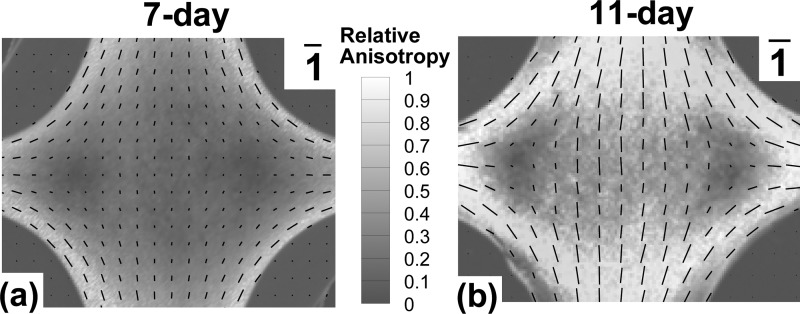
Polarized light microscopy on the 7-day cruciform (Fig. 4(a)) showed high fiber alignment at the arms and boundaries as indicated by the large retardation values. The direction of alignment was along the arms and curved edges. The retardation values decreased from the boundaries towards the belly where the sample was largely isotropic. In contrast, the 11-day cruciform (Fig. 4(b)) had a central region that was moderately aligned with the wider arms. Two isotropic zones were present away from the center and towards the smaller arms (cf [10].).
Fig. 4.
Polarized light alignment maps for 1:0.5 collagen TE incubated for 7 and 11 days shows variation in sample anisotropy from isotropic to completely aligned. Retardation from PLM is a measure of the strength of fiber alignment (high retardation values indicate high alignment). The contour shows the normalized retardation from polarimetry and the vectors indicate the direction of alignment with vector lengths corresponding to the normalized retardation value. (a) 7-day sample shows high alignment at arms and curved ends while most of the belly is less aligned. (b) 11-day shows moderate alignment in center along the wide axis, two isotropic regions offset from the center, and strong alignment at arms and curved ends.
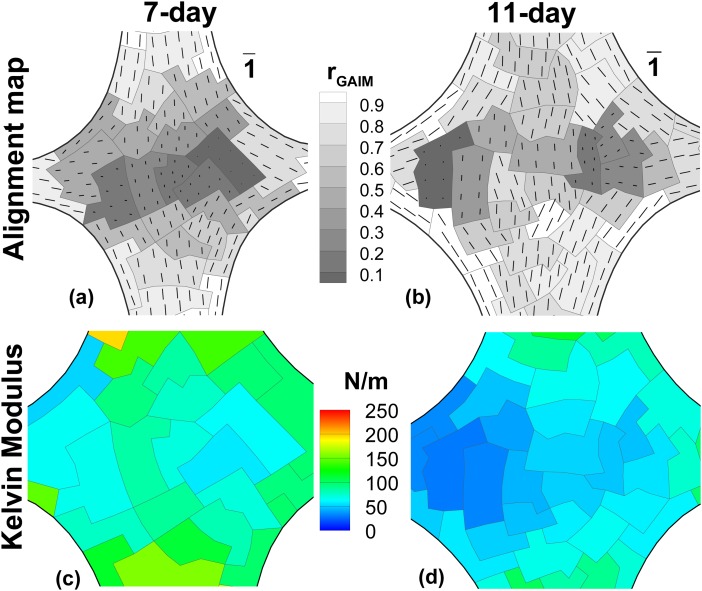
GAIM automatically partitioned the domains and generated the alignment maps shown for the belly region in Figs. 5(a) and 5(b). Similar to alignment maps from polarimetry, the contour shows the anisotropy evaluated from Eq. (2), and the vectors show the alignment direction with lengths scaled according to the anisotropy value. The alignment map for the 7-day cruciform showed that the arms and curved edges were highly aligned in comparison to the center region, matching the general trend in regional changes in alignment observed in the polarimetry data, but with sharper changes in the anisotropy values at regional boundaries. GAIM also predicted well the alignment in the 11-day cruciform, including moderate alignment along the wider axis and two regions of isotropy in the center region.
Fig. 5.
GAIM alignment maps and Kelvin modulus plots for 7-day and 11-day TE samples. The alignment maps from GAIM are indicative of the mechanical anisotropy of all elements in each partition. Alignment map for 7-day (a) and 11-day (b) samples show similar patterns to polarized light data, namely a large isotropic region for the 7-day, and increased alignment at 11-days. (c) Kelvin modulus (surface tension) plot for 7-day sample shows a range of values from 50-160 N/m at the belly. (d) Kelvin modului (surface tension) for 11-day sample are evaluated to be within 30-85 N/m at the belly.
Within the first few days of culture, the fibroblasts compacted the collagen gels and significantly reduced both sample volume and thickness by day 11. While the 11-day sample had 27% less area (measured from images) than the 7-day sample, we were not able to reliably detect differences in sample thickness between them. Hence, we report the largest Kelvin moduli expressed as surface tension for both the samples (Figs. 5(c) and 5(d)). Moduli values at the belly ranged from 50–160 N/m for the 7-day sample, and 30–85 N/m for the 11-day sample. While the large apparent reduction in modulus with increasing compaction time is unexpected, we believe that it is possibly due to sample environment variability since both samples were prepared from different cell batches and tested on different days.
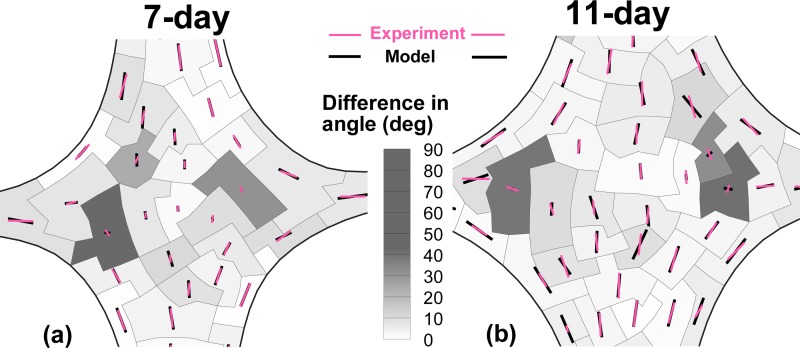
Figures 6(a) and 6(b) show the comparison of the alignment map predicted by GAIM to the measured values from polarized light microscopy. The retardation and alignment directions from PLM were vector-averaged for each partition and the contours in the figures show the magnitude of the difference in angles between GAIM and PLM. Partitions with large error in angle corresponded to regions that were isotropic. For a state of isotropy there is no preferred direction and hence any reported angle of orientation is acceptable. Disregarding the isotropic partitions, the mean error in angle at the belly was and for the 7-day and 11-day samples, respectively.
Fig. 6.
Comparison of alignment maps generated by the model (GAIM) and the experiment (polarized light microscopy) for 7-day and 11-day TE samples. The retardation and fiber alignment data from PLM were vector-averaged over each partition. The contour in the figures show the magnitude of difference in alignment angles between GAIM and PLM. The vectors indicate the relative anisotropy with the length given by the value of (for model) and averaged retardation (for experiment) in each partition. The length of the vectors in the legend indicate the maximum anisotropy of 1. There is excellent match between the alignments from model and experiments. The regions with large differences in angles correspond to largely-isotropic partitions where any angle is acceptable since there is no preferred direction.
4. Discussion
GAIM successfully identified regional variation in anisotropy and stiffness in simple synthetic and cell-populated gel systems. For the heterogeneous PDMS sample, the perceived relative stiffness ratio between the thin section and its surrounding (0.6) was much larger than the thickness ratio of the sample (0.1). This apparent inconsistency is due primarily to through-thickness shear in the sample, which cannot be measured when the 3D sample is imaged and analyzed in 2D. A 3D Abaqus® simulation of equibiaxial stretch on the sample yielded a strain ratio of 0.56 on the top surface, confirming that the apparent stiffness ratio is not the thickness ratio. The reduced 2D strains on the top surface result in the sample being perceived as more stiff, leading to higher estimates of Kelvin modulus in comparison to the value obtained from the validation tests on dog-bone samples (1.2 MPa). When applying the method to tissues, one must therefore be aware of potential artifact due to sharp changes in sample thickness. Despite the significant out-of-plane shear which is obviously undetectable by a 2D method, GAIM successfully identified that there was little variation in sample isotropy, and detected regional differences in sample stiffness with sufficient accuracy. For the fibroblast-compacted gels, GAIM tracked changes in mechanical anisotropy comparable to the structural changes measured by polarized light. The anisotropy direction predicted by GAIM matched closely with the fiber alignment direction from PLM, and the anisotropy value correlated well with the average retardation in each partition. GAIM further provided regional stiffness information not measured previously.
While the linear model does not account for the nonlinear, hyperelastic nature of soft tissues or the fiber kinematics, it was shown in the earlier work [9] and further demonstrated here that it is sufficient to capture the degree and direction of anisotropy with reasonable accuracy. Similar to the isotropic assumption for tumor identification by elastography, or the homogeneity assumption for nonlinear material constitutive characterization from biaxial tests, it is sufficient to represent the tissue by a linear model for the purpose of identifying regional changes in anisotropy.
Certain shortcomings were also clear from this study. Artifacts arose near the grips because of poor specification of the boundary forces. Our load cells measure the forces only in the direction of pull; hence we must discard the equations corresponding to shear forces at the grips. The lack of transverse force and the minimal transverse displacement in the arms combine to make the linear equation system for the arms poorly conditioned. As a result, the transverse components of (e.g., and for an arm pointing in the one direction) are consistently underestimated. While the reduced accuracy at the arms is not a factor for the solution in the belly, this problem could be reduced by measuring shear as well as normal forces. Also, it is necessary to specify a large set of displacements to ensure well-posedness of the inverse problem, and even then, because the grips move only in one direction, it can be difficult to generate shear strains throughout the sample. In contrast to the preference for homogeneous strain fields and symmetric loading in conventional methods of parametric inversion from biaxial testing, the inverse problem in GAIM is better conditioned by heterogeneous strain fields. Consequently, gripping the sample with clamps instead of hooks or sutures (cf [15].) and asymmetry in loading and sample shape are beneficial. Fortunately these requirements make mechanical testing of soft tissues easier to perform.
A possible source of error with the biaxial testing could be with the serial mechanical testing protocol and the associated changes in the sample that occur with each loading condition. While we took steps to minimize the effect by preconditioning the samples and subjecting them to the same order of testing, these effects will require further investigation. With four arms of the biaxial test where each arm can be either stretched or held fixed, we have used the full set of 15 possible loading configurations to obtain a rich data set for the inversion. GAIM is better conditioned by providing more information and hence more protocols would be beneficial. There is, however, some redundancy, and it might be possible to eliminate some tests; it also might be possible to improve performance by adding different tests (e.g., a 2:1 extension ratio biaxial test). The key is to obtain as broad a range of deformations in each region within the sample with the minimum number of tests. The optimal protocol might also depend on the nature of the sample (e.g., a very fragile sample would not stand up to too many tests).
Our current partitioning method does not optimize the shape and size of the partitions. The anisotropy value and alignment direction evaluated for each partition represents the best fit to the mechanical response of all its elements. Although our automatic partitioning scheme (described in Ref. [9]) captured the general trends well, a better set of partitions could be generated manually based on knowledge of the sample. When we did so for the collagen cruciforms (data not shown), the match between GAIM and polarized light was markedly improved. Thus, we must conclude that improvements in the automatic partitioning are possible.
There are numerous studies (e.g., [1,16]) in which regional tissue properties were obtained by cutting small samples from different regions of a larger tissue. While this approach has yielded valuable information, it is hindered by damage from dissection and limits on how small a sample can be. In spite of the challenges mentioned in the preceding paragraphs, our study shows that GAIM has the potential to be a new tool for mechanical evaluation of complex tissues.
Acknowledgment
We thank Masano Sugiyama, Morgan Boes and Charles James for help with preparing and testing the samples, and the Minnesota Supercomputing Institute for the computing resources. This work was supported by NIH Grant No. R21-EB-009788.
Appendix: Eigentensors of Linear Elastic Anisotropic Materials
In this section we summarize the theory of eigentensors of linear elastic anisotropic materials which is relevant for our application to obtain a visual representation of anisotropy. Further details of the theory are available in Refs. [17,19]. The 4th-rank linear elastic tensor can be compacted into a 2D matrix form using the major and minor symmetries as
| (A1) |
This compacted form of can be converted into a 2nd-rank tensor by the following transformation:
| (A2) |
Rewriting Eq. (A2) in matrix form for the transformed matrices and vectors:
| (A3) |
The eigenvalue states of represent symmetry states in which converts a strain vector into a parallel stress vector by
| (A4) |
| (A5) |
The eigenvalues are denoted as the Kelvin moduli ( for 2D). The eigenvectors , when projected back into Cartesian tensor form are termed as strain eigentensors and the corresponding stresses are stress eigentensors. For instance, if the normalized strain eigenvector is then the corresponding strain eigentensor is given by
| (A6) |
For the case of fibrous materials based on an underlying fiber distribution and mean orientation, the major principal direction of the strain eigentensor of the largest Kelvin modulus corresponds to the preferred fiber orientation.
Contributor Information
Colleen Witzenburg, Department of Mechanical Engineering, University of Minnesota, Minneapolis, MN 55455.
Victor H. Barocas, e-mail: baroc001@umn.edu, Department of Biomedical Engineering, University of Minnesota, Minneapolis, MN 55455
References
- [1]. Lake, S. P. , Miller, K. S. , Elliott, D. M. , and Soslowsky, L. J. , 2010, “Tensile Properties and Fiber Alignment of Human Supraspinatus Tendon in the Transverse Direction Demonstrate Inhomogeneity, Nonlinearity, and Regional Isotropy,” J. Biomech., 43(4), pp. 727–732. 10.1016/j.jbiomech.2009.10.017 [DOI] [PMC free article] [PubMed] [Google Scholar]
- [2]. Insana, M. F. and Bamber, J. C. (ed), 2000, “Tissue Motion and Elasticity Imaging,” Phys. Med. Biol., 54(3), pp. 1409–1713. 10.1088/0031-9155/45/6/001 [DOI] [PubMed] [Google Scholar]
- [3]. Richards, M. S. , Barbone, P. E. , and Oberai, A. A. , 2009, “Quantitative Threedimensional Elasticity Imaging from Quasi-Static Deformation: A Phantom Study,” Phys. Med. Biol., 54(3), p. 757–779. 10.1088/0031-9155/54/3/019 [DOI] [PMC free article] [PubMed] [Google Scholar]
- [4]. Sander, E. A. , Stylianopoulos, T. , Tranquillo, R. T. , and Barocas, V. H. , 2009, “Image-based Multiscale Modeling Predicts Tissue-Level and Network-Level Fiber Reorganization in Stretched Cell-Compacted Collagen Gels,” Proc. Natl. Acad.Sci. U. S. A., 106(42), pp. 17675–17680. 10.1073/pnas.0903716106 [DOI] [PMC free article] [PubMed] [Google Scholar]
- [5]. Stella, J. A. , and Sacks, M. S. , 2007, “On the Biaxial Mechanical Properties of the Layers of the Aortic Valve Leaflet,” J. Biomech. Eng., 129(5), pp. 757–766. 10.1115/1.2768111 [DOI] [PubMed] [Google Scholar]
- [6]. Doehring, T. C. , Kahelin, M. , and Vesely, I. , 2005, “Mesostructures of the Aortic Valve,” J. Heart Valve Dis., 14(5), pp. 679–686. [PubMed] [Google Scholar]
- [7]. Quinn, K. P. , and Winkelstein, B. A. , 2008, “Altered Collagen Fiber Kinematics Define the Onset of Localized Ligament Damage During Loading,” J, Appl, Physiol, 105(6), pp. 1881–1888. 10.1152/japplphysiol.90792.2008 [DOI] [PubMed] [Google Scholar]
- [8]. Ott, H. C. , Matthiesen, T. S. , Goh, S.-K. , Black, L. D. , Kren, S. M. , Netoff, T. I. , and Taylor, D. A. , 2008, “Perfusion-Decellularized Matrix: Using Nature’s Platform to Engineer a Bioartificial Heart,” Nat. Med., 14(2), pp. 213–221. 10.1038/nm1684 [DOI] [PubMed] [Google Scholar]
- [9]. Raghupathy, R. and Barocas, V. H. , 2010, “Generalized Anisotropic Inverse Mechanics for Soft Tissues,” J. Biomech. Eng., 132(8), p. 081006. 10.1115/1.4001257 [DOI] [PubMed] [Google Scholar]
- [10]. Jhun, C. S. , Evans, M. C. , Barocas, V. H. , and Tranquillo, R. T. , 2009, “Planar Biaxial Mechanical Behavior of Bioartificial Tissues Possessing Prescribed Fiber Alignment,” J. Biomech. Eng., 131(8), p. 081006. 10.1115/1.3148194 [DOI] [PMC free article] [PubMed] [Google Scholar]
- [11]. Sander, E. , Stylianopoulos, T. , Tranquillo, R. , and Barocas, V. , 2009, “Image-Based Biomechanics of Collagen-Based Tissue Equivalents,” IEEE Eng. Med. Biol. Mag., 28(3), pp. 10–18. 10.1109/MEMB.2009.932486 [DOI] [PMC free article] [PubMed] [Google Scholar]
- [12]. Sander, E. A. , Barocas, V. H. , and Tranquillo, R. T. , 2010, “Initial Fiber Alignment Pattern Alters Extracellular Matrix Synthesis in Fibroblast-Populated Fibrin Gel Cruciforms and Correlates with Predicted Tension,” Ann. Biomed. Eng., 39(2), pp. 714–729. [DOI] [PMC free article] [PubMed] [Google Scholar]
- [13]. Tower, T. T. , Neidert, M. R. , and Tranquillo, R. T. , 2002, “Fiber Alignment Imaging During Mechanical Testing of Soft Tissues,” Ann. Biomed. Eng., 30(10), pp. 1221–1233. 10.1114/1.1527047 [DOI] [PubMed] [Google Scholar]
- [14]. Pan, B. , Asundi, A. , Xie, H. , and Gao, J. , 2009, “Digital Image Correlation Using Iterative Least Squares and Pointwise Least Squares for Displacement Field and Strain Field Measurements,” Optics and Lasers in Engineering, 47(7-8), pp. 865 – 874. 10.1016/j.optlaseng.2008.10.014 [DOI] [Google Scholar]
- [15]. Sun, W. , Sacks, M. S. , and Scott, M. J. , 2005, “Effects of Boundary Conditions on the Estimation of the Planar Biaxial Mechanical Properties of Soft Tissues,” J. Biomech. Eng., 127(4), pp. 709–715. 10.1115/1.1933931 [DOI] [PubMed] [Google Scholar]
- [16]. O’Connell, G. D. , Guerin, H. L. , and Elliott, D. M. , “Theoretical and Uniaxial Experimental Evaluation of Human Annulus Fibrosus Degeneration,” J. Biomech. Eng. 131(11), pp. 111007. 10.1115/1.3212104 [DOI] [PMC free article] [PubMed] [Google Scholar]
- [17]. Thomson, W. , 1856, “Elements of a Mathematical Theory of Elasticity,” Phil. Trans. R. Soc. London, 146, pp. 481–498. 10.1098/rstl.1856.0022 [DOI] [Google Scholar]
- [18]. Mehrabadi, M. M. , and Cowin, S. C. , 1990, “Eigentensors of Linear Anisotropic Elastic Materials,” Q. J. Mech. Appl. Math., 43(1), pp. 15–41. 10.1093/qjmam/43.1.15 [DOI] [Google Scholar]
- [19]. Cowin, S. C. , and Mehrabadi, M. M. , 1995, “Anisotropic Symmetries of Linear Elasticity,” Appl. Mech. Rev., 48(5), pp. 247–285. 10.1115/1.3005102 [DOI] [Google Scholar]


