INTRODUCTION
With the vast amount of genomic and proteomic data available, bioinformaticists play a vital role in mining and analyzing data. In addition, bioinformatics is an important component of many fields of biological research including plant, animal, and environmental health, genetics, microbiology, and biochemistry. Therefore, it is increasingly important that students understand not only what can be learned from these data, but also how to use basic bioinformatics tools. This computer-based laboratory or classroom activity not only introduces annotation tools, but also allows students to apply their understanding of the structure and function of a gene and its role in central dogma to a part of the Escherichia K12 genome. These are key concepts for both secondary and undergraduate students when understanding core biological ideas like “structure and function” (1–3). In addition, this is a hands-on activity, meant to help engage students in the learning process and address different learning styles (3).
PROCEDURE
Introduction to basic gene structure
The outcome of the bioinformatics activity is to identify and predict the function of three genes (the lac operon) in E. coli. Before beginning, it is helpful to address the learning goals identified in Table 1. Students should also become familiar with the key components of a bacterial gene (Table 2). Appendix 1 describes a hands-on activity to introduce these learning goals and key concepts. In brief, this activity asks students to first examine a short nucleotide sequence. They identify and define the key structures in the gene within this sequence. This includes the promoter, transcription start and stop site, the Shine-Dalgarno region, and translation start and stop site. They plot these sequences onto the larger sequence and are asked several questions to help correlate the location of these sequences with the process of transcription and translation. By physically marking and identifying these regions, it is hoped that they better retain and understand their role in gene expression.
TABLE 1.
Learning goals: Introduction to bacterial gene structure.
| Learning Goals: Bacterial Gene Structure |
|---|
|
TABLE 2.
Key components of a bacterial gene.
| Term | Definition |
|---|---|
| Promoter | Two conserved gene sequences −10 and −35 nucleotides upstream from transcription initiation. Site for RNA polymerase (sigma factor) recognition and binding. |
| Start Site for Transcription | Site where transcription is initiated by RNA polymerase (+1). |
| Stop Site for Transcription | Site where transcription is terminated. RNA polymerase falls off of the DNA. |
| Shine-Dalgarno | Binding site for small ribosome to initiate translation. |
| Start Site for Translation | Site where first tRNA (i.e. amino acid) is added to initiate peptide chain formation. |
| Stop Site for Translation | Stop codon that signals translation termination. |
Application of the central dogma to a genome sequence
Using only a computer with internet access, students can now apply their knowledge of gene structure and the central dogma to a bioinformatics exercise. The learning goals are highlighted in Table 3. Students are assigned an “unknown” sequence that is approximately 5,500 nucleotides long (Appendix 2). Students follow the directions and work through the handout provided in Appendix 3. This handout provides the guidelines for completing a simple annotation of three genes from identification of the open reading frames with a gene finder program, to BLAST (Basic Local Alignment Search Tool; http://blast.ncbi.nlm.nih.gov/Blast.cgi?CMD=Web&PAGE_TYPE=BlastHome) and Eco-Cyc analysis. Briefly, students open the sequence in Artemis, a gene finder program freely available from the Wellcome Trust Sanger Institute (http://www.sanger.ac.uk/resources/software/artemis; 7). Within the program, three open reading frames are identified. Students further examine the potential translational start sites, look for Shine-Dalgarno regions in front of each gene, and a promoter. Because all three genes are part of an operon, they should find only one promoter and are asked to address why this is possible. The identification of the promoter as well as all Shine-Dalgarno sequences encourages students to think about the regulation of gene expression and what gene structures are required for this process. This correlates well with the introductory exercise as described above.
TABLE 3.
Learning goals: Bioinformatics analysis of bacterial genes.
| Learning Goals: Bioinformatics |
|---|
|
Following identification and structural analysis of the three genes, students continue the annotation process and determine the putative function of the encoded proteins (Appendix 3). Students copy their protein sequences from Artemis to continue analysis in BLAST sponsored by the National Center for Biotechnology Information. Here, they use a database to look for protein homologies of known function in other organisms. Upon completion, students should recognize protein similarity to β-galactosidase, β-galactosidepermease, and β-galactosidetransacetylase, proteins encoded within the lac operon. Depending on the level being taught, students may be familiar with these proteins. However, if unfamiliar, this is an opportunity to further discuss the function of these proteins and the role they play in a living organism. Students are directed to Eco-Cyc, a database designed to provide a system-wide functional understanding of the molecular components of E. coli(6). Here, students can research not only the function of these three proteins, but also how they are regulated. Within the handout are several guiding questions to help students address the regulation and role these proteins play in the life of a bacterium.
Tips
This exercise works well as an in-class activity so any technological issues can be quickly resolved. Students can work individually or in groups.
The lac operon may be substituted with sequences from any bacterial genome to make the activity more relevant to class discussions.
Extension
For advanced students, this activity has several extensions:
The materials provided here only introduce the BLAST program. Kerfeld and Scott have highlighted many pedagogical opportunities when working with BLAST (4).
Upon completion, students can apply their newly learned bioinformatics skills to additional annotation assignments. For example, students can conduct authentic analysis of newly identified genes in real bacterial genomes through the Undergraduate Research in Microbiology Genomic Analysis program, sponsored by the Department of Energy Joint Genome Institute (http://www.jgi.doe.gov/education) (5).
This material can instigate discussions on gene regulation and the lac operon.
Compare and contrast exercises can help demonstrate differences in basic gene structure and the central dogma in eukaryotes and prokaryotes.
CONCLUSION
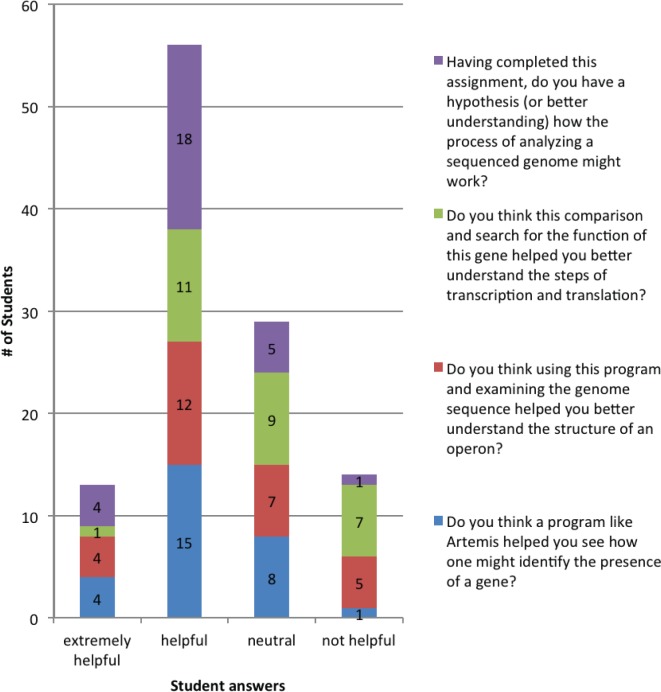
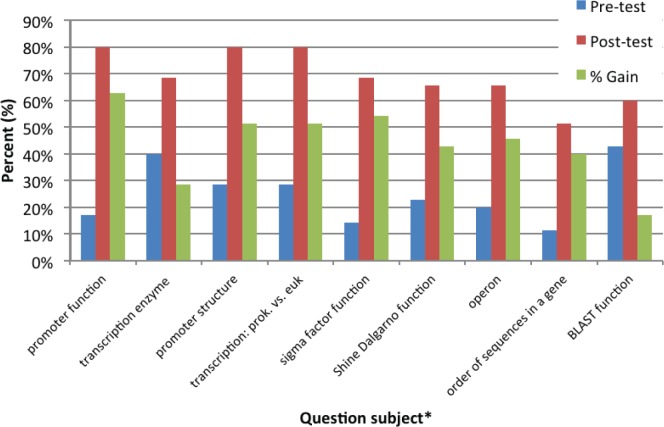
This activity has been presented to undergraduate students in an introductory and upper-level microbiology course (36 students each). Upon evaluation by the upper-level microbiology students, results were very positive (Fig. 1). Most promising is that more than 78% felt the activity helped them better understand the process of analyzing a genome. Those students that selected “neutral” or “not helpful” either found difficulty with the technology (the activity was completed outside of class) or wished more material had been presented before the activity. Positive written comments also reflected their appreciation of a hands-on activity to address different learning styles (Table 4). In addition, initial analysis of the learning gains for this course suggests that the activity is beneficial (Fig. 2). Upon completion of the activity, learning gains increased by as little as 17 % and upwards of 63%, depending on the concept tested. Please note, these students were also asked to annotate two additional genes before attempting the posttest. This suggests additional practice with annotation may play a role in these learning gains.
FIGURE 1.
Upper-level microbiology class evaluation of the bioinformatics activity.
TABLE 4.
Student reflections on learning regarding the bioinformatics activity.
| Student Reflections |
|---|
| “I am a visual learner so this was a good hands on approach to the material.” |
| “[I] felt visually viewing the genome on the Artemis program and then seeing how it was converted to proteins using the BLAST program really helped me to understand what it means to evaluate a genome.” |
| “. . . helpful to figure it out by doing an activity.” |
FIGURE 2.
Learning gains by students upon completion of the bioinformatics activity. *Complete questions are provided in Appendix 4.
These largely positive data suggest this activity may benefit the learning and understanding of basic principles in gene structure, function, and bioinformatics.
SUPPLEMENTAL MATERIALS
Appendix 1: What is a gene? - Student activity and answer key
Appendix 2: Unknown sequence
Appendix 3: Interpret a genome - Student activity and answer key
Appendix 4: Assessment questions
Acknowledgments
The author declares that there are no conflicts of interest.
REFERENCES
- 1.American Association for the Advancement of Science . Vision and change in undergraduate biology education: a call to action. American Association for the Advancement of Science; Washing ton DC: 2009. http://visionandchange.org/files/2011/03/VC-Brochure-V6-3.pdf. [Google Scholar]
- 2.Committee on Conceptual Framework for the New K-12 Science Education Standards and the National Research Council . A framework for K-12 science education: practices, crosscutting concepts, and core ideas. The National Academies Press; Washington, DC: 2012. http://www.nap.edu/catalog.php?record_id=13165. [Google Scholar]
- 3.Donovan MS, Bransford JD, editors. How students learn: science in the classroom. The National Academies Press; Washington, DC: 2005. http://www.nap.edu/catalog.php?record_id=11102. [Google Scholar]
- 4.Kerfeld CA, Scott KM. Using BLAST to teach E-value-tionary. PLoSBiol. 2011;9:e1001014. doi: 10.1371/journal.pbio.1001014. PloS Biol. 9. http://www.plosbiology.org/article/info:doi%2F10.1371%2Fjournal.pbio.1001014. [DOI] [PMC free article] [PubMed] [Google Scholar]
- 5.Kerfeld CA, Simons RW. The undergraduate genomics research initiative. PLoSBiol. 2007;5:e141. doi: 10.1371/journal.pbio.0050141. PloS Biol. 5. http://www.plosbiology.org/article/info%3Adoi%2F10.1371%2Fjournal.pbio.0050141. [DOI] [PMC free article] [PubMed] [Google Scholar]
- 6.Keseler IM, et al. EcoCyc: a comprehensive database of Escherichia colibiology. Nucleic Acids Res. 2011;39:D583–D590. doi: 10.1093/nar/gkq1143. [DOI] [PMC free article] [PubMed] [Google Scholar]
- 7.Rutherford K, et al. Artemis: sequence visualization and annotation. Bioinformatics. 2000;16:944–945. doi: 10.1093/bioinformatics/16.10.944. [DOI] [PubMed] [Google Scholar]
Associated Data
This section collects any data citations, data availability statements, or supplementary materials included in this article.
Supplementary Materials
Appendix 1: What is a gene? - Student activity and answer key
Appendix 2: Unknown sequence
Appendix 3: Interpret a genome - Student activity and answer key
Appendix 4: Assessment questions


