Abstract
Hosts of soybean rust (Phakopsora pachyrhizi) are sensitive to low temperatures, limiting this obligate parasite in the United States to overwintering sites in a restricted area along the Gulf Coast. This temperature sensitivity of soybean rust hosts allowed us to study spatial spread of epidemic invasions over similar territory for seven sequential years, 2005–2011. The epidemic front expanded slowly from early April through July, with the majority of expansion occurring from August through November. There was a 7.4-fold range of final epidemic extent (0.4 to 3.0 million km2) from the year of smallest final disease extent (2011) to that of the largest (2007). The final epidemic area of each year was regressed against epidemic areas recorded at one-week intervals to determine the association of final epidemic extent with current epidemic extent. Coefficients of determination for these regressions varied between 0.44 to 0.62 during April and May. The correlation coefficients varied between 0.70 and 0.96 from early June through October, and then increased monotonically to 1.0 by year's end. Thus, the spatial extent of disease when the epidemics began rapid expansion may have been a crucial contributor to subsequent spread of soybean rust. Our analyses used presence/absence data at the county level to evaluate the spread of the epidemic front only; the subsequent local intensification of disease could be strongly influenced by other factors, including weather.
Keywords: Plant pathogen, Disease spread, Long distance dispersal, Soybean rust
Introduction
Soybean rust, caused by the fungus Phakopsora pachyrhizi, is an exceptional model for studying the influence of initial focus size on the continental spread of disease caused by an air-borne pathogen (Li et al. 2010). Introduced to the U.S. in late 2004 (Schneider et al 2005), soybean rust overwinters in a restricted area along the Gulf Coast, primarily on kudzu (Pueraria montana var. lobata), owing to sensitivity of hosts to low temperatures. Epidemics expand rapidly from late July/early August through the late fall (Christiano and Scherm 2007, Isard et al. 2011), resulting in continental-scale spread of the disease that can be studied anew each year. Both the extent of overwintering and the final extent of subsequent epidemic spread have varied considerably each year from initial introduction until present (http://sbr.ipmpipe.org/cgi-bin/sbr/public.cgi). An extensive monitoring program (see Methods) provides data on the extent of disease spread throughout the year. A key missing component, however, is the ability to predict the annual extent of spread from overwintering areas (Pivonia et al. 2005; Christiano and Scherm 2007).
A range of biological invasions, including epidemics, have been successfully described as travelling waves with constant velocity determined by the invader's reproductive capacity and its exponentially bound dispersal kernel (e.g., Lambin et al. 1998; Bjornstad et al. 2002; Cummings et al. 2004; Grenfell et al. 2001; Johnson et al. 2006;). By contrast, organisms exhibiting substantial long distance dispersal (LDD) are better described by the power law and related “fat-tailed” dispersal kernels, which are not exponentially bound and result in accelerating invasion fronts (Ferrandino 1993; Kot et al. 1996; Clark et al. 2001; Hastings et al. 2005). Recent work has shown that a range of plant and animal pathogens demonstrating LDD have epidemic velocities that increase exponentially in time and linearly with distance (Mundt et al. 2009a,b). Because of the scale-invariant nature of the power law (Gisiger 2001), patterns of disease spread might be expected to repeat at different spatial scales for LDD pathogens. Indeed, a simple model of accelerating epidemic spread held over approximately six orders of spatial magnitude, from experimental field plots to continents (Mundt et al. 2009a,b).
Expansion of the epidemic front is independent of the size of the initial disease focus for travelling wave epidemics driven by exponentially bound dispersal kernels (Mollison 1977, Madden et al. 2007). By contrast, movement of epidemic fronts for accelerating epidemics driven by power law dispersal typical of pathogens with long distance dispersal (LDD) are multiplicatively related to the size of the initial focus (Madden et al. 2007, Mundt et al. 2009a,b). The size of the initial outbreak would therefore be strongly related to the final epidemic extent for epidemics caused by LDD pathogens. Studies of accelerating epidemics of a windborne plant pathogen show that the extent of disease spread increased with size of the initial focus in experimental plots (Mundt et al. 2011) and that these epidemics can scale to the size of the initial focus (Mundt et al. 2009a; Mundt and Sackett 2012). It is important to know if this effect of initial focus size holds at larger spatial scales and can be detected in natural epidemics, where environmental variables cannot be controlled through replication and randomization.
Identifying the key determinants of disease spread is crucial to the science of invasion biology and to managing invasive epidemics (Gewin, 2004; Smith, 2006; Riley, 2007). Life history, environment, and spatial variation all have potential to influence the spread of biological invasions (Clark et al. 2001; Hastings et al. 2005). The goal of our research was to use soybean rust as a model to determine if one such epidemic variable, size of the initial disease focus, is positively related to the final extent of continental disease spread caused by a LDD pathogen. To do so, we determined the relationship between the area of soybean rust over time and the final extent of disease spread in the U.S. and Canada each year from 2005 through 2011.
Methods
Data source
Data used for studying disease spread were obtained from the publically available website (http://sbr.ipmpipe.org/cgi-bin/sbr/public.cgi) of the USDA IPM PIPE (Integrated Pest Management Pest Information Platform for Extension and Education) program, which has been described by Isard et al. (2006, 2011) and is the most extensive data set available for spread of any plant disease (Sutrave et al. 2012). Data in the IPM PIPE derive from an extensive monitoring program designed to forewarn soybean growers of soybean rust spread. An important part of the system involves a network of sentinel soybean (Glycine max) plots that are monitored on a weekly to biweekly basis. Additional observations are derived from monitoring volunteer crop plants, naturally-occurring kudzu patches, less prevalent additional hosts (e.g., coral bean, jicama, Florida beggarweed), and commercial crop fields planted during the growing season. The system also records ad hoc positive detections uncovered by university personnel, farmers, and commercial crop consultants. Data are recorded for all hosts, which is mostly kudzu early in the season, with an increasing number of crop infections (almost entirely soybeans) as the season progresses.
In the IPM PIPE, soybean rust detections are available at the county level in the U.S. and Canada beginning in 2005, with monitoring in counties where soybean rust is likely to be present. We were unable to use detections in Mexico for our comparisons because reporting did not begin until 2007, but this is unlikely to have a large impact on the analyses (see Discussion). The maps display each county and are color-coded into one of four categories: i) not recently monitored; ii) recently monitored but no rust found; iii) rust found anywhere in the county on any host; and iv) rust not detectable but was found in a previous scouting. Categorization of infection status of a county begins anew each calendar year.
Disease spread was studied using the weekly maps shown in the “Observation Animations” of the IPM PIPE website (http://www.ceal.psu.edu/sbrcomparisons.htm). We constructed maps to calculate the cumulative extent of epidemic spread based on counties where soybean rust was detected on any host species on any date during that calendar year. Maps (http://sbr.ipmpipe.org/cgi-bin/sbr/public.cgi) were downloaded for weekly images dating from 6 April-28 December of each year. To construct isopleths of positive detections, counties at the leading edge of the epidemic each week were connected with a straight line if the resulting angle was convex (Fig. 1). Photoshop 7.0 (Adobe, San Jose, CA) was then used to fill the land area encompassed by the isopleths and the resulting maps were converted to jpeg files. WinCam 2000 (Regent Instruments, Inc., Quebec, Canada) was used to digitize the filled portions to provide relative areas of rust infection and to convert the number of pixels to square kilometers by calibrating the digitized map with geographic units of known size.
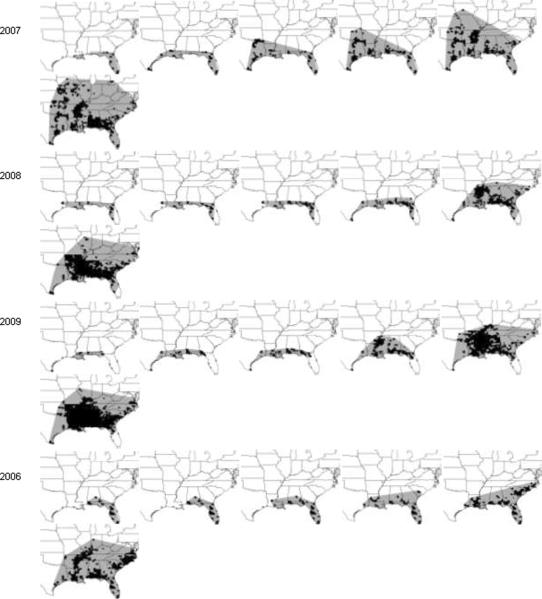
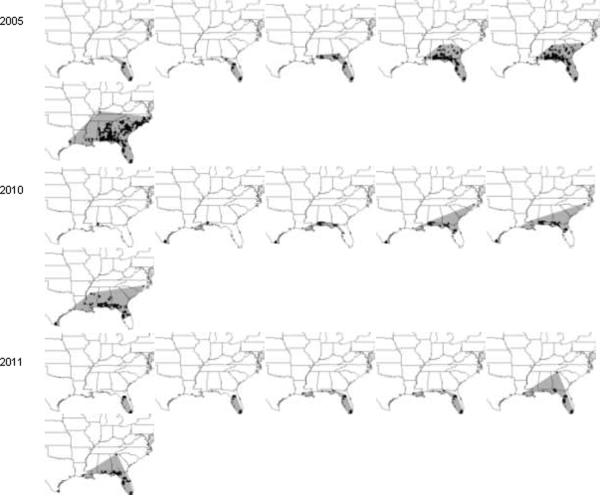
Fig. 1.
Maps of soybean rust spread in the U.S. and Canada, 2005–2010. Examples shown are for calendar weeks 20, 25, 30, 35, 40, and 52. Cumulative county-level detections in each year are shown with black fill. Detections at leading edges of the epidemics were connected with straight lines each week and the resulting areas (shaded) were used to calculate the area of epidemic extent. Maps are shown in descending order with the year of greatest final epidemic extent (2007) in the top row of the figure
Data analyses
The final epidemic areas for the seven years (calculated for 28 December) were regressed against weekly epidemic areas calculated for each week of each year from 6 April-28 December using Excel (Microsoft, Redmond WA). Thus, 39 regressions with six data points each were conducted, one for each week of the calendar from 6 April-28 December. Coefficients of determination for each weekly regression were plotted versus weeks as an indication of temporal changes in the relationship between final epidemic extent over the six years and weekly epidemic area over the seven years.
Results
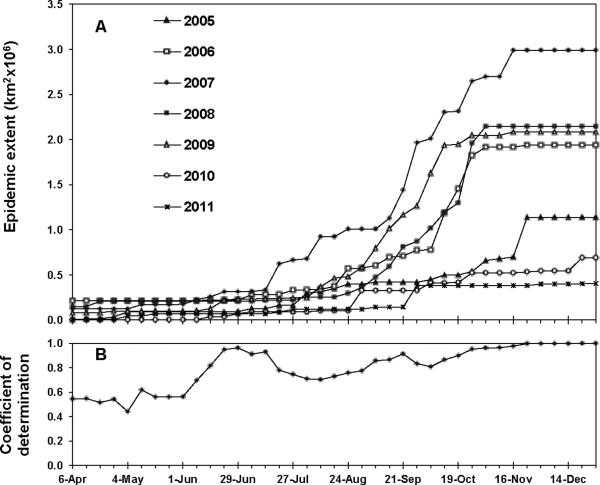
There was considerable variation in the final extent of epidemic spread among years (Figs. 1 and 2A), with a 7.4-fold range of final epidemic extent from the year of least disease spread to that of the most. The year 2007 showed the greatest final epidemic extent. Years 2006, 2008, and 2009 were similar for final epidemic extent, but were about one-third less than that of 2007. Final epidemic extent was smallest in 2010 and 2011. Year 2005, the first full year of soybean rust in spread North America, had a final epidemic extent about twice that of 2010 and 2011, but only about one-half that of the 2006/2008/2009 group.
Fig. 2.
Weekly epidemic area of soybean rust in the U.S. and Canada, 2005–2010. (A) Epidemic area over time based on cumulative detections of soybean rust at the county level. (B) Coefficients of determination (r2) for regression of final epidemic area of each year against epidemic area recorded for each week of the calendar (see example regressions in Fig. 3)
Current and final epidemic extent became strongly associated early during the course of the epidemics. During April and May, regressions of final on current epidemic showed only moderate association, with coefficients of determination ranging from 0.44 to 0.62 and significance of slopes from 0.036 to 0.10 (Fig. 2A and data not shown). There was an increase in the strength of the association in mid-June, with coefficients of determination rising to 0.70 or higher from 8 June through the remainder of the year (Fig. 2A and data not shown). This trend is supported by maps (Fig. 1), which show that years with the greatest final epidemic extent also had the most extensive spread along the Gulf Coast in June and July. Coefficients of determination for the regressions during the period of major epidemic expansion (August-October) ranged from 0.70 to 0.95, and then approached 1.0 monotonically during the remainder of the year (Fig. 2A). The weekly epidemic areas ranked very similarly to the final epidemic areas from 8 June onwards. The year 2007 (the year of greatest final extent) always had the largest weekly areas, while 2010 and 2011 (the two years of least final area) always had the lowest weekly areas. The years 2006, 2008, and 2009 (years with similar final extent) usually fell in a tight cluster of epidemic area in any given week. The year 2005 was usually intermediate between the 2010/2011 and the 2006/2008/2009 clusters or similar to one or the other cluster depending on the week. Slopes of the regressions of course declined with time and reached unity by the final week of observation (Fig. 3 and data not shown).
Fig. 3.
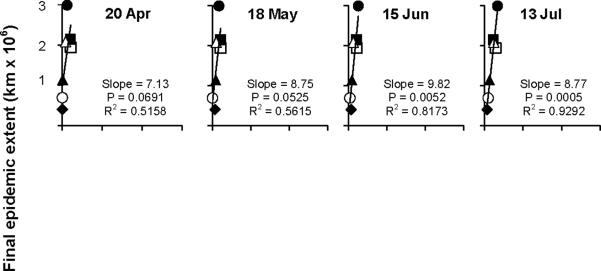
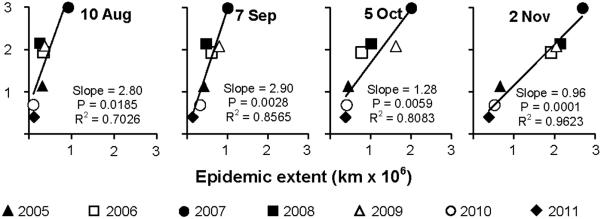
Example regressions of final epidemic area of each year against epidemic area recorded on a given week of that same year. Regressions were conducted for each week of the calendar year, and examples are shown at 4-wk intervals from 20 April-2 November
We failed to detect evidence that number of observations was a significant influence on observed epidemic area. Regression showed a weak (r2 = 0.36) and non-significant (P = 0.14) association between number of observations per year versus final epidemic extent among years (Table 1).
Table 1.
Number of observation sites and total number of observations per year in the USDA IPM PIPE (Integrated Pest Management Pest Information Platform for Extension and Education) program for soybean rust on all hosts in USA and Canada, 2005–2012. Data were kindly provided by Julie Golod of the USDA IPM PIPE
| Year | Number of locations | Number of observations | Final epidemic extent (million km2) |
|---|---|---|---|
| 2005 | a | 17,555 | 1.14 |
| 2006 | 1,743 | 12,233 | 1.94 |
| 2007 | 2,174 | 13,377 | 2.99 |
| 2008 | 2,510 | 16,231 | 2.15 |
| 2009 | 2,033 | 9,597 | 2.09 |
| 2010 | 852 | 4,837 | 0.69 |
| 2011 | 537 | 2,701 | 0.40 |
Number of locations was not available for 2005
18 May 22 Jun 27 Jul 31 Aug 5 Oct 28 Dec
Discussion
Most epidemic invasions provide only a single opportunity to follow spread from the point of initial introduction. In contrast, the obligate parasitism of soybean rust and the temperature sensitivity of its hosts provided an opportunity to study spatial spread of the same disease over similar territory for seven years. Our study also benefitted from a relatively wide range of initial and final epidemic areas among years. Our analyses show a strong association between current and final epidemic spread beginning prior to the time of rapid epidemic expansion. This association accounted for a strong majority of the variation in final epidemic extent among years, suggesting that size of initial epidemic area on disease caused by LDD pathogens is a crucial variable determining the extent of subsequent spread of an LDD pathogen.
Mathematical approaches also support a strong effect of initial epidemic area on subsequent disease spread. Xu and Ridout (1998) reported that the amount and spatial pattern of initial disease were often the dominant influences in a stochastic, spatiotemporal model of disease spread that assumes a half-Cauchy dispersal kernel, which is a fat-tailed distribution related to that of the power law. A simple analytic model described spread of various plant and animal pathogens with LDD over a six-fold range of spatial scale, from experimental field plots to intercontinental spread (Mundt et al. 2009a,b); this result demonstrates a direct association between current and future spread that dominates over other influences. In this model, the temporal rate of disease increase contributes to the expansion from the outbreak focus in the first generation of disease spread and establishes a y-intercept, but subsequent spread is governed only by slope of the dispersal kernel and time. Finally, use of a compartmentalized, spatially explicit simulation model and preliminary field results with wheat stripe rust showed that the degree of host susceptibility at the initial focus has a stronger effect on subsequent disease spread than does the degree of host susceptibility in the remainder of the host population (unpublished).
Current epidemic area must eventually become highly correlated with final epidemic area, of course, and the coefficient of determination for the regressions we conducted must become 1.0 by the final observation. Of more significance is the time at which current and final epidemic areas become highly associated. In our study, the coefficients of determination remained at or above 0.70 beginning 8 June, six weeks prior to the time when the epidemics began rapid expansion (Fig. 2B). Epidemic area averaged over the seven years increased 12.5-fold during that time. This result suggests that the course of the epidemic is established early and that initial epidemic area may be the most important driver for the subsequent expansion of the epidemic front.
Atmospheric trajectory models also have been used to study soybean rust epidemiology in North America, providing the opportunity to predict the probability of disease spread between very specific source and receptor regions, using weather events on a small time scale (e.g., Isard et al. 2007; Isard et al. 2011). This approach can help to identify regions that may be of greater importance as sources of disease spread, and regions that might be more prone to infection from spores dispersed from another region. By contrast, our approach can only identify a generalized epidemic front, and cannot predict the importance of individual counties or regions as spore sources or the infection status of individual counties within the epidemic region. Atmospheric trajectory models require substantially greater input data and computational resources, however.
We evaluated expansion of the epidemic front based on presence/absence data, as this was the form in which soybean rust data were available. This is a very common approach in studying the spatial spread of disease (e.g., Mundt et al. 2009b; Heesterbeek and Zadoks 1987; Singh et al. 2008; Frick et al. 2010). Our analyses also could have been based on the cumulative number of infected counties over time, as was done for spatial and temporal analysis of the first two years of soybean rust spread in the U.S. (e.g., Christiano and Scherm 2007), or by the total area of those counties. However, this would have complicated interpretation of data substantially because the density of sampling points and frequency of observations differed among years (Table 1) and among states.
Epidemiological models of plant disease have tended to concentrate on effects of weather variables, including models for soybean rust (Yang et al. 1991; Isard et al. 2007; Del Ponte and Esker 2008; Isard et al 2011). Though our approach provided reasonably accurate predictions without accounting for weather variables, local increase of disease caused by pathogens with power law or related dispersal kernels can be highly independent from the long-distance phase of the epidemic (Filipe and Maule 2004; Mundt 2009). Thus, weather during the course of an epidemic could be a highly important determinant of local disease intensification during the season, and crucial to making local management decisions such as timing of fungicide application. For example, models including only rain variables explained between 86 and 92% of the variation in final, local levels of soybean rust for 34 field experiments in Brazil (DelPonte et al. 2006).
There are many potential problems in retrospective analyses of disease spread since variables impacting epidemic spread could potentially be correlated with time. For example, improved knowledge may result in increased efficiency and more extensive use of control practices, potentially reducing epidemic expansion. On the other hand, if rust detections had increased in proportion to increased monitoring and/or knowledge of the disease, and control practices remained fairly constant, one would expect a trend towards increasing epidemic area over time. In the data set we utilized, years with the three smallest extents of spread were the first and last two years (2005 and 2010/2011), and we also found a non-significant relationship between total number of observations (Table 1) and final epidemic extent. A recent study has provided an in-depth evaluation of sample number on error rate in the soybean rust IPM PIPE system using data from the sentinel plot system in years 2005–2008 (Sutrave et al. 2012). That study emphasized error rates for failing to identify sites with positive detections. In conducting a randomization analysis of the effect of number of counties with sentinel plots, they calculated a median error rate of about 2.5% for a sample size of 500 total number of counties with sentinel plots in the U.S. (see Fig. 4 of Sutrave et al. [2012]), which is the average number sentinel plot counties in 2005–2008, but only about one-fourth the total number of observation locations (sentinel observations plus others) during that time period (Table 1). A sample size of 500 is almost identical to the 537 total observation locations reported in the year of the fewest observations (2011, Table 1), suggesting a very low error rate even for the years of lowest numbers of observations. We also examined error rates of Sutrave et al. (2012) under the highly conservative assumption that non-sentinel observations made no contributions to reducing error beyond that provided by the sentinel sites. Under this worst-case scenario, one can examine the error in Fig. 4 of Sutrave et al. (2012) for a reduction to 25% in the number of locations to give a median error rate of about 12%, which is still relatively low and unlikely to explain a significant proportion of the difference in epidemic extent among years. If “other” locations contributed one-fourth or one half of the value of data from sentinel locations, the corresponding median error rates would be about 8 and 6%, respectively. Perhaps more importantly, any significant spread of soybean rust not detected in formal IPM PIPE activities would have been noticed and reported in the course of on-going activities by the hundreds or even thousands of farmers, university personnel, and commercial crop consultants working in soybean fields in North America. For example, commercial crop consultants typically visit fields weekly, providing substantial opportunities to detect the occurrence of soybean rust.
The inability to include soybean rust detections in Mexico likely had little impact on our analyses, for several reasons. First, low host density and the relatively arid environment north of the Mexican detections makes it likely that active sites from the U.S. Gulf Coast had a much larger contribution to the northward movement of the epidemics. Second, based on positive detection sites and the predominant wind patterns, rust from Mexico would be prone to disperse primarily over the Gulf of Mexico rather than directly north. Finally, there were many less detections in Mexico than in the U.S. There were detections in 138, 231, 335, 392, 576, 40, and 22 U.S. counties in 2005–2011, respectively, plus one Canadian county in 2007. In contrast, the numbers of Mexican municipalities with detections were only 3, 14, 9, 14, and 7 in 2007–2011, respectively (http://sbr.ipmpipe.org/cgi-bin/sbr/public.cgi).
Our analyses of soybean rust suggest that the direct relationship between size of initial disease focus and subsequent disease spread found at small spatial scale in experimental plots (Mundt 2009a; Mundt and Sackett 2012) also may hold for LDD pathogens at the continental scale. Thus, our work supports the common-sense expectation that reducing the size of initial disease outbreaks and controlling an invasive epidemic very soon after initial introduction are crucial to limiting subsequent disease spread.
Acknowledgements
We are very grateful to the USDA IPM Integrated Pest Management Pest Information Platform for Extension and Education (PIPE) program for use of the soybean rust monitoring data, especially to Julie Golod for compiling data on number of observation sites and Scott Isard for helpful advice. The authors also wish to acknowledge the USDA Risk Management Agency, USDA North Central Soybean Research Program, United Soybean Board, and numerous Qualified State Soybean Boards who have contributed funds specifically for the purposes of monitoring for soybean rust throughout the U.S. This research was supported by the NSF/NIH Ecology of Infectious Disease grants NSF award 052756 and NIH award 5R01GM96685.
References
- Bjornstad ON, Peltonen M, Liebhold AM, Batlensweiler W. Waves of larch budmoth outbreaks in the European Alps. Science. 2002;298:1020–1023. doi: 10.1126/science.1075182. [DOI] [PubMed] [Google Scholar]
- Christiano RCS, Scherm H. Quantitative aspects of the spread of Asian soybean rust in the southeastern United States, 2005 to 2006. Phytopathology. 2007;97:1428–1433. doi: 10.1094/PHYTO-97-11-1428. [DOI] [PubMed] [Google Scholar]
- Clark JS, Lewis M, Horvath L. Invasion by extremes: population spread with variation in dispersal and reproduction. Am Nat. 2001;157:537–554. doi: 10.1086/319934. [DOI] [PubMed] [Google Scholar]
- Cummings DAT, Irizarry RA, Huang NE, Endy TP, Nisalak A, Ungchusak K, Burke DS. Travelling waves in the occurrence of dengue hemorrhagic fever in Thailand. Nature. 2004;427:344–347. doi: 10.1038/nature02225. [DOI] [PubMed] [Google Scholar]
- Del Ponte EM, Godoy CV, Li X, Yang XB. Predicting severity of Asian soybean rust epidemics with empirical rainfall models. Phytopathology. 2006;96:797–803. doi: 10.1094/PHYTO-96-0797. [DOI] [PubMed] [Google Scholar]
- Del Ponte EM, Esker PD. Meteorological factors and Asian soybean rust epidemics - a systems approach and implications for risk assessment. Sci Agric. 2008;65:88–97. [Google Scholar]
- Ferrandino FJ. Dispersive epidemic waves. I. Focus expansion within a linear planting. Phytopathology. 1993;83:795–802. [Google Scholar]
- Filipe JAN, Mauleb MM. Effects of dispersal mechanisms on spatio-temporal development of epidemics. J Theor Biol. 2004;226:125–141. doi: 10.1016/s0022-5193(03)00278-9. [DOI] [PubMed] [Google Scholar]
- Frick WF, Pollock JF, Hicks AC, Langwig KE, Reynolds DS, Turner GG, Butchkoski CM, Kunz TH. An emerging disease causes regional population collapse of a common North American bat species. Science. 2010;329:679–682. doi: 10.1126/science.1188594. [DOI] [PubMed] [Google Scholar]
- Gewin V. Disease control: Virtual plagues get real. Nature. 2004;427:774–775. doi: 10.1038/427774a. [DOI] [PubMed] [Google Scholar]
- Gisiger T. Scale invariance in biology: coincidence or footprint of a universal mechanism? Biol Rev. 2001;76:161–209. doi: 10.1017/s1464793101005607. [DOI] [PubMed] [Google Scholar]
- Grenfell BT, Bjornstad ON, Kappey J. Travelling waves and spatial hierarchies in measles epidemics. Nature. 2001;414:716–723. doi: 10.1038/414716a. [DOI] [PubMed] [Google Scholar]
- Hasting AK, Cuddington KF, Davies CJ, Dugaw S, Elmendorf, Freestone A, Harrison S, Holland M, Lambrions J, Malvadkar U, Melbourne BA, Moore K, Taylor C, Thomson D. The spatial spread of invasions: new developments in theory and evidence. Ecol Lett. 2005;8:91–101. [Google Scholar]
- Heesterbeek JAP, Zadoks JC. Modelling pandemics of quarantine pests and diseases: Problems and perspectives. Crop Prot. 1987;6:211–221. [Google Scholar]
- Isard SA, Russo JM, DeWolf ED. The establishment of a national Pest Information Platform for Extension and Education. Online. Plant Health Prog. 2006 doi:10.1094/PHP-2006-0915-01-RV. [Google Scholar]
- Isard SA, Russo JM, Ariatti A. The Integrated Aerobiology Modeling System applied to the spread of soybean rust into the Ohio River valley during September 2006. Aerobiologia. 2007;23:271–282. [Google Scholar]
- Isard SA, Barnes CW, Hambleton S, Ariatti A, Russo JM, Tenuta A, Gay DA, Szabo LJ. Predicting soybean rust incursions into the North American continental interior using crop monitoring, spore trapping, and aerobiological modeling. Plant Dis. 2011;95:1346–1357. doi: 10.1094/PDIS-01-11-0034. [DOI] [PubMed] [Google Scholar]
- Johnson DM, Liebold AM, Tobin PC, Bjornstad ON. Allee effects and pulsed invasion by the gypsy moth. Nature. 2006;444:361–363. doi: 10.1038/nature05242. [DOI] [PubMed] [Google Scholar]
- Kot M, Lewis MA, vandenDriessche P. Dispersal data and the spread of invading organisms. Ecology. 1996;77:2027–2042. [Google Scholar]
- Li X, Esker PD, Pan Z, Dias AP, Xue L, Yang XB. The uniqueness of the soybean rust pathosystem: An improved understanding of the risk in different regions of the world. Plant Dis. 2010;94:796–808. doi: 10.1094/PDIS-94-7-0796. [DOI] [PubMed] [Google Scholar]
- Lambin X, Elston DA, Petty SJ, MacKinnon JL. Spatial asynchrony and periodic travelling waves in cyclic populations of meadow voles. Proc Royal Soc B. 1998;265:1491–1496. doi: 10.1098/rspb.1998.0462. [DOI] [PMC free article] [PubMed] [Google Scholar]
- Madden LV, Hughes G, van den Bosch F. The study of plant disease epidemics. APS Press; St. Paul, MN: 2007. [Google Scholar]
- Mollison D. Spatial contact models for ecological and epidemic spread. J Royal Stat Soc B. 1977;39:283–326. [Google Scholar]
- Mundt CC. Importance of autoinfection to the epidemiology of polycyclic, foliar disease. Phytopathology. 2009;99:1116–1120. doi: 10.1094/PHYTO-99-10-1116. [DOI] [PubMed] [Google Scholar]
- Mundt CC, Sackett KE. Spatial scaling relationships for spread of disease caused by a wind-dispersed plant pathogen. Ecosphere. 2012 doi: 10.1890/ES11-00281.1. in press. [DOI] [PMC free article] [PubMed] [Google Scholar]
- Mundt CC, Sackett KE, Wallace LD, Cowger C, Dudley JP. Aerial dispersal and multiple-scale spread of epidemic disease. Ecohealth. 2009a;6:546–552. doi: 10.1007/s10393-009-0251-z. [DOI] [PubMed] [Google Scholar]
- Mundt CC, Sackett KE, Wallace LD, Cowger C, Dudley JP. Long distance dispersal and accelerating waves of disease: Empirical relationships. Am Nat. 2009b;173:456–466. doi: 10.1086/597220. [DOI] [PubMed] [Google Scholar]
- Mundt CC, Sackett KE, Wallace LD. Landscape heterogeneity and disease spread: experimental approaches with a plant pathogen. Ecol Appl. 2011;21:321–328. doi: 10.1890/10-1004.1. [DOI] [PubMed] [Google Scholar]
- Pivonia S, Yang XB, Pan Z. Assessment of epidemic potential of soybean rust in the United States. Plant Dis. 2005;89:678–682. doi: 10.1094/PD-89-0678. [DOI] [PubMed] [Google Scholar]
- Riley S. Large-scale spatial-transmission models of infectious disease. Science. 2007;316:1298–1301. doi: 10.1126/science.1134695. [DOI] [PubMed] [Google Scholar]
- Schneider RW, Hollier CA, Whitam HK. First report of soybean rust caused by Phakopsora pachyrhizi in the continental United States. Plant Dis. 2005;89:774. doi: 10.1094/PD-89-0774A. [DOI] [PubMed] [Google Scholar]
- Singh RP, Hodson DP, Huerta-Espino J, Jin Y, Njau P, Wanyera R, Herrera-Foessel SA, Ward RW. Will stem rust destroy the world's wheat crop? Adv Agron. 2008;98:271–309. [Google Scholar]
- Smith DJ. Predictability and preparedness in influenza control. Science. 2006;312:392–394. doi: 10.1126/science.1122665. [DOI] [PubMed] [Google Scholar]
- Sutrave S, Scoglio C, Isard SA, Hutchinson JMS, Garrett KA. Identifying highly connected counties compensates for resource limitations when evaluating national spread of an invasive pathogen. PLoS ONE. 2012;7(6):e37793. doi: 10.1371/journal.pone.0037793. [DOI] [PMC free article] [PubMed] [Google Scholar]
- Xu XM, Ridout MS. Effects of initial epidemic conditions, sporulation rate, and spore dispersal gradient on the spatio-temporal dynamics of plant disease epidemics. Phytopathology. 1998;88:1000–1012. doi: 10.1094/PHYTO.1998.88.10.1000. [DOI] [PubMed] [Google Scholar]
- Yang XB, Dowler WM, Royer MH. Assessing the risk and potential impact of an exotic plant disease. Plant Dis. 1991;75:976–982. [Google Scholar]


