Abstract
The vervet is an old world monkey increasingly being used as a model for human diseases. In addition to plaques and tangles, an additional hallmark of Alzheimer’s disease is damage to neurons that synthesize noradrenaline (NA). We characterized amyloid burden in the posterior temporal lobe of young and aged vervets, and compared that to changes in NA levels and astrocyte activation. Total Aβ40 and Aβ42 levels were increased in the aged group, as were numbers of amyloid plaques detected using antibody 6E10. Low levels of Aβ42 were detected in 1 of 5 younger animals, although diffusely stained plaques were observed in 4 of these. Increased GFAP staining and mRNA levels were significantly correlated with increased age, as were cortical NA levels. Levels of Aβ42 and Aβ40, and the number of 6E10+ plaques, were correlated with NA levels. Interestingly mRNA levels of glial derived neurotrophic factor, important for noradrenergic neuronal survival, were reduced with age. These findings suggest that amyloid pathology in aged vervets is associated with astrocyte activation and higher NA levels.
Keywords: Vervet, African Green Monkey, Amyloid, Alzheimer’s disease, Noradrenaline
Introduction
The vervet (Chlorocebus aethiops) or African Green Monkey (AGM) is an Old World Monkey (OWM), indigenous to West Africa. Vervets were imported to St Kitts and other islands in the Caribbean from West Africa in the late 17th century. Vervets are of intermediate size (adults are 5-7 kg), live to 20 years in the wild, and up to 30 years in captivity. Vervets offer several advantages to other OWMs: They are a non-endangered species that adapt well to captive environments, and in contrast to other nonhuman primates, Caribbean origin vervets are typically free of herpes virus B, immunodeficiency viruses, and retrovirus, and do not harbor any of the known African pathogenic viruses [24]. These properties make them appealing to carry out basic and translational research, and in particular have proven valuable for studies of metabolic disorders including type 2 diabetes [28]. Vervets have been used for cognitive studies relevant to human diseases including schizophrenia [12], aging [34], and attention deficit disorder [45]; and have been used for stem cell transplantation studies addressing Parkinson’s disease [51]. Interestingly, the ApoE gene which is present as 3 different alleles in human, is fixed in the vervet as it is in several other OWM, with an amino acid sequence corresponding to human Apo E4 [10], the allele which significantly increases the risk of developing AD.
Only a single study to date has characterized the development of AD-type pathology in vervets [29]. In that study, the authors showed that vervets develop amyloid beta (Aβ) plaques with aging, and were associated with areas of astrogliosis and neuronal dystrophy. However, there were several limitations of that study including that the animals were not colony-bred, ages were not known but estimated by physical criteria and dentition, groups contained males and females, and the archival material used as controls was not well characterized as to origin or health status.
The accumulation of amyloid burden in Alzheimer’s disease (AD) is regulated by a variety of processes including proteolytic processing of the amyloid precursor protein (APP), clearance of amyloid beta (Aβ) and other smaller peptides by phagocytosis, and degradation of Aβ by specific metalloproteinases. These processes are themselves subject to regulation by alterations in cellular metabolism, by the inflammatory milieu, as well as by levels of various neurotransmitters and neuropeptides. It has been shown that that alterations in noradrenaline (NA) occur during normal aging [54], due to damage occurring to noradrenergic neurons present in the Locus coeruleus (LC), the major source of NA in the CNS [6]. It is well known that damage occurs to neurons present in the LC during normal aging [31, 37], and that loss is exacerbated in certain neurological diseases and conditions including Alzheimer’s disease [55], and multiple sclerosis [40]. The consequences of LC neuronal loss and associated changes in NA levels are not fully known. However we and others have shown that experimental lesion of LC neurons and NA depletion exacerbates AD type pathology in mouse models of AD [20], and conversely that treatments which raise central levels of NA provide benefit [27, 32, 33, 36]. However, while studies in rodents are informative, comparable studies in primates are limited, and the exact relationship central NA levels and amyloid burden or AD-type pathology in primates are not well known.
In the current study we characterized the development of amyloid burden in a cohort of vervets derived from the Caribbean population, of known age, health status, and pedigree. We compared Aβ1-40 and Aβ1-42 levels in the temporal lobes of a group of relatively younger (10.8 ± 0.4 years) and older (23.3 ± 1.4 years) animals, and also measured levels of NA. Our findings confirm an age-dependent accumulation of amyloid plaques in the temporal cortex, with significantly greater levels of Aβ42 than Aβ40. We also observed an age-dependent increase in cortical NA levels, that was correlated with increased amyloid burden as well as increased astrogliosis.
Methods
Animals
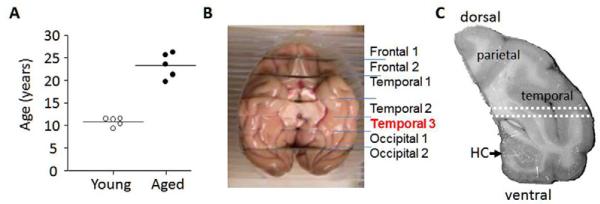
This study included 10 adult female African green vervet (Chlorocebus aethiops sabaeus) monkeys: five young adults (mean and SEM=10.8 ± 0.4 year), corresponding roughly to human beings in their thirties; and five old adults (mean and SEM=23.3 ± 1.4 year), corresponding roughly to human beings in their seventies (Figure 1A). These monkeys were members of the Vervet Research Colony (VRC) located at the Wake Forest University Primate Center. The VRC is a colony of Caribbean origin African green monkeys (Chlorocebus aethiops sabaeus) originally founded at the University of California, Los Angeles (UCLA) in 1975 and relocated to Wake Forest in 2008. All animals were born at the original Vervet Research Colony location at, UCLA and raised in social groups managed to reflect the natural social composition of vervet groups in the wild. All had free access to standard commercial monkey chow (Purina LabDiet) and water. All procedures involving monkeys were conducted in accordance with state and federal laws, standards of the Department of Health and Human Services, and guidelines established by the institutional Animal Care and Use Committee.
Figure 1. Tissue origin.
(A) Age at necropsy distribution of monkeys from whence the brains were taken. (B) Temporal lobe dissection. The data reported here were derived using the section denoted as temporal 3. (C) The tissue used for measurements of Aβ, NA, and mRNA levels was dissected from the area located between the dotted white lines. The dorsal tissue containing parietal and temporal cortices was used for detection of Aβ plaques and GFAP, and the ventral tissue for GFAP.
Tissue Collection and Preparation
At necropsy, brains were rapidly removed, blocked into 4-6 mm coronal slabs, hemisected and then frozen at −80°C. For the presen t study, the left or right coronal slab containing the posterior hippocampus and caudal temporal cortex (“Temporal 3”, Figure 1B) was used to prepare samples. Young versus aged groups were counterbalanced for hemisphere. An approximately 1 mm thick transverse section of the inferior temporal cortex (ITC) was dissected from the area located immediately dorsal to the hippocampus extending from midline to the lateral surface (Figure 1C). This section was used to prepare samples for analysis of Aβ, NA, and mRNA levels. The remaining tissue dorsal to the white dotted lines and containing the parietal and temporal cortices (referred to herein as parietal/temporal (P/T) cortex) was used for immunohistochemical staining for Aβ plaques and astrocyte activation using antibody to GFAP. The tissue ventral to the white dotted lines and containing both the hippocampus and ventral regions of the temporal cortex was used for immunohistochemical staining using antibody to GFAP. These larger sections were needed for immunostaining studies to count a sufficient number of plaques.
Measurement of Aβ levels
Aβ1–40 and Aβ1-42 levels were measured by ELISA (Aβ1-42 ELISA kit, catalog KHB3544; Aβ1-40 ELISA kit, catalog KHB3481m BioSource Invitrogen, Carlsbad, CA) according to manufacturer’s instructions. In brief, samples from the ITC were snapfrozen on dry ice, sonicated in 5 volumes of buffer (5 M guanidine HCl, 50 mM Tris-HCl, pH 8.0) on ice, incubated at room temperature for 3 hours and then serially diluted in the provided buffer containing protease inhibitor Cocktail Set III (Calbiochem Cat 539134, Merck, Darmstadt, Germany). The Aβ1–40 and Aβ1-42 levels in samples were calculated by comparison to provided human standards, and normalized to protein concentrations determined by Bradford assay (Bio-Rad, Hercules, CA, USA).
Immunohistochemical staining
The P/T cortex was thawed at room temperature, then fixed overnight in 4% paraformaldehyde in 0.1M phosphate buffer at 4°C, k ept overnight in 10% sucrose in 0.1 M phosphate buffer at 4°C, then snap-frozen in isopentane at −30 °C. Sections (35 M thick) were prepared on a cryostat, and stored in cryoprotective solution (0.1M phosphate buffer : ethyleneglycol : glycerol 30:40:30) at −20°C. A β plaques were stained with primary mouse monoclonal antibody (6E10 Covance #39320) with dilution of 1:1000. Aβ40 plaques were selectively stained using mouse monoclonal antibody MM32-13.1.1 (US Biological, Swampscott, MA) at dilution 1:1000. Sections were incubated overnight at 4°C followed by incubation w ith goat anti-mouse biotinylated antibody (Vector BA-9200) and developed with ABC and DAB kits from Vector labs.
To quantify plaque burden, the entire brain sections were scanned manually, and all areas containing visible plaques were imaged at 4× magnification which encompasses an area of 300 μm × 300 μm. Although some staining was observed in microvessels, for this study we did not include vascular immunoreactivity in our calculations. The number of sections imaged was 3 or 4 per animal. The total number of plaques and area stained in each image was quantified using Axiovision 4.3, and then totals summed across all images for each animal. The entire brain sections were imaged at low magnification, and the total area containing tissue calculated; these values ranged from 500 to 1,100 mm2. The data is presented as total number of plaques and % area stained per mm2.
Sections through the P/T cortex containing a portion of the hippocampus were used to stain astrocytes using rat monoclonal anti-human GFAP B2.210 at 1:300 [53], and detected with FITC conjugated secondary antibody. GFAP staining was quantified to determine total number of stained objects and % area stained by using an area cutoff size of 20 μm2.
Measurement of NA levels
Lysates were prepared from ITC samples by sonication on ice, in 10 volumes of 0.01 N HCl, 1 mM EDTA, and 4 mM sodium metabisulfite. NA levels in aliquots were determined by enzyme-linked immunosorbent assay (ELISA) according to manufacturer’s instructions. The NA ELISA kit (catalog BA E-6200) was from Rocky Mountain Diagnostics Inc. (Colorado Springs, CO, USA).
Measurement of mRNA levels
Total RNA was isolated from samples of the ITC using Trizol reagent (Invitrogen Gibco, Carlsbad, CA, USA). The RNA was reverse-transcribed into cDNA using random hexamer primers (High Capacity cDNA Reverse Transcription Kit #4368814 Applied Biosystems). Real time quantitative PCR (qPCR) was carried out on RotoGene with FastStart Universal SYBR Green Master mix (Roche # 04913850001) Primers were designed to span an intron and amplify alternatively spliced transcripts. Calculated cycle take off (Ct) values were used to calculate relative mRNA levels normalized to values measured for α-tubulin in the same samples. Primer sequences were designed from mRNA sequences of Macaca mulatta, except for NOS2 which was designed against human sequence, and are listed below with forward and reverse start sites indicated. The products were separated through agarose gels to confirm the correct product size.
Brain derived neurotrophic factor (BDNF):
Forward: (405) 5′-AAGAGGCCTGACATCATTGGCT-3′;
Reverse: 5′-ACGTGTACAAGTCTGCGTCCTT-3′ (520)
Neprilysin (NEP):
Forward: (1259) 5′-TGCTTTCCGCAAGGCCCTTTAT-3′
Reverse: 5′-TCCAGCAAATGCTGCTTCCACA-3′ (1385)
Glial derived neurotrophic factor (GDNF):
Forward: (665) 5′-TTGCGATGCAGCTGAGACAACA-3′
Reverse: 5′-TGCAACATGCCTGCCCTACTTT-3′ (759)
β-secretase 1 (BACE1):
Forward: (1064) 5′-GGCGGGAGTGGTATTATGAGG-3′
Reverse: 5′-ACTTTCTTGGGCAAACGAAGG-3′ (1202)
Nitric oxide synthase type 2 (NOS2):
Forward: (957) 5′-GCGTTACTCCACCAACAATGGCAA-3′
Reverse: 5′-ATAGCGGATGAGCTGAGCATTCCA-3′ (1065)
Glial fibrillary acidic protein (GFAP):
Forward: (2492) 5′-GCAGGGCATGACTTTGTCCCATTT-3′
Reverse: 5′-TGTGTGAGTAAGAAGGGACCGCAA-3′ (2690)
Data Analysis
Group comparisons were done by 2-sided unpaired t-test. Correlations were tested for using non-parametric Spearman regression analysis. P values less than 0.05 were considered significant. Data was analyzed using Graphpad version 5.0.
Results
Amyloid levels and plaque numbers increase during aging
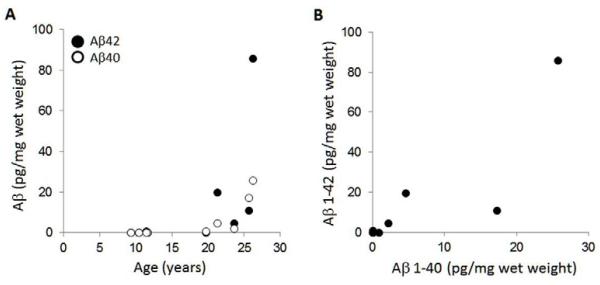
Total levels of Aβ40 and Aβ42 were measured by specific ELISA using guanidine HCl lysates prepared from the ITC of young and aged female vervets (Figure 2A). Measurements of Aβ40 or Aβ1-42 fell below background levels in all younger animals except for one 11.4-year old who had detectable levels of Aβ42 over background values. In older animals, both Aβ40 and Aβ42 levels increased with age (Figure 2A), with highest levels (Aβ42 = 86 pg/mg; Aβ40 = 25.7 pg/mg) measured in the oldest (26.2 years) animal. Individual Aβ42 levels were highly correlated with Aβ40 levels, and on average levels of Aβ42 were 2.6 fold higher than Aβ40 (Figure 2B).
Figure 2. Total Aβ1-40 and 1-42 levels are increased during aging.
Guanidine HCl lysates from temporal cortex were measured by ELISA for levels of Aβ40 and Aβ42. Panel (A) shows values measured in each animal versus their age. Both Aβ40 (rho= 0.92; P= 0.0001) and Aβ42 (rho= 0.68; P= 0.030) were significantly correlated with increased age. Panel (B) shows that levels of Aβ40 were significantly correlated with levels of Aβ42 (rho = 0.75, P = 0.012).
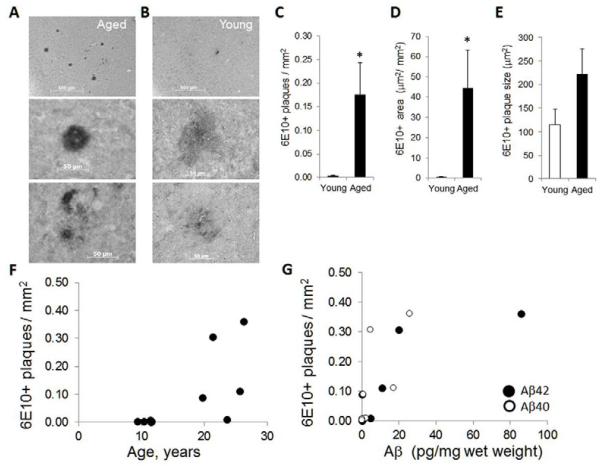
Immunostaining using antibody 6E10 for the presence of Aβ containing plaques in the P/T cortex confirmed the presence of plaques in all older animals. The majority of these plaques had strongly stained centers surrounded by densely stained material (Figure 3A, middle panel), although some had strongly stained centers surround by lighter diffuse staining (Figure 3A, bottom panel). A limited number of plaques were detected in 4 of the 5 younger animals, and most had smaller, diffusely stained morphology (Figure 3B). The number of 6E10+ plaques (Figure 3C) and total area covered (Figure 3D) was significantly increased in the older animals, and there was a trend toward larger plaque size in the older animals (Figure 3E). The number of 6E10+ plaques was significantly correlated with age (Figure 3F), as well as with Aβ42 and Aβ40 levels (Figure 3G). Immunostaining for Aβ40 containing plaques detected very few plaques in either young or older animals, nor did we observe any fibrillary plaques in these animals using Thioflavin S staining (data not shown).
Figure 3. The number of Aβ plaques increases during aging.
Sections containing temporal and parietal cortex were stained with antibody 6E10 to detect Aβ40 and Aβ42 containing plaques. Images show representative staining obtained in an (A) aged and (B) younger animal. The scale bars are 500 μm in top panels, and 50 μm in lower panels. The average (C) number of plaques per mm2; (D) area stained in μm2 per mm2; and (E) average plaque size in μm2 calculated from 5-6 sections per sample, and is mean ± sem, *, P < 0.05. The number of plaques (rho= 0.74, P= 0.014) was highly correlated with (F) increased age, and (G) levels of Aβ40 (rho= 0.87, P= 0.001) and Aβ42 (rho= 0.70, P= 0.023).
GFAP expression is increased during aging
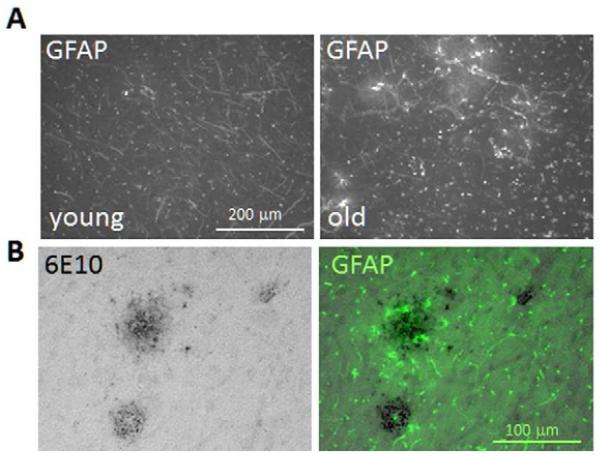
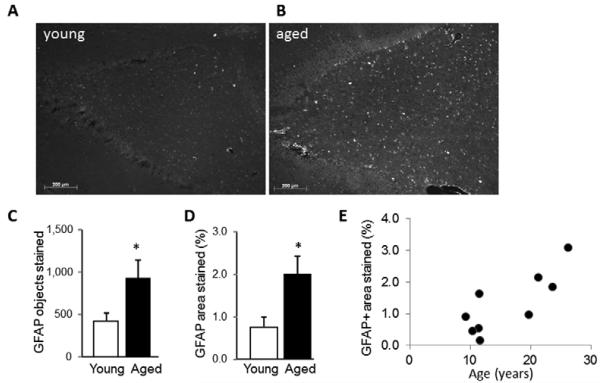
Immunostaining for the astrocyte marker GFAP revealed activated astrocytes in the P/T cortex and underlying hippocampal area of both young and aged vervets. In the P/T cortex, GFAP+ staining in grey matter was greater in the aged compared to the older vervets (Figure 4A), and was located primarily in and around areas containing 6E10+ stained plaques (Figure 4B). In the hippocampal area, GFAP staining was also greater in the aged animals particularly in the area corresponding to the dentate gyrus (Figure 5A,B). Quantitative imaging confirmed that the number of GFAP+ stained cells (having size > 20 μm2) (Figure 5C) and the total area covered by GFAP+ staining (Figure 5D) was significantly increased in the aged animals. Both the total % area stained (Figure 5E) and the number of GFAP+ stained objects (not shown) were significantly correlated with increased age.
Figure 4. GFAP expression is increased during aging.
Sections containing the temporal and parietal cortex were stained with antibody to GFAP to identify activated astrocytes. Representative images from a young and aged animal (A) show increased GFAP staining in older tissue. (B) A section from an older animal stained for 6E10+ plaques and revealed using DAB and peroxidase is shown next to a serial section from the same animals stained for GFAP and revealed using a FITC conjugated secondary antibody.
Figure 5. Hippocampal GFAP expression is increased during aging.
Sections containing the temporal and parietal cortex and containing the hippocampus were stained with antibody to GFAP. Representative images are shown for (A) young and (B) aged animal. The area shown corresponds to the dentate gyrus. The average number of GFAP+ stained objects per section (C) and % area stained (D) were quantified in 3-6 sections per animal. Data is mean ± sem, *, P < 0.05 versus young. (E) The % area stained was significantly correlated (rho= 0.73; P= 0.03) with age.
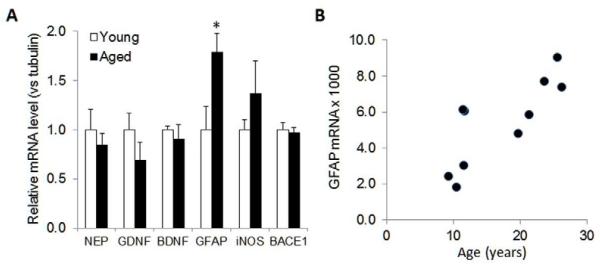
Consistent with the increase in GFAP staining, qPCR (Figure 6A) showed a significant increase in relative GFAP mRNA levels in the ITC, which was correlated with increased age (Figure 6B). In the same samples, we found a slight decrease (about 30%) in levels of the neurotrophin GDNF; however this did not reach statistical significance.
Figure 6. GFAP mRNA levels are increased during aging.
(A) Total RNA was prepared from temporal cortices, converted to cDNA, and qPCR used to determine relative mRNA levels of indicated genes (NEP, neprilysin; GDNF, glial derived neurotrophic factor; BDNF, brain derived neurotrophic factor; GFAP, glial fibrillary acidic protein; iNOS, inducible nitric oxide synthase; BACE1, β-site APP cleaving enzyme 1). Values are mean ± sem (n=5 per group) of mRNA levels relative to values measured for β-tubulin in the same samples; and with values for the young group normalized to 1.0. *, P<0.05 versus young. (B) Relative GFAP mRNA levels normalized to β-tubulin were correlated with increased age (r = 0.79; P = 0.006).
Correlation analysis showed that higher GFAP mRNA levels were correlated with higher Aβ40 and Aβ42 levels and with higher number of 6E10+ stained plaques. The number of GFAP+ stained objects, but not total GFAP+ stained area, were correlated to Aβ40 but not with Aβ42 levels or 6E10 staining. Overall these results suggest that increases in astrocyte activation are closely associated with increases in amyloid burden.
Noradrenaline levels increase during aging
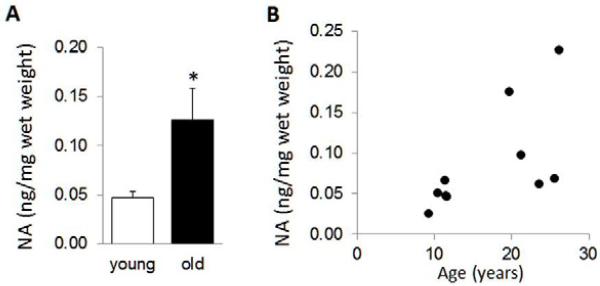
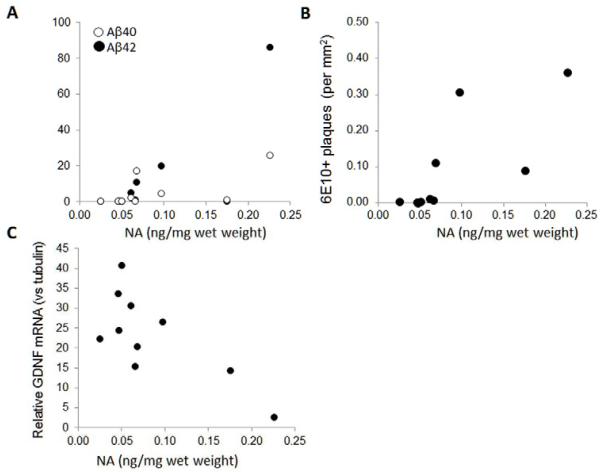
Specific ELISA was used to measure tissue content of NA in the ITC of young and aged vervets (Figure 7A). There was a significant, approximately 3-fold increase in NA levels in the aged versus younger vervets, and the higher NA levels were correlated with increased age (Figure 7B). Correlation analysis revealed that higher levels of Aβ40, but not Aβ42, were significantly correlated with higher NA levels (Figure 8A); as were the total number of 6E10+ stained plaques (Figure 8B). NA levels were not correlated to changes in GFAP expression; however higher NA levels were inversely correlated to GDNF mRNA levels (Figure 7C), but not to any of the other mRNAs measured.
Figure 7. Noradrenaline levels are increased with age.
Samples from temporal cortex were lysed in 100 mM HCl and used for ELISA to measure NA levels. (A) The data is mean ± sem of ng NA per mg wet weight tissue, n=5 per group, * P < 0.05. (B) The values for individual NA levels were correlated with increased age (rho= 0.72, P= 0.019).
Figure 8. Aβ1–40 and 1-42 levels and plaque numbers are correlated to NA levels.
(A) Values measured for cortical NA levels were strongly correlated with both Aβ40 (rho= 0.80; P= 0.006) and Aβ42 (rho= 0.70; P= 0.023) levels; and (B) with the number of 6E10+ stained plaques (rho= 0.90; P= 0.0004). (C) Higher NA levels were inversely correlated with relative GDNF mRNA levels (rho= −0.64; P= 0.048).
Discussion
In the current study, we were able to detect Aβ40 and Aβ42 in all animals from the older cohort, but only Aβ42 in one (aged 11.4 years) of the 5 younger animals. The levels of Aβ40 and Aβ42 both increased with age, and interestingly were strongly correlated to each other. The levels of Aβ42 were on average 2.6-fold higher than Aβ40 levels. This is similar to what was previously reported [29], but differs from rhesus monkeys where Aβ40 plaques predominated, and the ratio of Aβ40:Aβ42 plaques was >2.0 as compared to a ratio of 0.37 in human AD samples [15].
Despite the absence of detectable Aβ in the younger animals, immunostaining with antibody 6E10, which is directed against amino acid residues 1-16 of the Aβ peptide and recognizes both Aβ40 and Aβ42, revealed amyloid plaques in all older animals, as well as in 4 of 5 of the younger animals. In contrast to plaques detected in older animals, those plaques had smaller central areas of dense staining, and were surrounded by lighter, more diffuse staining. This morphology is similar to that observed in AD patients and is thought to correspond to early plaques [2]. Cortical Aβ containing plaques have previously been identified in other non-human primates including macaques [35, 39], orangutans [16, 44], chimpanzees [14], and marmosets [5]. In the present study, we detected very few Aβ40 containing plaques in sections from either young or older animals, suggesting that as in humans [13, 15], vervet plaques consist primarily of Aβ42. Our findings help establish the vervet as another non-human primate with which to further characterize the development of amyloid plaques.
Our data confirms and extends upon a previous study [29] which demonstrated the presence of amyloid burden in brains of older vervets. The animals used in that study had the same Caribbean origins as the monkeys used in the current study. In that study, the youngest animals, estimated to be 15 years, displayed Aβ immunoreactivity in blood vessels but not in plaques, which was primarily positive for Aβ40. In 2 older animals (estimated to be 22 and 30 years of age), plaques were detected in all cortical areas examined, and Aβ42 was more abundant than Aβ40.
The presence of amyloid plaques in all older vervets may be due to the homozygous expression of an apo E protein that corresponds to the human apo E4 isoform, a known risk factor for AD. However whether vervet apo E binds to Aβ or causes it to aggregate has not been determined. The vervet apo E amino acid sequence was first determined by Fainman et al. [10] who showed that all 30 vervets tested were homozygous for the E4 allele as defined by the presence of Arg-112 and −158 in Exon 4. The presence of the apo E4 isoform was also identified in chimpanzee, baboon, macaques, and talapoins [6] suggesting that apo E4 is the ancestral allele. The entire vervet cDNA has not yet been published; however the existing vervet sequence (238 residues encoded by Exon 4) is 100% identical to baboon, and baboon apo E is 94% identical to the human protein (16 differences and 4 conserved changes). Molecular modeling showed that despite these changes, all amphipathic helices that are required for Apo E-lipid interactions are conserved [7]. Although direct measurements of vervet (or related species) apo E to amyloid have not been done, in cynomolgus monkeys (Macaca fascicularis), apo E was co-localized to plaques with amyloid deposits [11] suggesting a functional interaction.
Our findings in aged vervets show that average NA levels are significantly higher in aged versus younger vervets; however there was a large variance between the individuals in the aged group. Several studies have demonstrated that LC noradrenergic neuron cell numbers are reduced in normal aging by about 25% between 40 and 90 years of age; and accordingly that brain NA levels are reduced during the same period by approximately 50%. Further damage and loss of LC noradrenergic neurons and reduced levels of noradrenaline occurs in AD [18]. Although in AD there is clear evidence showing loss of LC NAergic neurons, several studies suggest that surviving LC neurons can compensate for that loss resulting in CSF NA levels that appear normal, or even increased during disease progression [9, 17, 30, 52]. Similarly, the levels of the rate limiting enzyme TH were found to be increased in the remaining neurons in the LC of AD brains [47], as well as increased dendritic sprouting in the LC, and increased axonal projections to the hippocampus [48]. Indeed it has been suggested that elevated NA levels may contribute to AD pathogenesis [11]. While the current study is underpowered to allow strong conclusions to be drawn, our data suggests that in aged vervet temporal cortex, at least some animals show lower NA levels than expected.
Several studies have reported that reduced CNS levels of NA levels increase neuroinflammation, as well as exacerbating AD type pathology in various rodent models of AD [21, 25]. However, it is not clear if NA loss alone is sufficient to exert those effects, or if a second stimulus is required. In APP:PS1 transgenic mice with global knockout of DBH, loss of NA did not alter several aspects of AD pathology including levels of APP, APP C-terminal fragments, or SDS soluble Aβ [19]. In contrast, treatment of those mice with DSP4 increased total Aβ levels, as was previously shown in single mutant APP/PS1 mice [21]. The reasons for the lack of increase are not clear; however one possibility is that loss of NA in the absence of increased inflammatory responses or LC neuronal damage, as occurs following DSP4 treatment, or during the accumulation of soluble and oligomeric forms of Aβ, is required to see potentiating effects of NA depletion. Whether LC damage occurs in the LC of older vervets remains to be determined.
We used qPCR to measure BDNF and GDNF mRNA levels in the temporal cortices, since both factors are reported to play a role in survival of LC noradrenergic neurons [4, 22, 38, 41], and both are regulated by NA [42]. BDNF levels are reduced with aging [50], in AD [7, 56, 57], and in mouse models of AD [8]. In our rodent studies, levels of BNDF were found decreased in a transgenic mouse model of AD, and those levels were restored when the mice were treated with drugs to raise central NA levels [26]. In contrast, in the current we did not detect any reduction in BDNF mRNA levels in the older animals compared to younger animals, and there was no correlation between BDNF levels and NA levels. This could be due to the different species used, the specific brain regions being analyzed, or to the magnitude of amyloid burden which is extensive in the transgenic mouse model used. In contrast, GDNF mRNA levels showed a trend towards being lower in older versus younger vervets. Although GDNF is down regulated in Parkinson’s disease [23], its regulation during aging or in Alzheimer’s disease has not been well characterized [46]. Our findings suggesting reduced GDNF expression are in line with a recent study showed the mature GDNF peptide was decreased in the middle temporal gyrus in samples from AD patients [1].
In contrast to BDNF, we observed an inverse relationship between GDNF mRNA levels and NA levels. The reason for this is not clear; however a major difference between BDNF and GDNF is that the latter is primarily expressed in glial cells [46]. It has been reported that inflammatory conditions can increase glial GDNF [3, 43, 49]. Since NA typically reduces glial activation, lower GDNF levels associated with higher NA levels could reflect reduced glial inflammatory activation in those samples. It should be noted that although we found higher GFAP levels associated with increased NA, increased GFAP expression should is not solely an indicator of inflammatory state, but should be considered an index of astrogliosis which includes trophic responses.
In summary, while the current study is limited due to the small group sizes, and the lack of intermediate aged vervets, our findings confirm the development of amyloid burden in the temporal cortex, associated with increased astrogliosis and changes with NA levels. The vervet may therefore represent a useful model for exploring the etiology of AD.
Acknowledgments
This work was supported by grants from the Department of Veterans Affairs (Merit Grant, Research Career Scientist Award, VA 247-P-0447, VA 240-12-C-0051), the NIH (RR019963/OD010965, RO1-HL87103), the Roena Kulynych Center for Memory and Cognition Research and the Claude D. Pepper Older Americans Independence Center of Wake Forest School of Medicine (P30-AG21332).
Footnotes
Publisher's Disclaimer: This is a PDF file of an unedited manuscript that has been accepted for publication. As a service to our customers we are providing this early version of the manuscript. The manuscript will undergo copyediting, typesetting, and review of the resulting proof before it is published in its final citable form. Please note that during the production process errors may be discovered which could affect the content, and all legal disclaimers that apply to the journal pertain.
Verification
- no actual or potential conflicts of interest
- no contracts relating to this research
- no other agreements involving financial interest in this work
This work was supported in part by a grant from the Department of Veterans Affairs
The data contained in the paper has not been previously published, nor is submitted elsewhere.
Statements as to use of animals is included.
All authors have reviewed and approved the contents of this manuscript.
References
- [1].Airavaara M, Pletnikova O, Doyle ME, Zhang YE, Troncoso JC, Liu QR. Identification of novel GDNF isoforms and cis-antisense GDNFOS gene and their regulation in human middle temporal gyrus of Alzheimer disease. J Biol Chem. 2011;286(52):45093–102. doi: 10.1074/jbc.M111.310250. [DOI] [PMC free article] [PubMed] [Google Scholar]
- [2].Akiyama H, Mori H, Saido T, Kondo H, Ikeda K, McGeer PL. Occurrence of the diffuse amyloid beta-protein (Abeta) deposits with numerous Abeta-containing glial cells in the cerebral cortex of patients with Alzheimer’s disease. Glia. 1999;25(4):324–31. doi: 10.1002/(sici)1098-1136(19990215)25:4<324::aid-glia2>3.0.co;2-5. [DOI] [PubMed] [Google Scholar]
- [3].Appel E, Kolman O, Kazimirsky G, Blumberg PM, Brodie C. Regulation of GDNF expression in cultured astrocytes by inflammatory stimuli. Neuroreport. 1997;8(15):3309–12. doi: 10.1097/00001756-199710200-00023. [DOI] [PubMed] [Google Scholar]
- [4].Arenas E, Trupp M, Akerud P, Ibanez CF. GDNF prevents degeneration and promotes the phenotype of brain noradrenergic neurons in vivo. Neuron. 1995;15(6):1465–73. doi: 10.1016/0896-6273(95)90024-1. [DOI] [PubMed] [Google Scholar]
- [5].Baker HF, Ridley RM, Duchen LW, Crow TJ, Bruton CJ. Experimental induction of beta-amyloid plaques and cerebral angiopathy in primates. Ann N Y Acad Sci. 1993;695:228–31. doi: 10.1111/j.1749-6632.1993.tb23057.x. [DOI] [PubMed] [Google Scholar]
- [6].Benarroch EE. The locus ceruleus norepinephrine system: functional organization and potential clinical significance. Neurology. 2009;73(20):1699–704. doi: 10.1212/WNL.0b013e3181c2937c. [DOI] [PubMed] [Google Scholar]
- [7].Connor B, Young D, Yan Q, Faull RL, Synek B, Dragunow M. Brain-derived neurotrophic factor is reduced in Alzheimer’s disease. Brain Res Mol Brain Res. 1997;49(1-2):71–81. doi: 10.1016/s0169-328x(97)00125-3. [DOI] [PubMed] [Google Scholar]
- [8].Devi L, Ohno M. 7,8-dihydroxyflavone, a small-molecule TrkB agonist, reverses memory deficits and BACE1 elevation in a mouse model of Alzheimer’s disease. Neuropsychopharmacology. 2012;37(2):434–44. doi: 10.1038/npp.2011.191. [DOI] [PMC free article] [PubMed] [Google Scholar]
- [9].Elrod R, Peskind ER, DiGiacomo L, Brodkin KI, Veith RC, Raskind MA. Effects of Alzheimer’s disease severity on cerebrospinal fluid norepinephrine concentration. Am J Psychiatry. 1997;154(1):25–30. doi: 10.1176/ajp.154.1.25. [DOI] [PubMed] [Google Scholar]
- [10].Fainman J, Eid MD, Ervin FR, Palmour RM. A primate model for Alzheimer’s disease: investigation of the apolipoprotein E profile of the vervet monkey of St. Kitts. Am J Med Genet B Neuropsychiatr Genet. 2007;144B(6):818–9. doi: 10.1002/ajmg.b.30276. [DOI] [PubMed] [Google Scholar]
- [11].Fitzgerald PJ. Is elevated norepinephrine an etiological factor in some cases of Alzheimer’s disease? Curr Alzheimer Res. 2010;7(6):506–16. doi: 10.2174/156720510792231775. [DOI] [PubMed] [Google Scholar]
- [12].Freimer NB, Service SK, Ophoff RA, Jasinska AJ, McKee K, Villeneuve A, Belisle A, Bailey JN, Breidenthal SE, Jorgensen MJ, Mann JJ, Cantor RM, Dewar K, Fairbanks LA. A quantitative trait locus for variation in dopamine metabolism mapped in a primate model using reference sequences from related species. Proc Natl Acad Sci U S A. 2007;104(40):15811–6. doi: 10.1073/pnas.0707640104. [DOI] [PMC free article] [PubMed] [Google Scholar]
- [13].Gearing M, Mori H, Mirra SS. Abeta-peptide length and apolipoprotein E genotype in Alzheimer’s disease. Ann Neurol. 1996;39(3):395–9. doi: 10.1002/ana.410390320. [DOI] [PubMed] [Google Scholar]
- [14].Gearing M, Rebeck GW, Hyman BT, Tigges J, Mirra SS. Neuropathology and apolipoprotein E profile of aged chimpanzees: implications for Alzheimer disease. Proc Natl Acad Sci U S A. 1994;91(20):9382–6. doi: 10.1073/pnas.91.20.9382. [DOI] [PMC free article] [PubMed] [Google Scholar]
- [15].Gearing M, Tigges J, Mori H, Mirra SS. A beta40 is a major form of beta-amyloid in nonhuman primates. Neurobiol Aging. 1996;17(6):903–8. doi: 10.1016/s0197-4580(96)00164-9. [DOI] [PubMed] [Google Scholar]
- [16].Gearing M, Tigges J, Mori H, Mirra SS. beta-Amyloid (A beta) deposition in the brains of aged orangutans. Neurobiol Aging. 1997;18(2):139–46. doi: 10.1016/s0197-4580(97)00012-2. [DOI] [PubMed] [Google Scholar]
- [17].Gottfries CG, Adolfsson R, Aquilonius SM, Carlsson A, Eckernas SA, Nordberg A, Oreland L, Svennerholm L, Wiberg A, Winblad B. Biochemical changes in dementia disorders of Alzheimer type (AD/SDAT) Neurobiol Aging. 1983;4(4):261–71. doi: 10.1016/0197-4580(83)90002-7. [DOI] [PubMed] [Google Scholar]
- [18].Grudzien A, Shaw P, Weintraub S, Bigio E, Mash DC, Mesulam MM. Locus coeruleus neurofibrillary degeneration in aging, mild cognitive impairment and early Alzheimer’s disease. Neurobiol Aging. 2007;28(3):327–35. doi: 10.1016/j.neurobiolaging.2006.02.007. [DOI] [PubMed] [Google Scholar]
- [19].Hammerschmidt T, Kummer MP, Terwel D, Martinez A, Gorji A, Pape HC, Rommelfanger KS, Schroeder JP, Stoll M, Schultze J, Weinshenker D, Heneka MT. Selective Loss of Noradrenaline Exacerbates Early Cognitive Dysfunction and Synaptic Deficits in APP/PS1 Mice. Biol Psychiatry. 2013;73(5):454–63. doi: 10.1016/j.biopsych.2012.06.013. [DOI] [PMC free article] [PubMed] [Google Scholar]
- [20].Heneka MT, Galea E, Gavriluyk V, Dumitrescu-Ozimek L, Daeschner J, O’Banion MK, Weinberg G, Klockgether T, Feinstein DL. Noradrenergic depletion potentiates beta -amyloid-induced cortical inflammation: implications for Alzheimer’s disease. J Neurosci. 2002;22(7):2434–42. doi: 10.1523/JNEUROSCI.22-07-02434.2002. [DOI] [PMC free article] [PubMed] [Google Scholar]
- [21].Heneka MT, Ramanathan M, Jacobs AH, Dumitrescu-Ozimek L, Bilkei-Gorzo A, Debeir T, Sastre M, Galldiks N, Zimmer A, Hoehn M, Heiss WD, Klockgether T, Staufenbiel M. Locus ceruleus degeneration promotes Alzheimer pathogenesis in amyloid precursor protein 23 transgenic mice. J Neurosci. 2006;26(5):1343–54. doi: 10.1523/JNEUROSCI.4236-05.2006. [DOI] [PMC free article] [PubMed] [Google Scholar]
- [22].Holm PC, Rodriguez FJ, Kresse A, Canals JM, Silos-Santiago I, Arenas E. Crucial role of TrkB ligands in the survival and phenotypic differentiation of developing locus coeruleus noradrenergic neurons. Development. 2003;130(15):3535–45. doi: 10.1242/dev.00565. [DOI] [PubMed] [Google Scholar]
- [23].Hunot S, Bernard V, Faucheux B, Boissiere F, Leguern E, Brana C, Gautris PP, Guerin J, Bloch B, Agid Y, Hirsch EC. Glial cell line-derived neurotrophic factor (GDNF) gene expression in the human brain: a post mortem in situ hybridization study with special reference to Parkinson’s disease. J Neural Transm. 1996;103(8-9):1043–52. doi: 10.1007/BF01291789. [DOI] [PubMed] [Google Scholar]
- [24].Jasinska AJ, Lin MK, Service S, Choi OW, DeYoung J, Grujic O, Kong SY, Jung Y, Jorgensen MJ, Fairbanks LA, Turner T, Cantor RM, Wasserscheid J, Dewar K, Warren W, Wilson RK, Weinstock G, Jentsch JD, Freimer NB. A non-human primate system for large-scale genetic studies of complex traits. Hum Mol Genet. 2012;21(15):3307–16. doi: 10.1093/hmg/dds160. [DOI] [PMC free article] [PubMed] [Google Scholar]
- [25].Kalinin S, Gavrilyuk V, Polak PE, Vasser R, Zhao J, Heneka MT, Feinstein DL. Noradrenaline deficiency in brain increases beta-amyloid plaque burden in an animal model of Alzheimer’s disease. Neurobiol Aging. 2007;28(8):1206–14. doi: 10.1016/j.neurobiolaging.2006.06.003. [DOI] [PubMed] [Google Scholar]
- [26].Kalinin S, Polak PE, Lin SX, Sakharkar AJ, Pandey SC, Feinstein DL. The noradrenaline precursor L-DOPS reduces pathology in a mouse model of Alzheimer’s disease. Neurobiol Aging. 2012;33(8):1651–63. doi: 10.1016/j.neurobiolaging.2011.04.012. [DOI] [PMC free article] [PubMed] [Google Scholar]
- [27].Kalinin S, Polak PE, Madrigal JL, Gavrilyuk V, Sharp A, Chauhan N, Marien M, Colpaert F, Feinstein DL. Beta-amyloid-dependent expression of NOS2 in neurons: prevention by an alpha2-adrenergic antagonist. Antioxid Redox Signal. 2006;8(5-6):873–83. doi: 10.1089/ars.2006.8.873. [DOI] [PubMed] [Google Scholar]
- [28].Kavanagh K, Fairbanks LA, Bailey JN, Jorgensen MJ, Wilson M, Zhang L, Rudel LL, Wagner JD. Characterization and heritability of obesity and associated risk factors in vervet monkeys. Obesity (Silver Spring) 2007;15(7):1666–74. doi: 10.1038/oby.2007.199. [DOI] [PubMed] [Google Scholar]
- [29].Lemere CA, Beierschmitt A, Iglesias M, Spooner ET, Bloom JK, Leverone JF, Zheng JB, Seabrook TJ, Louard D, Li D, Selkoe DJ, Palmour RM, Ervin FR. Alzheimer’s disease abeta vaccine reduces central nervous system abeta levels in a non-human primate, the Caribbean vervet. Am J Pathol. 2004;165(1):283–97. doi: 10.1016/s0002-9440(10)63296-8. [DOI] [PMC free article] [PubMed] [Google Scholar]
- [30].Mann JJ, Stanley M, Neophytides A, de Leon MJ, Ferris SH, Gershon S. Central amine metabolism in Alzheimer’s disease: in vivo relationship to cognitive deficit. Neurobiol Aging. 1981;2(1):57–60. doi: 10.1016/0197-4580(81)90060-9. [DOI] [PubMed] [Google Scholar]
- [31].Marien MR, Colpaert FC, Rosenquist AC. Noradrenergic mechanisms in neurodegenerative diseases: a theory. Brain Res Brain Res Rev. 2004;45(1):38–78. doi: 10.1016/j.brainresrev.2004.02.002. [DOI] [PubMed] [Google Scholar]
- [32].McNamee EN, Griffin EW, Ryan KM, Ryan KJ, Heffernan S, Harkin A, Connor TJ. Noradrenaline acting at beta-adrenoceptors induces expression of IL-1beta and its negative regulators IL-1ra and IL-1RII, and drives an overall anti-inflammatory phenotype in rat cortex. Neuropharmacology. 2010;59(1-2):37–48. doi: 10.1016/j.neuropharm.2010.03.014. [DOI] [PubMed] [Google Scholar]
- [33].McNamee EN, Ryan KM, Griffin EW, Gonzalez-Reyes RE, Ryan KJ, Harkin A, Connor TJ. Noradrenaline acting at central beta-adrenoceptors induces interleukin-10 and suppressor of cytokine signaling-3 expression in rat brain: Implications for neurodegeneration. Brain Behav Immun. 2010;24(4):660–71. doi: 10.1016/j.bbi.2010.02.005. [DOI] [PubMed] [Google Scholar]
- [34].Melega WP, Jorgensen MJ, Lacan G, Way BM, Pham J, Morton G, Cho AK, Fairbanks LA. Long-term methamphetamine administration in the vervet monkey models aspects of a human exposure: brain neurotoxicity and behavioral profiles. Neuropsychopharmacology. 2008;33(6):1441–52. doi: 10.1038/sj.npp.1301502. [DOI] [PubMed] [Google Scholar]
- [35].Mufson EJ, Benzing WC, Cole GM, Wang H, Emerich DF, Sladek JR, Jr., Morrison JH, Kordower JH. Apolipoprotein E-immunoreactivity in aged rhesus monkey cortex: colocalization with amyloid plaques. Neurobiol Aging. 1994;15(5):621–7. doi: 10.1016/0197-4580(94)00064-6. [DOI] [PubMed] [Google Scholar]
- [36].O’Sullivan JB, Ryan KM, Harkin A, Connor TJ. Noradrenaline reuptake inhibitors inhibit expression of chemokines IP-10 and RANTES and cell adhesion molecules VCAM-1 and ICAM-1 in the CNS following a systemic inflammatory challenge. J Neuroimmunol. 2010;220(1-2):34–42. doi: 10.1016/j.jneuroim.2009.12.007. [DOI] [PubMed] [Google Scholar]
- [37].Palmer AM, DeKosky ST. Monoamine neurons in aging and Alzheimer’s disease. J Neural Transm Gen Sect. 1993;91(2-3):135–59. doi: 10.1007/BF01245229. [DOI] [PubMed] [Google Scholar]
- [38].Pascual A, Hidalgo-Figueroa M, Piruat JI, Pintado CO, Gomez-Diaz R, Lopez-Barneo J. Absolute requirement of GDNF for adult catecholaminergic neuron survival. Nat Neurosci. 2008;11(7):755–61. doi: 10.1038/nn.2136. [DOI] [PubMed] [Google Scholar]
- [39].Poduri A, Gearing M, Rebeck GW, Mirra SS, Tigges J, Hyman BT. Apolipoprotein E4 and beta amyloid in senile plaques and cerebral blood vessels of aged rhesus monkeys. Am J Pathol. 1994;144(6):1183–7. [PMC free article] [PubMed] [Google Scholar]
- [40].Polak PE, Kalinin S, Feinstein DL. Locus coeruleus damage and noradrenaline reductions in multiple sclerosis and experimental autoimmune encephalomyelitis. Brain. 2011;134(Pt 3):665–77. doi: 10.1093/brain/awq362. [DOI] [PMC free article] [PubMed] [Google Scholar]
- [41].Quintero EM, Willis LM, Zaman V, Lee J, Boger HA, Tomac A, Hoffer BJ, Stromberg I, Granholm AC. Glial cell line-derived neurotrophic factor is essential for neuronal survival in the locus coeruleus-hippocampal noradrenergic pathway. Neuroscience. 2004;124(1):137–46. doi: 10.1016/j.neuroscience.2003.11.001. [DOI] [PubMed] [Google Scholar]
- [42].Remy S, Naveilhan P, Brachet P, Neveu I. Differential regulation of GDNF, neurturin, and their receptors in primary cultures of rat glial cells. J Neurosci Res. 2001;64(3):242–51. doi: 10.1002/jnr.1072. [DOI] [PubMed] [Google Scholar]
- [43].Remy S, Naveilhan P, Paille V, Brachet P, Neveu I. Lipopolysaccharide and TNFalpha regulate the expression of GDNF, neurturin and their receptors. Neuroreport. 2003;14(11):1529–34. doi: 10.1097/00001756-200308060-00026. [DOI] [PubMed] [Google Scholar]
- [44].Selkoe DJ, Bell DS, Podlisny MB, Price DL, Cork LC. Conservation of brain amyloid proteins in aged mammals and humans with Alzheimer’s disease. Science. 1987;235(4791):873–7. doi: 10.1126/science.3544219. [DOI] [PubMed] [Google Scholar]
- [45].Seu E, Lang A, Rivera RJ, Jentsch JD. Inhibition of the norepinephrine transporter improves behavioral flexibility in rats and monkeys. Psychopharmacology (Berl) 2009;202(1-3):505–19. doi: 10.1007/s00213-008-1250-4. [DOI] [PMC free article] [PubMed] [Google Scholar]
- [46].Siegel GJ, Chauhan NB. Neurotrophic factors in Alzheimer’s and Parkinson’s disease brain. Brain Res Brain Res Rev. 2000;33(2-3):199–227. doi: 10.1016/s0165-0173(00)00030-8. [DOI] [PubMed] [Google Scholar]
- [47].Szot P, Leverenz JB, Peskind ER, Kiyasu E, Rohde K, Miller MA, Raskind MA. Tyrosine hydroxylase and norepinephrine transporter mRNA expression in the locus coeruleus in Alzheimer’s disease. Brain Res Mol Brain Res. 2000;84(1-2):135–40. doi: 10.1016/s0169-328x(00)00168-6. [DOI] [PubMed] [Google Scholar]
- [48].Szot P, White SS, Greenup JL, Leverenz JB, Peskind ER, Raskind MA. Compensatory changes in the noradrenergic nervous system in the locus ceruleus and hippocampus of postmortem subjects with Alzheimer’s disease and dementia with Lewy bodies. J Neurosci. 2006;26(2):467–78. doi: 10.1523/JNEUROSCI.4265-05.2006. [DOI] [PMC free article] [PubMed] [Google Scholar]
- [49].Tanaka T, Oh-Hashi K, Shitara H, Hirata Y, Kiuchi K. NF-kappaB independent signaling pathway is responsible for LPS-induced GDNF gene expression in primary rat glial cultures. Neurosci Lett. 2008;431(3):262–7. doi: 10.1016/j.neulet.2007.11.051. [DOI] [PubMed] [Google Scholar]
- [50].Tapia-Arancibia L, Aliaga E, Silhol M, Arancibia S. New insights into brain BDNF function in normal aging and Alzheimer disease. Brain Res Rev. 2008;59(1):201–20. doi: 10.1016/j.brainresrev.2008.07.007. [DOI] [PubMed] [Google Scholar]
- [51].Taylor JR, Elsworth JD, Roth RH, Sladek JR, Jr., Redmond DE., Jr. Severe long-term 1-methyl-4-phenyl-1,2,3,6-tetrahydropyridine-induced parkinsonism in the vervet monkey (Cercopithecus aethiops sabaeus) Neuroscience. 1997;81(3):745–55. doi: 10.1016/s0306-4522(97)00214-5. [DOI] [PubMed] [Google Scholar]
- [52].Tohgi H, Ueno M, Abe T, Takahashi S, Nozaki Y. Concentrations of monoamines and their metabolites in the cerebrospinal fluid from patients with senile dementia of the Alzheimer type and vascular dementia of the Binswanger type. J Neural Transm Park Dis Dement Sect. 1992;4(1):69–77. doi: 10.1007/BF02257623. [DOI] [PubMed] [Google Scholar]
- [53].Trojanowski JQ, Atkinson B, Lee VM. An immunocytochemical study of normal and abnormal human cerebrospinal fluid with monoclonal antibodies to glial fibrillary acidic protein. Acta Cytol. 1986;30(3):235–9. [PubMed] [Google Scholar]
- [54].Weinshenker D. Functional consequences of locus coeruleus degeneration in Alzheimer’s disease. Curr Alzheimer Res. 2008;5(3):342–5. doi: 10.2174/156720508784533286. [DOI] [PubMed] [Google Scholar]
- [55].Weinshenker D. Functional consequences of locus coeruleus degeneration in Alzheimer’s disease. Curr Alzheimer Res. 2008;5(3):342–5. doi: 10.2174/156720508784533286. [DOI] [PubMed] [Google Scholar]
- [56].Ye X, Tai W, Zhang D. The early events of Alzheimer’s disease pathology: from mitochondrial dysfunction to BDNF axonal transport deficits. Neurobiol Aging. 2012;33(6):1122–10. doi: 10.1016/j.neurobiolaging.2011.11.004. [DOI] [PubMed] [Google Scholar]
- [57].Zuccato C, Cattaneo E. Brain-derived neurotrophic factor in neurodegenerative diseases. Nat Rev Neurol. 2009;5(6):311–22. doi: 10.1038/nrneurol.2009.54. [DOI] [PubMed] [Google Scholar]


