

Abstract
Group B Streptococcus (GBS) is an important pathogen and is associated with sepsis and meningitis in neonates and infants. An ex vivo model that facilitates observations of GBS interactions with multiple host cell types over time was used to study its pathogenicity. GBS infections were associated with profound reductions in fetal lung; explant size, and airway branching. Elevated levels of apoptosis subsequent to GBS infections were observed by whole-mount confocal immunofluorescence using activated-caspase-3-antibodies and terminal deoxynucleotidyl transferase dUTP nick end-labeling (TUNEL) assays. The caspase inhibitor Z-VAD-FMK abolished the increase in TUNEL-positive cells associated with GBS infections, indicating that the GBS-induced apoptosis was caspase-dependent. Digital image analyses revealed that both GBS and the active form of caspase-3 were distributed primarily within the lung interstitium, suggesting that these tissues are important targets for GBS. Antibodies to the active form of caspase-3 colocalized with both macrophage- and erythroblast-markers, suggesting that these hematopoietic cells are vulnerable to GBS-mediated pathogenesis. These studies suggest that GBS infections profoundly alter lung morphology and caspase-dependent hematopoietic cell apoptosis within the lung interstitium play roles in GBS pathophysiology in this model.
Keywords: Ex vivo, Sepsis, Gram-positive, Streptococcus agalactiae, Streptococcal, Respiratory, Pneumonia, Quantitative colocalization
Introduction
Streptococcus agalactiae or group B Streptococcus (GBS) is a major Gram-positive bacterial pathogen of fetuses, neonates, infants, and immune compromised adults [1–3]. Despite the widespread usage of maternal antibiotic prophylaxis, GBS is still the leading cause of early-onset neonatal sepsis in the US [4]. Moreover, a safe and effective vaccine still appears to be several years away [5]. Thus, understanding the pathogenic mechanisms of this organism may facilitate the development of the next generation of treatment modalities.
The pathogenic mechanisms of GBS are associated with several virulence factors of the organism including: surface-associated proteins, capsular polysaccharides, and soluble cytotoxins [1, 6, 7]. Factors including the β-hemolysin/cytolysin (β-H/C toxin) appear to facilitate pathogenesis via induction of host cell lysis and subsequent cell death [8–11]. GBS is associated with the death of several cell types including macrophages, neutrophils, endothelial cells, and epithelial cells [1, 7–17].
GBS induction of host cell death includes both necrotic and apoptotic mechanisms [8–10, 18]. Apoptosis is a type of programmed cell death of which multiple types of both caspase-dependent and -independent mechanisms have been described [19, 20]. Caspases are cysteine-proteases that play roles in apoptosis, necrosis, and inflammation. Caspase-3 is defined as an effector caspase, it is activated by apical or upstream caspases and its activity can be inhibited by peptide analogs including N-benzyloxycarbonyl-Val-Ala-Asp-fluoromethyl-ketone (Z-VAD-FMK). It has been used to inhibit neuronal cell death and white blood cell influx into the cerebrospinal fluid compartment in experimental pneumococcal meningitis [21].
The precise mechanisms of GBS pathogenicity and tissue targeting of a neonate are unknown. Clinical studies and animal models have suggested that the lung may be the primary portal providing pathogen access to the host [22, 23]. However, it is not known which specific lung cell types interact with GBS. Moreover, the pathogenic consequences of these GBS/lung cell interactions are not well defined.
Therefore, GBS pathogenic mechanisms were studied via an ex vivo model, which enables the observation of dynamic host-pathogen interactions with an intact tissue bed over the course of an infection [24]. The data herein suggest that GBS infections are associated not only with profound lung morphological changes, but GBS targets the lung interstitial cells inducing caspase-dependent apoptosis. Within the interstitium of these fetal lung explants, hematopoietic cells including macrophages and erythroblasts were identified as exquisitely sensitive to GBS pathogenesis.
Materials and Methods
Materials and Reagents
Chemicals and reagents were purchased from Sigma-Aldrich (St. Louis, MO) and Fisher Scientific (Pittsburgh, PA) unless otherwise noted. The GBS strains A909 (serotype Ia) and COH1 (serotype III) were obtained from the Channing Laboratory [25]. The E. coli strain EC1 is a derivative of the laboratory strain DH5α [24]. Antibodies used in these studies are shown in Table I. All secondary antibody conjugates were purchased from Jackson ImmunoResearch Laboratories, Inc. (West Grove, PA).
Table I.
Antibodies/Probes
| Antibody/Probe (Abbreviation) | Type | Source |
|---|---|---|
| Group B-Specific Polysaccharide (GBS-P) | Rabbit Polyclonal | Abcam (Cambridge, MA) |
| Activated Caspase-3 (Cp3) | Rabbit Monoclonal | BD Biosciences (San Diego, CA) |
| Bandeiraea simplicifolia lectin-TRITC (BSI) | Polyvalent Lectin BSI* | Sigma-Aldrich (St. Louis, MO) |
| Hemoglobin (Hb) | Rabbit Polyclonal | Cappel/ICN/MP Pharmaceuticals (Solon, OH) |
| CD68 | Goat Polyclonal | SCBT (Santa Cruz, CA) |
Major affinity for terminal α-D-galactose with a secondary affinity for terminal N-acetyl-α-D-galactosamine residues
Fetal Lung Explants
Fetal rat lung explants were prepared as described with a few modifications [26]. Animals were housed in accordance with the Boston College IACUC standards using approved protocol #2011-007-01. Timed-pregnant Sprague-Dawley rats (Taconic Farms, Hudson, NY) were euthanized in carbon dioxide at embryonic day 15 (E15). Fetuses were removed by cesarean section and placed in Hank’s balanced salt solution (HBSS, Invitrogen) on ice. Fetuses were decapitated and lungs were removed from the surrounding tissue using fine forceps under a dissecting microscope. An average of two explants were placed on each 0.45 μm Organotypic (Millipore) membrane insert. Inserts were placed in 6-well plates (Costar, Lowell, MA) containing 2 ml of BGJb (Invitrogen, Carlsbad, CA) containing antibiotic-antimycotic solution (Cellgro, Manassas, VA) and incubated for 24 hours at 37°C in 5% CO2. Explants were subsequently washed three times with ice-cold PBS to remove BGJb-media and placed in 1 ml of Minimum Essential Media (MEMα, Invitrogen) containing 1% fetal bovine serum (Invitrogen) and Amphotericin B (2.5 μg/ml, Sigma) (infection media) for the duration of the experiments. Media used for heat-killed (HK) and PBS-treatment groups contained the antibiotic-antimycotic solution as well. However, addition of the antibiotic-antimycotic solution to the negative controls did not alter the growth or morphology of the explants in any detectable manner.
Infection Procedure
GBS organisms were prepared for infections as follows. GBS were initially grown overnight at 37°C followed by growth at room temperature for 3 – 7 days on blood agar plates. Colonies became quite large under these conditions indicating robust viability and thus providing adequate numbers of GBS for both live (GBS-L) and heat-killed (GBS-HK) organisms. For each experiment, an individual colony was resuspended in 4.5 ml phosphate buffered saline (PBS). An aliquot of this was diluted 1/50 in phosphate-buffered saline (PBS) and kept on ice for Live infections and was reproducibly shown to be 1.0 – 3.0 E7 colony-forming units (CFU)/ml by serial dilution plating. The GBS-HK samples were prepared by concentrating the remaining organisms 20 fold by centrifugation, incubating at 80°C for 20 minutes, and maintaining on ice until used for infections. The GBS-HK sample represents a 1,000-fold excess of organisms over the GBS-L.
Infections using the E. coli strain EC1 were carried out as follows. Individual colonies grown on Luria-Broth agar plates were resuspended in PBS to ~1 - 5E7 CFU/ml. Heat-killed aliquots were prepared by concentrating live organisms by three orders of magnitude via centrifugation and heating at 80°C for 20 min. Aliquots of 10 μl of PBS, GBS, or E. coli (both live and dead) were added directly on top of the explants at t = 0.
Explant Quantitation
Quantitation of fetal rat lung explant areas is described in Figure S1. The percent change in explant areas were calculated by subtracting the explant areas at experiment termination (Areat) from the explant area at initiation (Areai), dividing by Areai, and multiplying by 100. These values are the percent changes in explant areas subsequent to GBS infections. All analyses were carried out “blinded” to the treatment schema.
Spent Media Analysis
After 66.5 hours treatment, the spent media from the explants were collected in microcentrifuge tubes, filtered using Ultrafree-MC Centrifugal Filter Units (Millipore, Beford, MA), and stored at −80°C until analyzed. For the analyses below, all media samples were heated in a water bath to 80°C for 5 minutes and subsequently kept on ice to reduce any remaining enzymatic activities.
Glucose was measured using a D-Glucose UV-method analysis kit according to the manufacture’s protocol (R-Biopharm AG, Darmstadt, Germany). The assay was scaled to a 96-well microplate format using black/clear Imaging Plates (BD Falcon) and samples were read at 340 nm using a Synergy H4 Hybrid (Biotek, Winooski, VT) microplate reader. Every sample was measured in triplicate.
The pH values of the spent media samples were measured with an Orion micro pH electrode (Thermo Scientific). Spent media samples of 100 μl were placed in 0.5 ml micro-centrifuge tubes, incubated in 5% CO2 at 37°C for 2 hours prior to measurements, and read immediately after removal from the incubator. Fresh media (MEMα containing 1% fetal bovine serum and Amphotericin B) was used to determine the baseline pH values. Deviations from the baseline are indicated as the Δ pH.
Analysis of L-Lactate in the spent media samples was carried out essentially as previously described [24]. Assays were scaled to a 96-well microplate format using black/clear Imaging Plates (BD Falcon) and samples were read at 340 nm using a Synergy H4 Hybrid (Biotek, Winooski, VT) microplate reader. Every sample was measured in quadruplicate.
Statistical analyses for the above assays were carried out by analysis of variance (ANOVA) using the Bonferroni’s multiple comparison test [27].
Peripheral Bud Counts
Peripheral bud counts (PBC) were obtained directly from the images. The PBCs were normalized by dividing PBCs at the experiment termination by the PBCs at the experiment initiation. Statistical analyses were carried out using the Student’s t-test.
Whole-Mount Immunofluorescence of Activated Caspase-3
Whole-mount immunofluorescence was used to characterize activated caspase-3 activities in fetal rat lung explants subsequent to three-day infections with either HK or live GBS. Tissues were fixed for at least 48 hours in PBS-buffered 4% paraformaldehyde. Fixed tissues were washed in PBS three times (1 hour each) followed by tissue permeabilization in 0.1% Triton X-100 in PBS while shaking for 30 minutes. After an additional three washes in PBS, tissues were blocked using 5% normal donkey serum (Jackson ImmunoResearch Laboratories, Inc., West Grove, PA) in PBS for 1 hour and followed by three PBS washes. Tissues were incubated for 1 hour with activated caspase-3 rabbit monoclonal antibodies (BD Biosciences, San Jose, CA) at a 1/500 dilution in PBS containing 2% bovine serum albumin (BSA). After three PBS washes, donkey anti-rabbit CY3 secondary antibody conjugates (Jackson ImmunoResearch Laboratories, Inc.) were added at dilutions of 1/200 in 2% BSA-PBS. After a 1-hour incubation, tissues were washed once in PBS for 5 min and incubated for 30 minutes in Hoechst 33342 at 0.5 μg/ml followed by three PBS washes. Tissues were placed into a drop of Vectashield anti-fade (Vector Laboratories, Burlingame, CA) onto Probe-on slides and covered with coverslips. Confocal microscopy was carried out with a TCS SP5 (Leica Microsystems, Bannockburn, IL).
Images of both activated-caspase-3 and Hoechst staining were converted to grayscale and then to binary images using the threshold function of Canvas. The binary files were quantitated using ImageJ software [28]. Values for each image of activated caspase-3 staining were normalized to its values associated with its Hoechst staining. Statistical analyses were carried out using the Student’s t-test.
Whole-mount TUNEL Analysis
Explants were treated as above with the exception that the caspase inhibitor, Z-VAD-FMK, (Enzo Life Sciences, Farmingdale, NY) or DMSO (negative control) was added to the media just prior to infection at a concentration of 50 μM. Quantitation of the TUNEL images used essentially the same procedure as used for the activated caspase-3 quantitation (above). The signals corresponding to TUNEL-positivity were normalized to the corresponding nuclear DNA (Hoechst) staining for each image. The mean values of TUNEL/Hoechst ratios from the four treatment groups (HK, DMSO), (HK, Z-VAD-FMK), (Live, DMSO), and (Live, Z-VAD-FMK) of three independent experiments were compared by analysis of variance (ANOVA) [27].
Quantitative Tissue Distribution Analyses of GBS and Activated Caspase-3
Figure S2 illustrates the methods used for quantitative analyses of cell/tissue distribution of both GBS and the active form of Caspase-3 (Cp3). Statistical analyses were carried out using the Student’s t-test.
Quantitative Colocalization
Procedures for quantitative colocalization analyses are illustrated in Fig. S3. Multi-label immunofluorescence was carried out essentially as described above for the immunofluorescence of caspase-3 (2.7). Either the BSI lectin (Table 1) or CD68-specific antibodies (Table 1) were incubated together with Cp3-specific antibodies for 1 h, at dilutions of 1/1000 in 2% BSA-PBS. The CD68-specific antibodies were detected with a secondary conjugate of donkey anti-goat labeled with CY3. The Hb-specific antibodies were incubated with the tissues subsequent to donkey anti-rabbit-FITC secondary conjugates to reduce potential cross-detection of the Cp3-specific antibodies with the donkey anti-rabbit-CY3 secondary conjugate. Binary images were quantitated in ImageJ and statistical analyses were carried out using the Student’s t-test [28].
Results
Infection Associated Explant Morphological Changes
Fetal rat lung explants were infected with live GBS strain A909 (GBS-L), heat-killed organisms (GBS-HK), or PBS (the latter two as negative controls) for slightly less than three days to characterize the effects of GBS on whole tissues. The time frame used was based on previous reports of in vivo GBS infection models [29–31]. Figure 1a shows gross observations of explant tissues at the initiation and termination of the experiment. These data indicate that the explants exposed to GBS-L do not increase in size in contrast to the PBS and GBS-HK controls. To verify these observations, the explant areas were quantitated using digital image analyses. Figure 1b shows that the percent change of explant areas over the course of the experiment is negative for the live GBS infection, indicating that the explants shrink (tissue atrophy) subsequent to live GBS infection. Moreover, virtually identical results were obtained with a representative GBS serotype III strain COH1, suggesting that the tissue atrophy appears to be GBS-serotype/strain independent (data not shown).
Figure 1. GBS infections alter lung explant tissue growth.
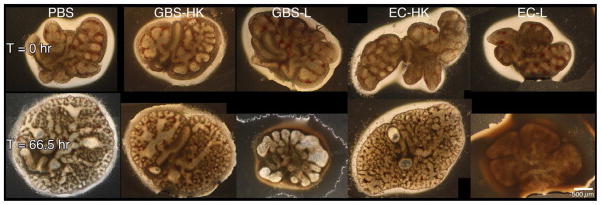

Fetal rat lung explants were infected with PBS (negative control), a 1,000-fold excess heat-killed GBS strain A909 (GBS-HK), live GBS strain A909 (GBS-L), and E. coli strain EC1 (EC-HK and EC-L). A. Representative phase contrast images of fetal rat lung explants at initiation and termination of experiment. Composite images were used for tissues exceeded the image field size. B. Explant area percent changes subsequent to GBS infections. Data shows the values from at least six independent experiments in which (1 – 4) explants were used per experiment. Error bars show standard error of the mean (SEM) and asterisk indicates statistical significance for all comparisons with GBS-L (at least P < 0.01).
To determine if the above observations were unique to GBS infections, explants were also infected with either heat-killed (EC-HK) or live E. coli strain EC1 (EC-L), a nonlethal derivative of strain DH5α [24]. Figure 1 shows that explants infected with EC1-L failed to show tissue atrophy observed in the live GBS infections. These data suggest that the observed tissue atrophy might be unique consequence of GBS infections.
Since the mechanism(s) of the observed tissue atrophy associated with the ex vivo GBS infection is/are not known, nutrient depletion, pH changes, and lactate accumulation, were investigated as potential causal agents. Figure 2a shows that glucose depletion occurred in the spent media of explants infected with either live GBS or E. coli, suggesting that the observed tissue atrophy is not the result of glucose depletion per se. This hypothesis is supported by observations that fetal rat lung explants grew (albeit at a slower rate) in tissue culture media lacking glucose over the time frame used in these experiments (data not shown).
Figure 2. Infection-associated Media Changes.


Media changes including glucose concentration, pH changes (Δ pH), and L-lactate were measured in the spent media at the experimental termination (66.5 hrs.). A. Concentrations of glucose in treatment groups, asterisk indicates statistical significance for both GBS-L and EC-L with respect to the other samples (P < 0.001). B. Difference in spent media pH (Δ pH) between termination and initial values for treatment groups. Asterisk indicates statistical significance for GBS-L with respect to the other samples (P < 0.001). C. Concentrations of L-lactate in spent media subsequent to infections. Data points of all three graphs represent mean values from at least 5 independent experiments and error bars represent SEM.
Since the glucose appeared to be entirely consumed in the infected explants, it was expected that the pH of the media would decline and L-lactate would accumulate as a consequence of both bacterial and tissue fermentation. Figures 2b and 2c show that both the pH declined and L-lactate accumulated in the spent media from the GBS- but not E. coli-infected explants. These data suggest that the observed tissue atrophy might be associated with either increased media acidification and/or lactate accumulation. In addition, since the differences between the PBS- and HK-treatment groups were insignificant in the above analyses, only HK-treated explants were used as negative controls in subsequent studies.
GBS Alters Fetal Rat Lung Branching Morphogenesis
Lung explant areas are a good approximation of tissue growth, while branching morphogenesis is often described as an approximation of tissue differentiation [26, 32, 33]. To determine if GBS infections altered the differentiation potential of these tissues, similar experiments were carried out as described above and the peripheral branch counts (PBC) of the tissues were measured at the beginning and end of each experiment. Figure 3a shows a representative section of explant tissue illustrating the differences in branching observed between the HK and live infected tissues. Figure 3b shows comparisons of the ratios of terminal and initial explant PBCs treated with either HK- or live-GBS. These data show that airway branching morphogenesis was ~4 fold lower in the live infection compared with the HK (control) infection over the course of the experiment, suggesting that GBS infections negatively impact both fetal rat lung tissue growth and differentiation in this ex vivo model.
Figure 3. GBS infections alter fetal lung branching morphogenesis.
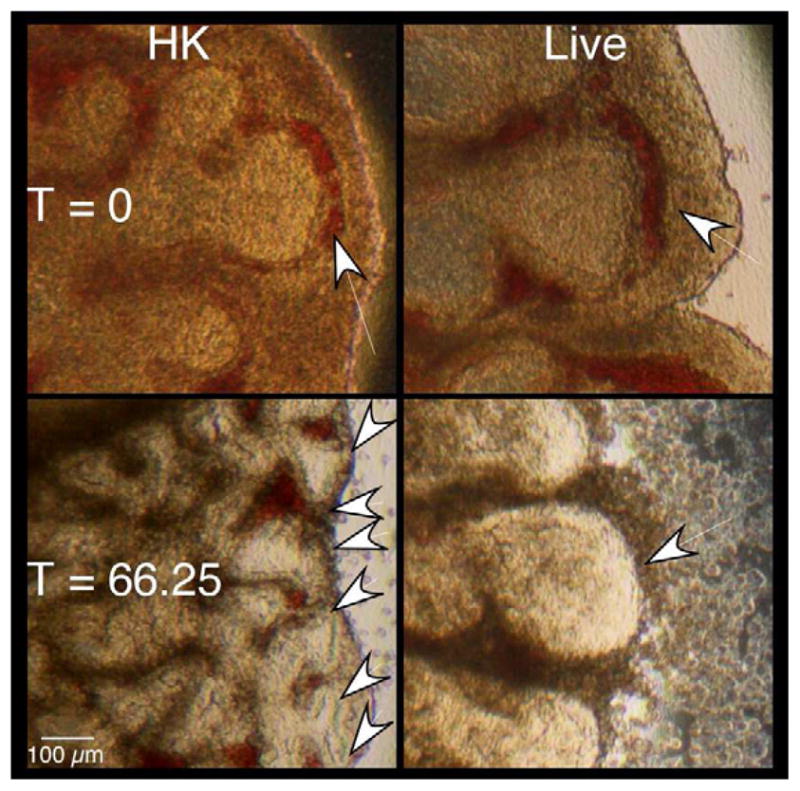

Branches formed at experimental termination (three days) in explants infected with either heat-killed (HK) or live GBS strain A909. A. Images of sections from representative explants at initiation and termination of experiments. Arrows indicate peripheral lung bud numbers. B. Mean ratios of terminal over initial peripheral bud counts (PBCs). Data collected from four independent experiments of which at least two replicate lung pairs for each treatment group were used. Error bars are SEM and an asterisk indicates statistical significance (P < 0.001).
GBS Induces a Caspase-dependent Apoptosis
To determine if cell death contributed to the morphological changes associated with live GBS infections, apoptosis was characterized using whole-mount confocal immunofluorescence with activated caspase-3-specific antibodies [26]. Fetal rat lung explants were infected with GBS strain A909 either heat-killed (HK) or live (Live) as in previous experiments. Figure 4a shows staining corresponding to activated caspase-3 is elevated in explants infected with live GBS compared with HK organisms. To verify these observations, quantitative digital image analysis was carried out. Figure 4b shows that staining corresponding to activated caspase-3 is significantly higher in the live infection compared with the HK-treated tissues, confirming the initial observations.
Figure 4. Tissue distribution of activated caspase-3 subsequent to GBS infections.


Fetal lung explants were infected with either heat killed (HK) or live GBS as in previous experiments. A. Representative confocal immunofluorescence images of fixed tissues stained whole-mount with activated caspase-3-specific antibodies (red) and Hoechst 33342 (cell nuclei, blue). B. Quantitation of caspase-3 activity normalized to its associated Hoechst staining. Data shows mean values from three independent experiments in which at least two replicates were used per experiment. Error bars are SEM and asterisk indicates statistical significance (P < 0.003).
To verify that the increased caspase-3 activities were associated with apoptosis, terminal deoxynucleotidyl transferase dUTP nick end-labeling (TUNEL) assays were carried out [26]. Figure 5a shows that live GBS infections were associated with elevated numbers of TUNEL positive cells. To determine if the observed TUNEL-positivity was caspase-dependent, infections were carried out in the presence of Z-VAD-FMK, a general caspase inhibitor, or DMSO (negative control). Figure 5a shows reductions in the numbers of TUNEL-positive cells in the presence of Z-VAD-FMK compared with the DMSO-treated cells during a live GBS infection. These observations were confirmed by quantitative digital image analysis (Figure 5b). Thus, these data suggest a caspase-dependent apoptosis is associated with GBS infections in fetal rat lung explants.
Figure 5. Increased DNA-fragmentation subsequent to live GBS infections.


Fetal rat lung explants were treated with either HK or live GBS for 66.5 hours as well as DMSO or the caspase-3 Z-VAD-FMK (50 μM, zVAD). Whole-mounted tissues were subjected to terminal deoxynucleotidyl transferase dUTP nick end-labeling (TUNEL) assays (red) and Hoechst 33342-staining (blue). A. Representative images from HK- and live-infected explants. B. Quantitation of TUNEL-positivity as a function of Hoechst staining. Data shows mean values from three independent experiments in which three replicates were used for each treatment of each experiment. Error bars are SEM and asterisk indicates statistical significance (P = 0.001).
Tissue-Specific Distribution of GBS and Activated Caspase-3
Since other studies have suggested that different fetal lung cell types undergo apoptosis variably, the distribution of apoptotic cells within the explants was investigated [34–37]. The distribution of activated caspase-3 within the explant tissue beds was characterized by whole-mount immunofluorescence confocal microscopy as described above. Figure 6a shows a representative image of the tissue distribution of activated caspase-3 within a fetal rat lung explant subsequent to GBS infection. Figure 6b shows the quantitative digital image analysis of this tissue distribution using the methods described in Figure S2. These data suggest that the active form of caspase-3 was localized primarily to the lung interstitium, indicating that the mesenchyme-derived cells of the lung interstitium have a greater propensity to undergo apoptosis than the epithelial cells in this model.
Figure 6. Distribution of GBS and activated caspase-3 within fetal rat lung explants.
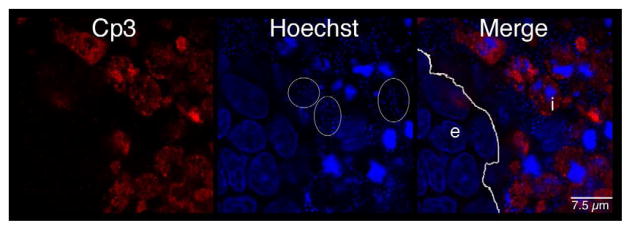

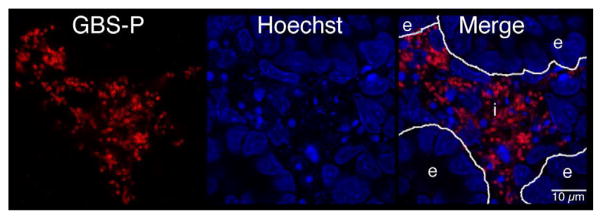

Fetal rat lung explants were infected with GBS as described above. A. Representative whole-mount confocal immunofluorescence image of active caspase-3 (red) in GBS-infected fetal rat lung explants. White line indicates the boundary between epithelium (e) and interstitium (i). B. Quantitative analysis of the distribution of the active form of caspase-3 (Cp3) between the epithelia and interstitium of fetal rat lung explants subsequent to live GBS infections. Data collected from representative images from four independent experiments (P < 0.0001). C. Representative confocal immunofluorescence image of GBS (red) detected with group B antigen-specific antibodies (GBS-P) in fetal rat lung explants. White lines demarcate tissue boundaries between epithelia (e) and interstitium (i). D. Quantitative analysis of the distribution of GBS between epithelia and the interstitium of fetal rat lung explants. Data collected from representative images of four independent experiments (P < 0.0001). Error bars are SEM. Hoechst is the nuclear counterstain (blue), which also detects GBS nucleoids (ovals).
Figure 6a also shows GBS nucleoids are localized primarily to the lung interstitium, suggesting that GBS infect the lung interstitium. To verify this observation, confocal immunofluorescence was carried out using a GBS-specific antibody probe (see Table I). Figure 6c shows GBS are indeed localized to the lung interstium and was verified using the quantitative image analysis methods described in Figure S2 (Figure 6d). Therefore, these data suggest that both apoptotic cells and GBS are distributed primarily within the lung interstitium in this model.
Colocalization of Activated Caspase-3 with Hematopoietic Cells in Fetal Rat Lung Explants
The above data indicate that both GBS and the active form of caspase-3 are found primarily in the fetal rat lung interstitium. To test this hypothesis, explants infected with either HK or live GBS were probed with antibodies to activated caspase-3 (Cp3) and BSI, a polyvalent lectin with a major affinity for terminal α-D-galactosyl and secondary affinity for terminal N-acetyl-α-D-galactosaminyl residues, that have been used to identify hematopoietic cells in fetal rat lung explants [38]. Figure 7a shows a representative image indicating colocalization between Cp3 and BSI. Digital image analyses were carried out to quantitate these colocalizations, using the methods described in Figure S3. Figure 7b shows the results of this quantitative analysis, which is the percentage of pixel overlap between the two stains. These data clearly indicate that percentage of pixel overlap differs significantly between the HK and live infections, providing strong evidence that hematopoietic cells undergo elevated levels of apoptosis subsequent to GBS infections.
Figure 7. Colocalization of the active form of caspase-3 (Cp3) with hematopoietic cells.
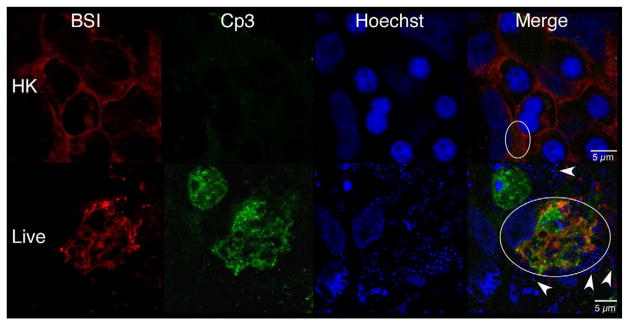

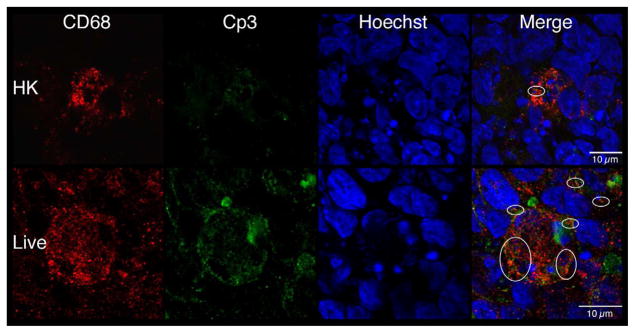

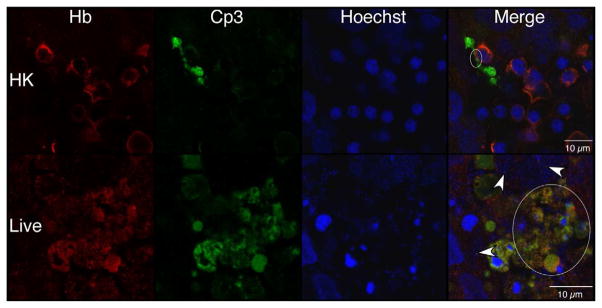

Confocal immunofluorescence of fetal rat lung explants infected with either live or heat-killed (HK) GBS for 66.5 hours. A. Representative images showing colocalization of hematopoietic marker BSI-isolectin (red) and activated caspase-3-specific (Cp3) antibodies (green) in both live and HK infected explants. B. Quantitation of BSI and Cp3 colocalization. The Percent Colocalziation is the fraction of colocalized signal from both probes (obtained by color subtraction) divided by the sum of the individual signals multiplied by 100 (see Methods and Figure S3). Data represents mean values pooled from four independent experiments with at least three replicates of each treatment per experiment. Asterisk indicates statistical significance (P = 0.003). Error bars show standard error of the mean (SEM). C. Representative whole-mount confocal images using both CD68- (macrophage, red) and Cp3- (green) antibodies. D. Quantitation of CD68 and Cp3 colocalization. Data represents mean values from three independent experiments with at least two replicate image sets of each treatment per experiment. Asterisk indicates statistical significance (P < 0.02). E. Representative whole-mount confocal images of hemoglobin (Hb) antibodies (red) and Cp3 (green). F. Quantitation of Cp3 and Hb colocalization. Data represents three independent experiments with at least three replicates of each treatment per experiment. Asterisk indicates statistical significance (P < 0.002). Ovals indicate regions of overlap and arrowheads show GBS nucleoids. Hoechst is the nuclear stain (blue).
Macrophage-specific CD68 and erythroblast-specific hemoglobin (Hb) antibodies were used to determine if these hematopoietic cells colocalized with Cp3 [39]. Figures 7c and 7e show robust colocalization of Cp3 with both CD68- and Hb-specific antibodies in the live but not HK-infected explants. Using the methods illustrated in Figure S3, quantitative colocalization analyses confirmed that Cp3 significantly colocalized with both of these hematopoietic markers (Figures 7d and 7f). Thus, these data suggest that GBS induce activated caspase-3 in fetal rat lung macrophages and erythroblasts, two erythroid/hematopoietic cell types within the fetal rat lung.
Discussion
Investigations into the mechanisms of GBS pathogenesis have largely focused on characterization of its virulence factors and subsequent testing using a variety of in vitro and in vivo models [7, 40]. The majority of these studies have not investigated the tissue and cellular morphological changes associated with GBS infections, temporal and spatial distribution of GBS within a target organ, or a multicellular analysis of host-cell death. To address these potential mechanisms of pathogenesis, an ex vivo model was used to facilitate observations of organ morphological changes, host-pathogen interactions, and temporal/spatial multicellular analysis of apoptosis [24].
To our knowledge, GBS associated tissue atrophy has not been reported. Consequently, the underlying mechanisms as well as the contributing GBS factors are currently undefined. Possible explanations for the explant atrophy include: cell migration out of the explants (extravasation), osmotic-associated cell volume changes, and/or losses in cell number due to necrosis and/or apoptosis. Although extravasation of inflammatory cells away from the main tissue mass occurs in the infected explants, it is also observed in the heat-killed infected explants albeit to a lesser extent (Figure 1). Thus, it is unlikely that inflammatory cell extravasation is the primary reason for the profound tissue atrophy associated with ex vivo GBS infections.
Metabolites produced primarily by GBS, and to a lesser extent fetal rat lung explants, may also contribute to the observed tissue atrophy. The observed pH declines and L-lactate increases in the spent media of the GBS- but not the E. coli-infected explants relate strongly with the observed morphological changes. It is not known whether the increase in protons and/or L-lactate can alter the osmolality of the media. However, both of these GBS-derived metabolites could potentially induce compensatory volume changes in the constituent cells of the tissue [41]. Finally, apoptosis (and likely necrosis) are dramatically elevated in the GBS-infected tissues and likely contribute to the observed tissue atrophy.
The observed decline in pH and increase in L-lactate may well be a consequence of the closed system used in these studies. However, changing the media daily did not prevent the pH decline or reduce lactate accumulation (data not shown). As long as the GBS were viable, they continued to proliferate and quickly overwhelmed the culture system, consuming most of the available glucose and producing most of the lactate. Although an important hallmark of sepsis is a decline in blood pH (acidosis) and a rise in blood lactate (> 4 mM), it cannot be determined from these studies whether GBS contribute to these clinical observations (metabolic acidosis and/or elevated lactate levels), but the data are consistent with this possibility [24, 42–44].
The reasons for high levels of interstitial cell apoptosis observed in the studies herein are unknown but might be linked to the mesenchymal origin of the interstitial cells. Several lines of evidence suggest that mesenchyme-derived cells have greater sensitivity to apoptosis than epithelial cells during fetal rat lung development. For example, mesenchyme-derived cells normally undergo apoptosis at the pseudoglandular stage (embryonic days 12 – 17); a time frame that corresponds with the studies herein [35–37, 45]. In addition, treatment of fetal rat lung explants with the MEK1/2 kinase inhibitor, U0126 or a teratogenic diphenyl ether, nitrofen induced high levels of mesenchymal but not epithelial apoptosis [26, 34]. Moreover, inhibition of insulin-like growth factor-I receptor (IGF-IR) signaling with neutralizing antibodies induced high levels of apoptosis in human fetal lung mesenchyme but not epithelium [46]. Therefore, mesenchyme-derived cells appear to be primed for elimination during normal lung fetal development such that slight perturbations and/or cytotoxic insults may trigger apoptosis.
The interstitial cell apoptosis appears to be caspase-dependent in the studies herein. However, other studies have shown conflicting data on GBS-induced caspase-dependent apoptosis [12, 47]. For example, GBS induces a caspase-independent apoptosis in thioglycollate-elicited mouse macrophages [9]. In contrast, a caspase-dependent apoptosis-was observed using the macrophage-like J774A.1 cells [12]. Since the former study used primary cells and the latter, a cell line, the differences in caspase-dependency between these two studies suggests a cell-type dependent sensitivity in caspase-3-mediated apoptosis. Nevertheless, since the majority of the cells in the study herein appear to be caspase-dependent, it is possible that caspase-inhibition can be used to reduce inflammation associated with GBS-associated sepsis and meningitis, as others have shown in experimental models of pneumococcal meningitis [21].
GBS associated macrophage apoptosis has been described in several other studies supporting our observations [9, 10, 12, 18, 47]. Although the mechanism(s) of GBS induced macrophage apoptosis are currently undefined in our studies, the β-H/C toxin or its associated pigment, an ornithine rhamno-polyene (granadaene) that confers hemolytic activity may play a role and will be investigated in future studies [9, 10, 48].
Observations of GBS-associated erythroblast apoptosis do not appear to have been reported, suggesting that the observations herein are novel. However, declines in hematocrit and hemoglobin associated with premature early onset neonatal sepsis have been reported [49]. Moreover, other human pathogens including parvovirus B19, which can cause intrauterine fetal death, have been linked with erythroblast apoptosis [50]. Interestingly, intrauterine fetal death has also been strongly associated with GBS infections [3, 51, 52]. These observations suggest that GBS-induced erythroblast apoptosis may play a role GBS-associated intrauterine fetal death.
The observations of enhanced GBS-mediated erythroblast apoptosis might be an indirect consequence of increased GBS-mediated macrophage apoptosis. Erythroblasts are immature red blood cells that are found in rings surrounding a central macrophage [53, 54]. During midgestational fetal development, they are localized predominantly in the liver but are also found in the developing lung [46, 55]. Erythroblasts normally undergo differentiation (erythropoiesis); a process that appears to be mediated by oxygen tension and erythropoietin (EPO) [53, 54]. This process is dependent upon the central macrophage within the erythroblast nest. Disruptions in erythropoiesis signaling pathways or macrophage function can increase erythroblast apoptosis [56, 57]. Therefore, the observed increases in erythroblast apoptosis might be indirect consequences of macrophage impairment. However, other possible causes of erythroblast apoptosis include increased macrophage migration out of the erythroblast nest (data not shown) or direct hemolytic attack by GBS [9, 10]. Future studies will clarify the mechanism of the observed GBS-associated erythroblast apoptosis.
Since macrophages and erythroblasts, two mesenchyme-derived hematopoietic cell types, underwent GBS-mediated apoptosis in our ex vivo model, it is possible that other hematopoietic cells including lymphocytes and granulocytes, as well as nonhematopoietic, mesenchyme-derived cells e.g. fibroblasts, myofibroblasts, and smooth muscle cells may also undergo apoptosis [10, 58]. However, our studies did not provide compelling evidence for this (data not shown).
These studies show for the first time that GBS induces profound morphological changes in fetal rat lung explants and induce a caspase-dependent interstitial cell apoptosis. Moreover, the interstitial cells that are most sensitive to GBS are of hematopoietic lineage. These observations lay a foundation for future studies on the unique susceptibility of these cells to GBS mediated cytotoxicity as well as on their unique propensity to undergo apoptosis in response to a variety of cytotoxic agents.
Supplementary Material
Representative phase contrast (Phase) images of explants at experiment initiation (T = 0 hr.) and termination (T = 66.5 hr.) were captured using an EOS 1000D camera (Canon U.S.A., Inc., Lake Success, NY) attached to an Axiovert 40CFL microscope using a 2.5X objective (Carl Zeiss MicroImaging, LLC, Thornwood, NY). Binary images where obtained by importation of the Phase JPEG images into Canvas v: X.0.2 (ACD Systems, Inc., Vancouver, BC, CA). A line was traced around the perimeter of the explant and filled in with the bucket tool. These images were transformed to binary using the Threshold tool and were quantitated using ImageJ v: 1.4.2q [28]. The percent change in explant areas were calculated by subtracting the explant areas at experiment termination (Areat) by the explant area at initiation (Areai), dividing by Areai, and multiplying by 100. These values are the percent changes in explant areas subsequent to GBS infections.
Although, similar methods were used for the tissue distribution analyses of both GBS and the active form of Cp3, a representative analysis of GBS tissue distribution is shown here. All image manipulations were carried out using Canvas software v/X.0.2 (ACD Systems). A. Representative confocal fluorescence image of GBS infecting fetal rat lung explant. GBS was detected using polyclonal antibodies to the group B polysaccharide antigen (green) and the cell nuclei were stained with Hoechst (blue). B. Epithelial cells and airway lumen was highlighted using a white line. Images were converted to grayscale and the threshold function was applied to eliminate background noise and create binary images. The paint bucket tool was used to fill the areas corresponding to the epithelial cells and the airway lumen. A copy of this image was digitally inverted to provide the interstitial tissue image. C. To obtain binary images of GBS, fluorescence images were digitally inverted, converted to grayscale (Inv/Gray), and thresholded (GBS/T). D. To obtain the regions of GBS overlap for each tissue type, each GBS binary image was overlaid on top of a tissue binary image (epithelial or interstitial) and areas of overlap were obtained using the Difference function of Canvas (Difference). The resulting images contained “holes” where GBS overlapped with the tissue of interest. These images were subsequently cleaned up to remove stray pixels that did not pertain the tissues in the specific analysis (Polished). For example, pixels associated with GBS in the interstitial spaces were removed for the analysis of GBS-epithelial cell overlap. Both the original tissue binary images (epithelial and interstitial) and associated polished images quantitated using ImageJ [28]. E. Sample calculation for the percent distribution of GBS in a tissue bed. Values corresponding to each polished image were subtracted from the values of its original tissue images (Epithelia or Interstitium) to obtain values corresponding to the areas of GBS within a tissue bed (GBS Overlap). The percent distributions of GBS between these two tissues were obtained by dividing values corresponding to GBS Overlap in a specific tissue e.g. epithelia by the sum of the GBS Overlap in both tissues, and multiplying by 100.
Regions of colocalization were isolated from the original two-color merged images by color subtraction using the hue, saturation and lightness (HSL) function of Canvas (v/X.0.2). Initially, merged images were digitally inverted (Invert) and both cyan and magenta were subtracted from the inverted images by adjusting the lightness in HSL to 100%, leaving only the blue overlap region (Subtract). Binary images of the overlap regions were obtained by conversion to grayscale and thresholding (Overlap). Binaries representing the total merged image were obtained using the same process but without the color subtraction step (Total). Threshold settings were the same for both the Overlap and Total binary images. Numerical values for binary images were obtained using ImageJ [28]. Overlap percentages were calculated by dividing the values corresponding to the Overlap by its respective Total binary image, and multiplying by 100.
Acknowledgments
Funds for these studies were provided in part for by National Institute of Allergy and Infectious Diseases (NIAID) U01AI075563 and National Institute of Child Health and Human Development (NICHD) P01HD013021 of the National Institutes of Health.
Footnotes
Publisher's Disclaimer: This is a PDF file of an unedited manuscript that has been accepted for publication. As a service to our customers we are providing this early version of the manuscript. The manuscript will undergo copyediting, typesetting, and review of the resulting proof before it is published in its final citable form. Please note that during the production process errors may be discovered which could affect the content, and all legal disclaimers that apply to the journal pertain.
Bibliography
- 1.Edwards MS, Nizet V. Group B Streptococcal Infections. In: Jack SR, Jerome OK, Christopher BW, Victor N, Yvonne AM, editors. Infectious Diseases of the Fetus and Newborn. 7. Philadelphia: W.B. Saunders: 2011. pp. 419–69. [Google Scholar]
- 2.Baker CJ, Edwards MS. Group B streptococcal conjugate vaccines. Arch Dis Child. 2003;88:375–8. doi: 10.1136/adc.88.5.375. [DOI] [PMC free article] [PubMed] [Google Scholar]
- 3.Desa DJ, Trevenen CL. Intrauterine infections with group B beta-haemolytic streptococci. Br J Obstet Gynaecol. 1984;91:237–9. doi: 10.1111/j.1471-0528.1984.tb04759.x. [DOI] [PubMed] [Google Scholar]
- 4.Verani JR, McGee L, Schrag SJ. Prevention of perinatal group B streptococcal disease--revised guidelines from CDC, 2010. MMWR Recomm Rep. 2010;59:1–36. [PubMed] [Google Scholar]
- 5.Heath PT. An update on vaccination against group B streptococcus. Expert review of vaccines. 2011;10:685–94. doi: 10.1586/erv.11.61. [DOI] [PubMed] [Google Scholar]
- 6.Lindahl G, Stalhammar-Carlemalm M, Areschoug T. Surface proteins of Streptococcus agalactiae and related proteins in other bacterial pathogens. Clin Microbiol Rev. 2005;18:102–27. doi: 10.1128/CMR.18.1.102-127.2005. [DOI] [PMC free article] [PubMed] [Google Scholar]
- 7.Doran KS, Nizet V. Molecular pathogenesis of neonatal group B streptococcal infection: no longer in its infancy. Mol Microbiol. 2004;54:23–31. doi: 10.1111/j.1365-2958.2004.04266.x. [DOI] [PubMed] [Google Scholar]
- 8.Ring A, Braun JS, Pohl J, Nizet V, Stremmel W, Shenep JL. Group B streptococcal beta-hemolysin induces mortality and liver injury in experimental sepsis. J Infect Dis. 2002;185:1745–53. doi: 10.1086/340818. [DOI] [PubMed] [Google Scholar]
- 9.Fettucciari K, Rosati E, Scaringi L, Cornacchione P, Migliorati G, Sabatini R, et al. Group B Streptococcus induces apoptosis in macrophages. J Immunol. 2000;165:3923–33. doi: 10.4049/jimmunol.165.7.3923. [DOI] [PubMed] [Google Scholar]
- 10.Liu GY, Doran KS, Lawrence T, Turkson N, Puliti M, Tissi L, et al. Sword and shield: linked group B streptococcal beta-hemolysin/cytolysin and carotenoid pigment function to subvert host phagocyte defense. Proc Natl Acad Sci U S A. 2004;101:14491–6. doi: 10.1073/pnas.0406143101. [DOI] [PMC free article] [PubMed] [Google Scholar]
- 11.Kaplan A, Chung K, Kocak H, Bertolotto C, Uh A, Hobel CJ, et al. Group B streptococcus induces trophoblast death. Microb Pathog. 2008;45:231–5. doi: 10.1016/j.micpath.2008.05.003. [DOI] [PMC free article] [PubMed] [Google Scholar]
- 12.Ulett GC, Maclean KH, Nekkalapu S, Cleveland JL, Adderson EE. Mechanisms of group B streptococcal-induced apoptosis of murine macrophages. Journal of immunology. 2005;175:2555–62. doi: 10.4049/jimmunol.175.4.2555. [DOI] [PubMed] [Google Scholar]
- 13.Oliveira L, Madureira P, Andrade EB, Bouaboud A, Morello E, Ferreira P, et al. Group B streptococcus GAPDH is released upon cell lysis, associates with bacterial surface, and induces apoptosis in murine macrophages. PLoS One. 2012;7:e29963. doi: 10.1371/journal.pone.0029963. [DOI] [PMC free article] [PubMed] [Google Scholar]
- 14.Hensler ME, Miyamoto S, Nizet V. Group B streptococcal beta-hemolysin/cytolysin directly impairs cardiomyocyte viability and function. PloS one. 2008;3:e2446. doi: 10.1371/journal.pone.0002446. [DOI] [PMC free article] [PubMed] [Google Scholar]
- 15.Lehnardt S, Wennekamp J, Freyer D, Liedtke C, Krueger C, Nitsch R, et al. TLR2 and caspase-8 are essential for group B Streptococcus-induced apoptosis in microglia. J Immunol. 2007;179:6134–43. doi: 10.4049/jimmunol.179.9.6134. [DOI] [PubMed] [Google Scholar]
- 16.Gibson RL, Nizet V, Rubens CE. Group B streptococcal beta-hemolysin promotes injury of lung microvascular endothelial cells. Pediatr Res. 1999;45:626–34. doi: 10.1203/00006450-199905010-00003. [DOI] [PubMed] [Google Scholar]
- 17.Nizet V, Gibson RL, Chi EY, Framson PE, Hulse M, Rubens CE. Group B streptococcal beta-hemolysin expression is associated with injury of lung epithelial cells. Infect Immun. 1996;64:3818–26. doi: 10.1128/iai.64.9.3818-3826.1996. [DOI] [PMC free article] [PubMed] [Google Scholar]
- 18.Ulett GC, Bohnsack JF, Armstrong J, Adderson EE. Beta-hemolysin-independent induction of apoptosis of macrophages infected with serotype III group B streptococcus. The Journal of infectious diseases. 2003;188:1049–53. doi: 10.1086/378202. [DOI] [PubMed] [Google Scholar]
- 19.Adams JM. Ways of dying: multiple pathways to apoptosis. Genes Dev. 2003;17:2481–95. doi: 10.1101/gad.1126903. [DOI] [PubMed] [Google Scholar]
- 20.Lorenzo HK, Susin SA, Penninger J, Kroemer G. Apoptosis inducing factor (AIF): a phylogenetically old, caspase-independent effector of cell death. Cell Death Differ. 1999;6:516–24. doi: 10.1038/sj.cdd.4400527. [DOI] [PubMed] [Google Scholar]
- 21.Braun JS, Tuomanen EI. Molecular mechanisms of brain damage in bacterial meningitis. Advances in pediatric infectious diseases. 1999;14:49–71. [PubMed] [Google Scholar]
- 22.Larsen JW, Jr, London WT, Palmer AE, Tossell JW, Bronsteen RA, Daniels M, et al. Experimental group B streptococcal infection in the rhesus monkey. I. Disease production in the neonate. Am J Obstet Gynecol. 1978;132:686–90. doi: 10.1016/0002-9378(78)90865-7. [DOI] [PubMed] [Google Scholar]
- 23.Rubens CE, Raff HV, Jackson JC, Chi EY, Bielitzki JT, Hillier SL. Pathophysiology and histopathology of group B streptococcal sepsis in Macaca nemestrina primates induced after intraamniotic inoculation: evidence for bacterial cellular invasion. J Infect Dis. 1991;164:320–30. doi: 10.1093/infdis/164.2.320. [DOI] [PubMed] [Google Scholar]
- 24.Kling DE, Cavicchio AJ, Sollinger CA, Madoff LC, Schnitzer JJ, Kinane TB. Lactic acid is a potential virulence factor for group B Streptococcus. Microb Pathog. 2009;46:43–52. doi: 10.1016/j.micpath.2008.10.009. [DOI] [PubMed] [Google Scholar]
- 25.Rubens CE, Heggen LM, Haft RF, Wessels MR. Identification of cpsD, a gene essential for type III capsule expression in group B streptococci. Mol Microbiol. 1993;8:843–55. doi: 10.1111/j.1365-2958.1993.tb01631.x. [DOI] [PubMed] [Google Scholar]
- 26.Kling DE, Lorenzo HK, Trbovich AM, Kinane TB, Donahoe PK, Schnitzer JJ. MEK-1/2 inhibition reduces branching morphogenesis and causes mesenchymal cell apoptosis in fetal rat lungs. Am J Physiol Lung Cell Mol Physiol. 2002;282:L370–L8. doi: 10.1152/ajplung.00200.2001. [DOI] [PubMed] [Google Scholar]
- 27.Motulsky HJ. Prism 4 Statistics Guide -Statistical analyses for laboratory and clinical researchers. GraphPad Software, Inc; San Diego CA: 2003. [Google Scholar]
- 28.Rasband WS. ImageJ. U. S. National Institutes of Health; Bethesda, Maryland, USA: 1997–2011. [Google Scholar]
- 29.Quach D, van Sorge NM, Kristian SA, Bryan JD, Shelver DW, Doran KS. The CiaR response regulator in group B Streptococcus promotes intracellular survival and resistance to innate immune defenses. J Bacteriol. 2009;191:2023–32. doi: 10.1128/JB.01216-08. [DOI] [PMC free article] [PubMed] [Google Scholar]
- 30.Henneke P, Dramsi S, Mancuso G, Chraibi K, Pellegrini E, Theilacker C, et al. Lipoproteins are critical TLR2 activating toxins in group B streptococcal sepsis. Journal of immunology. 2008;180:6149–58. doi: 10.4049/jimmunol.180.9.6149. [DOI] [PubMed] [Google Scholar]
- 31.Jones AL, Knoll KM, Rubens CE. Identification of Streptococcus agalactiae virulence genes in the neonatal rat sepsis model using signature-tagged mutagenesis. Mol Microbiol. 2000;37:1444–55. doi: 10.1046/j.1365-2958.2000.02099.x. [DOI] [PubMed] [Google Scholar]
- 32.Fisher JC, Kling DE, Kinane TB, Schnitzer JJ. Oxidation-reduction (redox) controls fetal hypoplastic lung growth. J Surg Res. 2002;106:287–91. doi: 10.1006/jsre.2002.6461. [DOI] [PubMed] [Google Scholar]
- 33.Islam S, Narra V, Cote GM, Manganaro TF, Donahoe PK, Schnitzer JJ. Prenatal vitamin E treatment improves lung growth in fetal rats with congenital diaphragmatic hernia. J Pediatr Surg. 1999;34:172–6. doi: 10.1016/s0022-3468(99)90251-8. discussion 6–7. [DOI] [PubMed] [Google Scholar]
- 34.Kling DE, Cavicchio AJ, Sollinger CA, Schnitzer JJ, Kinane TB, Newburg DS. Nitrofen induces apoptosis independently of retinaldehyde dehydrogenase (RALDH) inhibition. Birth Defects Research Part B: Developmental and Reproductive Toxicology. 2010;89:223–32. doi: 10.1002/bdrb.20247. [DOI] [PubMed] [Google Scholar]
- 35.Wongtrakool C, Roman J. Apoptosis of mesenchymal cells during the pseudoglandular stage of lung development affects branching morphogenesis. Experimental lung research. 2008;34:481–99. doi: 10.1080/01902140802271842. [DOI] [PMC free article] [PubMed] [Google Scholar]
- 36.Stiles AD, Chrysis D, Jarvis HW, Brighton B, Moats-Staats BM. Programmed cell death in normal fetal rat lung development. Experimental lung research. 2001;27:569–87. doi: 10.1080/019021401753181836. [DOI] [PubMed] [Google Scholar]
- 37.Kresch MJ, Christian C, Wu F, Hussain N. Ontogeny of apoptosis during lung development. Pediatr Res. 1998;43:426–31. doi: 10.1203/00006450-199803000-00020. [DOI] [PubMed] [Google Scholar]
- 38.Sorokin SP, McNelly NA, Blunt DG, Hoyt RF., Jr Macrophage development: III. Transformation of pulmonary macrophages from precursors in fetal lungs and their later maturation in organ culture. The Anatomical record. 1992;232:551–71. doi: 10.1002/ar.1092320411. [DOI] [PubMed] [Google Scholar]
- 39.Holness CL, Simmons DL. Molecular cloning of CD68, a human macrophage marker related to lysosomal glycoproteins. Blood. 1993;81:1607–13. [PubMed] [Google Scholar]
- 40.Rajagopal L. Understanding the regulation of Group B Streptococcal virulence factors. Future microbiology. 2009;4:201–21. doi: 10.2217/17460913.4.2.201. [DOI] [PMC free article] [PubMed] [Google Scholar]
- 41.Lang F. Mechanisms and significance of cell volume regulation. Journal of the American College of Nutrition. 2007;26:613S–23S. doi: 10.1080/07315724.2007.10719667. [DOI] [PubMed] [Google Scholar]
- 42.Fall PJ, Szerlip HM. Lactic acidosis: from sour milk to septic shock. Journal of intensive care medicine. 2005;20:255–71. doi: 10.1177/0885066605278644. [DOI] [PubMed] [Google Scholar]
- 43.Lynn NJ, Pauly TH, Desai NS. Purpura fulminans in three cases of early-onset neonatal group B streptococcal meningitis. J Perinatol. 1991;11:144–6. [PubMed] [Google Scholar]
- 44.Hon KL, So KW, Wong W, Cheung KL. Spot diagnosis: An ominous rash in a newborn. Italian journal of pediatrics. 2009;35:10. doi: 10.1186/1824-7288-35-10. [DOI] [PMC free article] [PubMed] [Google Scholar]
- 45.Hilfer SR. Morphogenesis of the lung: control of embryonic and fetal branching. Annu Rev Physiol. 1996;58:93–113. doi: 10.1146/annurev.ph.58.030196.000521. [DOI] [PubMed] [Google Scholar]
- 46.Han RN, Post M, Tanswell AK, Lye SJ. Insulin-like growth factor-I receptor-mediated vasculogenesis/angiogenesis in human lung development. Am J Respir Cell Mol Biol. 2003;28:159–69. doi: 10.1165/rcmb.4764. [DOI] [PubMed] [Google Scholar]
- 47.Fettucciari K, Fetriconi I, Mannucci R, Nicoletti I, Bartoli A, Coaccioli S, et al. Group B Streptococcus induces macrophage apoptosis by calpain activation. J Immunol. 2006;176:7542–56. doi: 10.4049/jimmunol.176.12.7542. [DOI] [PubMed] [Google Scholar]
- 48.Paradas M, Jurado R, Haidour A, Rodriguez Granger J, Sampedro Martinez A, de la Rosa Fraile M, et al. Clarifying the structure of granadaene: Total synthesis of related analogue [2]-granadaene and confirmation of its absolute stereochemistry. Bioorganic & medicinal chemistry. 2012;20:6655–61. doi: 10.1016/j.bmc.2012.09.017. [DOI] [PubMed] [Google Scholar]
- 49.Dulay AT, Buhimschi IA, Zhao G, Luo G, Abdel-Razeq S, Cackovic M, et al. Nucleated red blood cells are a direct response to mediators of inflammation in newborns with early-onset neonatal sepsis. Am J Obstet Gynecol. 2008;198:426, e1–9. doi: 10.1016/j.ajog.2008.01.040. [DOI] [PMC free article] [PubMed] [Google Scholar]
- 50.Morita E, Sugamura K. Human parvovirus B19-induced cell cycle arrest and apoptosis. Springer Seminars in Immunopathology. 2002;24:187–99. doi: 10.1007/s00281-002-0099-6. [DOI] [PubMed] [Google Scholar]
- 51.Gibbs RS, Roberts DJ. Case records of the Massachusetts General Hospital. Case 27-2007. A 30-year-old pregnant woman with intrauterine fetal death. N Engl J Med. 2007;357:918–25. doi: 10.1056/NEJMcpc079021. [DOI] [PubMed] [Google Scholar]
- 52.Bergqvist G, Holmberg G, Rydner T, Vaclavinkova V. Intrauterine death due to infection with group B Streptococci. Acta obstetricia et gynecologica Scandinavica. 1978;57:127–8. doi: 10.3109/00016347809155890. [DOI] [PubMed] [Google Scholar]
- 53.Manwani D, Bieker JJ. The erythroblastic island. Current topics in developmental biology. 2008;82:23–53. doi: 10.1016/S0070-2153(07)00002-6. [DOI] [PMC free article] [PubMed] [Google Scholar]
- 54.McGrath K, Palis J. Ontogeny of erythropoiesis in the mammalian embryo. Curr Top Dev Biol. 2008;82:1–22. doi: 10.1016/S0070-2153(07)00001-4. [DOI] [PubMed] [Google Scholar]
- 55.Parera MC, van Dooren M, van Kempen M, de Krijger R, Grosveld F, Tibboel D, et al. Distal angiogenesis: a new concept for lung vascular morphogenesis. Am J Physiol Lung Cell Mol Physiol. 2005;288:L141–9. doi: 10.1152/ajplung.00148.2004. [DOI] [PubMed] [Google Scholar]
- 56.Diwan A, Koesters AG, Odley AM, Pushkaran S, Baines CP, Spike BT, et al. Unrestrained erythroblast development in Nix−/− mice reveals a mechanism for apoptotic modulation of erythropoiesis. Proc Natl Acad Sci U S A. 2007;104:6794–9. doi: 10.1073/pnas.0610666104. [DOI] [PMC free article] [PubMed] [Google Scholar]
- 57.Wu H, Liu X, Jaenisch R, Lodish HF. Generation of committed erythroid BFU-E and CFU-E progenitors does not require erythropoietin or the erythropoietin receptor. Cell. 1995;83:59–67. doi: 10.1016/0092-8674(95)90234-1. [DOI] [PubMed] [Google Scholar]
- 58.Schreiber T, Swanson PE, Chang KC, Davis CC, Dunne WM, Karl IE, et al. Both gram-negative and gram-positive experimental pneumonia induce profound lymphocyte but not respiratory epithelial cell apoptosis. Shock. 2006;26:271–6. doi: 10.1097/01.shk0000225856.32260.0d. [DOI] [PubMed] [Google Scholar]
Associated Data
This section collects any data citations, data availability statements, or supplementary materials included in this article.
Supplementary Materials
Representative phase contrast (Phase) images of explants at experiment initiation (T = 0 hr.) and termination (T = 66.5 hr.) were captured using an EOS 1000D camera (Canon U.S.A., Inc., Lake Success, NY) attached to an Axiovert 40CFL microscope using a 2.5X objective (Carl Zeiss MicroImaging, LLC, Thornwood, NY). Binary images where obtained by importation of the Phase JPEG images into Canvas v: X.0.2 (ACD Systems, Inc., Vancouver, BC, CA). A line was traced around the perimeter of the explant and filled in with the bucket tool. These images were transformed to binary using the Threshold tool and were quantitated using ImageJ v: 1.4.2q [28]. The percent change in explant areas were calculated by subtracting the explant areas at experiment termination (Areat) by the explant area at initiation (Areai), dividing by Areai, and multiplying by 100. These values are the percent changes in explant areas subsequent to GBS infections.
Although, similar methods were used for the tissue distribution analyses of both GBS and the active form of Cp3, a representative analysis of GBS tissue distribution is shown here. All image manipulations were carried out using Canvas software v/X.0.2 (ACD Systems). A. Representative confocal fluorescence image of GBS infecting fetal rat lung explant. GBS was detected using polyclonal antibodies to the group B polysaccharide antigen (green) and the cell nuclei were stained with Hoechst (blue). B. Epithelial cells and airway lumen was highlighted using a white line. Images were converted to grayscale and the threshold function was applied to eliminate background noise and create binary images. The paint bucket tool was used to fill the areas corresponding to the epithelial cells and the airway lumen. A copy of this image was digitally inverted to provide the interstitial tissue image. C. To obtain binary images of GBS, fluorescence images were digitally inverted, converted to grayscale (Inv/Gray), and thresholded (GBS/T). D. To obtain the regions of GBS overlap for each tissue type, each GBS binary image was overlaid on top of a tissue binary image (epithelial or interstitial) and areas of overlap were obtained using the Difference function of Canvas (Difference). The resulting images contained “holes” where GBS overlapped with the tissue of interest. These images were subsequently cleaned up to remove stray pixels that did not pertain the tissues in the specific analysis (Polished). For example, pixels associated with GBS in the interstitial spaces were removed for the analysis of GBS-epithelial cell overlap. Both the original tissue binary images (epithelial and interstitial) and associated polished images quantitated using ImageJ [28]. E. Sample calculation for the percent distribution of GBS in a tissue bed. Values corresponding to each polished image were subtracted from the values of its original tissue images (Epithelia or Interstitium) to obtain values corresponding to the areas of GBS within a tissue bed (GBS Overlap). The percent distributions of GBS between these two tissues were obtained by dividing values corresponding to GBS Overlap in a specific tissue e.g. epithelia by the sum of the GBS Overlap in both tissues, and multiplying by 100.
Regions of colocalization were isolated from the original two-color merged images by color subtraction using the hue, saturation and lightness (HSL) function of Canvas (v/X.0.2). Initially, merged images were digitally inverted (Invert) and both cyan and magenta were subtracted from the inverted images by adjusting the lightness in HSL to 100%, leaving only the blue overlap region (Subtract). Binary images of the overlap regions were obtained by conversion to grayscale and thresholding (Overlap). Binaries representing the total merged image were obtained using the same process but without the color subtraction step (Total). Threshold settings were the same for both the Overlap and Total binary images. Numerical values for binary images were obtained using ImageJ [28]. Overlap percentages were calculated by dividing the values corresponding to the Overlap by its respective Total binary image, and multiplying by 100.