

Abstract
Purpose
To design an algorithm for optimizing pulsed high intensity focused ultrasound (p-HIFU) treatment parameters to maximize tissue transport while minimizing thermal necrosis based on MR image guidance.
Materials and Methods
P-HIFU power, duty cycle and treatment duration were varied to generate different levels of thermal and mechanical deposition in rabbit muscle. Changes in T2-weighted and T1 contrast-enhanced (CE) signal were assessed immediately following treatment and at 24 hrs. Transport parameters were extracted via T1-weighted dynamic contrast-enhanced MRI (DCE-MRI) technique at 0 and 24 hr time points.
Results
Successful p-HIFU treatment was indicated by focal hyperintensity on the T2-weighted image immediately post-treatment, suggesting increased fluid (edema), with little intensity change in CE image. After 24h, the affected region expanded along the muscle fiber accompanied by clear hyperintensity in CE image (contrast uptake). Quantitative DCE-MRI analysis revealed statistically significant increases in both leakage rate and extracellular space, accompanied by a decrease in clearance rate.
Conclusion
Successful p-HIFU treatment was mainly correlated to tissue heating. Tissue transport properties following treatment success would result in improved contact between drug and targets in both time and space. MRI is the key to controlling treatment via thermometry and also monitoring efficacy via T2-weighted imaging.
Keywords: pulsed high-intensity focused ultrasound, MRI-guided focused ultrasound, drug delivery, dynamic contrast enhanced-MRI, tissue permeability, clearance rate
INTRODUCTION
Pulsed high-intensity focused ultrasound (p-HIFU) is known as a non-invasive therapeutic modality that can localize high amounts of energy at a treatment site without affecting the surrounding tissue. Compared to traditional ablative HIFU used for tumor treatment, p-HIFU, which generates non-continuous energy deposition, delivers ultrasound to target tissue with reduced temporal average intensity, thus avoiding excessive thermal dose accumulation. Although the detailed response of tissue to p-HIFU exposures is still not completely understood, preliminary evidence has already demonstrated the ability of p-HIFU to enhance local drug and nanoparticle delivery in exposed tissue. For instance, p-HIFU exposures in tumor sites, followed by either local or systemic administrations, was shown to improve the delivery of a high-molecular weight fluorophore (1), plasmid DNA (2), fluorescently labeled polystyrene nanoparticles (3), and monoclonal antibodies (4) in a non-destructive manner. Additional studies demonstrated that the p-HIFU exposures could facilitate the delivery of tissue plasminogen activator (tPA) to blood clots and, consequently, increase their rate of thrombolysis in vitro (5) and in vivo (6) when compared to treatments with tPA alone. Combined with preformed microbubble ultrasound contrast agents, HIFU exposures in brain has been used to locally disrupt the intact blood-brain barrier (BBB) to allow penetration of IgG tracer (7). In generally, the p-HIFU technique has shown promise as a way of non-destructively enhancing local uptake of drugs, both out of the vasculature and into the tissue.
Although the therapeutic benefits of p-HIFU for drug delivery enhancement has been well-established in mouse models, a full understanding of this effect is elusive. Changes in tissue transport properties were noted in both mouse tumors (8) and mouse muscle (9). Work in mouse models seemed to demonstrate effects that were not correlated to the thermal dose (9). Nevertheless, much care needs to be exercised in extrapolating this experience to bulk tissue in large animals and humans.
This study was conceived as a necessary step in the translation of p-HIFU drug delivery from mouse to clinical models, with three goals: first, to test the p-HIFU effect in an animal model better approximating bulk tissue, second, to better understand the mechanisms behind p-HIFU drug delivery, and third, use this understanding to optimize the effect for clinical translation. Specifically, we developed an algorithm for optimizing p-HIFU treatment parameters and minimizing thermal necrosis using MRI guidance. Our conclusions are based on quantitative analysis of dynamic contrast-enhanced MRI (DCEMRI) (10,11), from which overall changes in tissue transport may be implied.
MATERIALS AND METHODS
Animal Experiments
Twenty-five female New Zealand white rabbits between 3 and 4 kg in weight were used in the study. All animals were handled according to a protocol approved by the Institutional Animal Care and Use Committee. Core temperatures were continuously monitored using a rectal thermometer. For several animals, a second fiber-optic thermal probe (FISO, Quebec, QC) was placed in the thigh during treatment. These measurements were used to correct the baseline temperature used in obtaining MRI thermal maps.
During treatment, each rabbit’s leg and thigh were coupled to the ExAblate transducer (Insightec Inc., Haifa, Israel) by resting in degassed water on a gel pad. A breast coil around the gel pad was used to acquire all MRI images, including T2-weighted images before and after treatment, thermal maps during treatment, and T1-weighted DCEMRI after treatment. Imaging was repeated at 24 hrs. The rabbit was allowed to recover for 3–4 weeks before treatment of the other leg. Following the second treatment, rabbits were humanely euthanized.
The Effect of Treatment Parameters
The “standard” treatment paradigm of 40W peak total acoustic power (P), 5% duty cycle (DC), and 100 pulses per sonication (9) (average power Pav=2 W, total energy Etot=200 J) was tested extensively, as were variations involving increasing pulse numbers up to 600, increasing P up to 277 W holding Pav constant, and increasing the Pav up to 20 W. Correlations between treatment outcome at 0 and 24 hrs and acoustic parameters were investigated. The thermally affected region of tissue was estimated from the temperature maps at maximum peak temperature by measuring the area that exceeded a temperature of 43.25 °C, using ImageJ software (version 1.46, NIH, Bethesda, MD).
Temperature Maps and Peak Temperature
Temperature maps were reconstructed by the p-HIFU system using the PRF method (12) and based on the assumption of a core temperature of 37 °C. Corrections were made offline to adjust for the actual core temperature and the average decrease in peripheral temperature from core temperature (2.75 ± 1 °C) as measured during several sessions. For data limited to 50–120 s treatment range, results were analyzed using “average peak temperature” (Tmx), the peak temperature over time averaged over 9 neighboring voxels, as the basis for statistical analysis. The thermal dose standard CEM43 (13) was used in considering treatments outside this range. For the thermal dose, the following standard definition was applied:
| [1] |
where CEM43 (or just CEM) is the “thermal iso-effective dose” in “cumulative equivalent minutes” at 43°C, and T(t) is temperature at time t. This equation was applied following the temperature over time of each voxel to find the thermal dose field in the treated region (Figure 1).
Figure 1.

Temperature history of one focal spot during p-HIFU treatment (a) and corresponding thermal dose map (b).
Fast Spin Echo T2-weighted MRI
Edema was detected by comparing T2-weighted images from before and after treatment. The size of this effect was estimated by measuring the area in the vicinity of the treatment spot with intensity at least 1.5 times greater than the surrounding tissue. This level was selected to be above the noise level (20–30%) in the surrounding muscle, but well below the peak signal (~200%) in most treatment zones. A central slice through the region was used. The existence and extent of the edema was correlated to acoustic and thermal parameters and compared at 0 and 24 hrs post treatment. Where necessary, the position of the femur and tibia were used to locate treatment points in subsequent imaging sessions where the animal had been moved.
T1-weighted Contrast Enhanced (CE) Images
Gadolinium contrast (Magnevist, Bayer HealthCare Pharmaceuticals Inc., Wayne, NJ) T1-weighted CE images were extracted from the DCEMRI series 10 minutes after bolus injection. These were used for an initial analysis of regions of improved uptake. An “enhanced uptake” area was determined using a threshold 1.5 times greater than the surrounding tissue, using selection criteria similar to the T2 above. Many of these images also had low-intensity “reduced uptake” or “burn” regions at the center of the enhanced region. The size of the burn was measured using a threshold set to 0.8 times the median of the surrounding hyperintense region, based again on typical noise levels. This criterion is not so strict, as values in the hyperintense region are more variable from one treatment to the next. The existence and extent of CE and burn regions in these images was compared to edema in the T2 images, correlated to acoustic and thermal parameters, and compared at 0 and 24 hrs post treatment. After first extracting the initial T1 relaxation maps (14–16), the full DCEMRI curves were also fit to the Kety model (17,18) using Nelder-Mead simplex curve fitting (19). Complete maps of model parameters were produced, from which were extracted the mean model parameters corresponding to previously-identified normal tissue, CE, and burn regions.
Histology
Following sacrifice, both legs were removed hip to the ankle and fixed in formalin over several weeks. Regions of high permeability were identified by injection of 10 mg/kg Evan’s Blue dye (Fisher Scientific, Waltham, MA) prior to euthanasia. These areas were dissected and submitted to the Pathology Department for sectioning, paraffin embedding and whole-mount histology with H&E staining.
Statistical analysis
Recursive partitioning (RPART) (20,21) in R (version 2.14, R Foundation for Statistical Computing, Vienna, Austria) was initially used to establish the relative impacts of acoustic and thermal parameters on contrast enhancement. This well-known statistical method optimally splits data according to a given set of variables upon which the data is presumed to depend. This is done recursively starting with the single variable that “maximally splits” the data into two groups, then repeating on each subgroup until some termination criteria is reached. The termination criteria might be a minimum group size or failure to find further improvement with additional splits. The definition of a “maximal split” depends on the type of data, and RPART is designed to handle both discrete and continuous variables (21). The ultrasound control parameters for pulsed HIFU in our case include peak power, pulse period (repetition rate) and duty cycle, and total number of pulses. These may be described physically as peak power, average power (peak power times duty cycle) and total energy (peak power times duty cycle times period times number of pulses). In general, for practical reasons, the pulse period remained at 1.0 s. We explored the importance of each of these parameters in inducing edema, which, as mentioned above, eventually leads to enhanced contrast. Recursive partitioning was applied to a statistical model where the T2 enhancement at 0 hrs (‘edema’) was presumed driven by combinations of peak power, average power, and total energy (T2_enh~Power+PAve+ETot).
Since we measure temperature during treatment, it is possible to compare the predictive power of the acoustic parameters to those of the thermal parameters. The maximum in thermal dose, CEM43, was used in a recursive partitioning along with the peak temperature, Tmx (T2_enh~Tmx+CEM43). RPART breakpoints were used for optimal binning and further analysis of affected areas.
For the DCEMRI, student’s t-test was used to compare changes in the Kety model parameters in CE and burn regions to normal muscle. A significance level of P ≤ 0.05 was applied.
RESULTS
Observations on Tissue Response: Correlations between edema at 0 hr and contrast enhancement (CE)
Figure 1 shows a typical peak temperature curve and the corresponding thermal dose during treatment. Figure 2 shows the T2-weighted MRI for the thigh muscle of one rabbit. Hyperintense regions (‘edema’) associated with spots 1, 3, and 4, were observed immediately following treatment, in contrast to spot 2. This almost instantaneous edema almost inevitably leads to some form of contrast enhancement (CE) at later time points. Of 174 observations at the 24-hr time point, spots with initial edema resulted in CE in almost 92% of the cases (57/62). Of the five spots that did not enhance following edema, four had obvious large burns. Spots without initial edema had a less than 1% chance of showing CE (1/112). Hyper-intensity in the contrast images correlating to initial edema was also noted at 12, 36 and 48 hr time points, although fewer observations were made. At 0 hr, however, edema was more likely associated with decreased contrast rather than CE (77% vs. 28 %). Note that in general both increased and decreased contrast may be associated with the same treatment, for example, an enhancing rim surrounding a non-enhancing core (burn).
Figure 2.
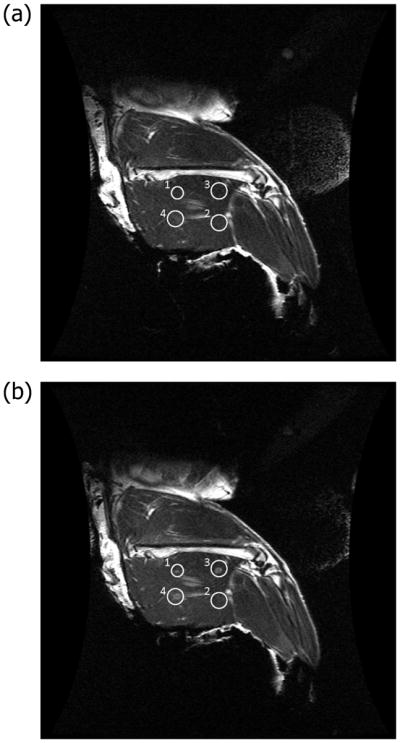
Coronal T2-weighted MRI without contrast in the thigh muscle of a 3.4 kg female New Zealand rabbit. (a) Regions of interest (circles) are hypointense before p-HIFU treatment. (b) The four treatment spots (circles) are hyperintense after p-HIFU treatment.
While the 0 hr edema size and shape correlates well to the heat affected area, the CE region extends well beyond the boundaries of both the thermal treatment and the edema, particularly in the direction of the muscle fiber (Figure 3). This is best demonstrated by the fact that the ratio major axis/minor axis of the ellipse fit to the CE region is 3.0±1.4, 1.67 times greater than the same ratio 1.8±0.5 measured for the edema at 0 hr. Histology shows that this is related to the spread of inflammation originating at the treated spot (Figure 4).
Figure 3.

Relative sizes and shapes of treated zones. (Left) heated zone (defined as the region reaching at least 43.25 °C); (Middle) T2-enhanced zone; (Right) contrast-enhanced zone and contrast-reduced (burn) zones at 24 hours. Shown are 25th and 75th percentiles of all measurements normalized by the minor axis of the edema at 0 hour. For the burn, the area of the 25th percentile is 0. The significant elongation (major axis) along the muscle fiber in the case of the contrast enhanced region suggests an effect mediated by the diffusion of inflammatory factors. Insets are thermal, T2, and CE images of spot 3 in Figure 2. Each image is 18 mm × 14 mm.
Figure 4.

Histology from treated region of muscle at 0 hrs (a) and 24 hrs (b). The edema at 0 hrs is reflected in the loss of tissue structure, leading to acute inflammatory response at 24 hrs.
Tissue Response Dependence on Ultrasound Parameters
Binary tissue response (True/False) in terms of edema and contrast uptake at 0 and 24 hrs was analyzed and yielded the resulting tree shown in Figure 5. Neither the ‘standard’ nor the high peak, low average power nor the high total energy treatments resulted in any consistent enhanced contrast uptake (1/23 treatments at 40W peak power, 5% ≤ duty cycle ≤ 10%, and pulses up to 600/site; 1/27 treatments at 40W ≤ peak power ≤ 280W, average power ≤ 5W). Conversely, high average powers (≥10.25W) consistently resulted in enhanced contrast uptake. This result demonstrates the overwhelming importance of the average power relative to the other two as a predictor of effect. Since average power is most closely associated to the peak temperature, this suggests the predominance of temperature effects over mechanical effects or cumulative damage.
Figure 5.

Prediction of edema following treatment. Partition tree (without pruning) for prediction of presence (TRUE) or absence (FALSE) of edema following p-HIFU treatment, based on peak acoustic power (Power), average power (Pave) and total energy (ETot) in the beam. Pave is clearly the most important parameter, dominating the first two levels of the tree. For example, a Pave of 10.25W breaks the entire set of observations (123 FALSE or edema not present, 54 TRUE or edema present) into predominantly edema not present group below 10.25W (97 FALSE vs. 10 TRUE) and a predominantly edema present group above 10.25W (26 FALSE vs. 44 TRUE). Power, which shows up at the third level of this tree, is not well correlated to the presence of edema.
Tissue Response Dependence on Temperature
Our results showed that while an acoustic parameter such as Pave is a good predictor of edema, the thermal dose CEM43 or peak temperature Tmx offers an improved predictive power. RPART analysis of the results based on CEM43 leads to a correct prediction in 19 additional cases out of 177 over the same analysis based on Pav (160 correct for CEM43 vs. 141 correct using Pav). Figure 6 shows how the induced edema is related to CEM43.
Figure 6.

Relationship between induced edema and thermal dose. A CEM43 of 159 minutes separates treatments into groups without (FALSE) and with (TRUE) edema (P < 10−15). Shown are medians, 25–75 percentiles (boxes) and 5–95 percentiles (whiskers).
For treatment times limited to 50–120 s, Tmx and CEM43 give the same predictions. RPART analysis using Tmx results in major breakpoints at 42.41 °C, below which no response is observed, and 52.51 °C, above which 92% of spots have burns (Figure 7). 49.36 °C is found to partition treatments into those with lower probability of contrast uptake as well as low probability of a burn and those with optimal chance of contrast uptake but with potential for some loss due to burn. Figure 8 shows CE and burn area dependence on Tmx with binning based on the above breakpoints.
Figure 7.
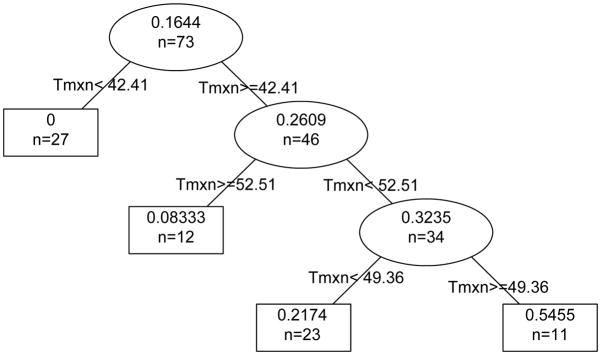
Prediction of successful treatment. The partition tree shows the probability of success (contrast uptake and no burn) for p-HIFU treatments of 50–120 s that reach peak temperature, Tmx, in the ranges indicated. Tmx=42.41 °C divides the set of observations into 27 treatments of which 0 were successful and 46 treatments of which 26.09% (or 12) were successful and so on down the tree. The final groups arranged by peak temperature are Tmx<42.41 °C where 0 of the 27 treatments were successful, 42.41 °C ≤ Tmx<49.36 °C where 5 of 23 treatments (21.74%) were successful, 49.36 °C ≤ Tmx<52.51 °C where 6 of 11 treatments (54.55%) were successful, and 52.51 °C ≤ Tmx where 1 of 12 treatments (8.33%) was successful.
Figure 8.

Contrast uptake after treatment. Areas of regions showing enhanced (filled, x) and reduced (wavy, o) contrast uptake at 24 hours after p-HIFU treatment dependence on max temperature (treatment time: 50–120 s). Box width is proportional to sample number.
Tissue Property Parameters Map
Tissue parameters from fitting the Kety model at 0 hr and 24 hrs after treatment are shown in Figures 8 and 9 respectively. Blood plasma fractional volume (vp) distribution is very sparse and overwhelmed by background noise or unchanged at both time points (data not shown). 24 hrs after a “successful” treatment, the permeability ktrans and fractional extracellular volume ve maps indicate that the leakage rate and extracellular space increase in the CE region and decrease in the burn region. The tissue clearance rate kep map shows a slight decrease in both regions (Figure 9).
Figure 9.
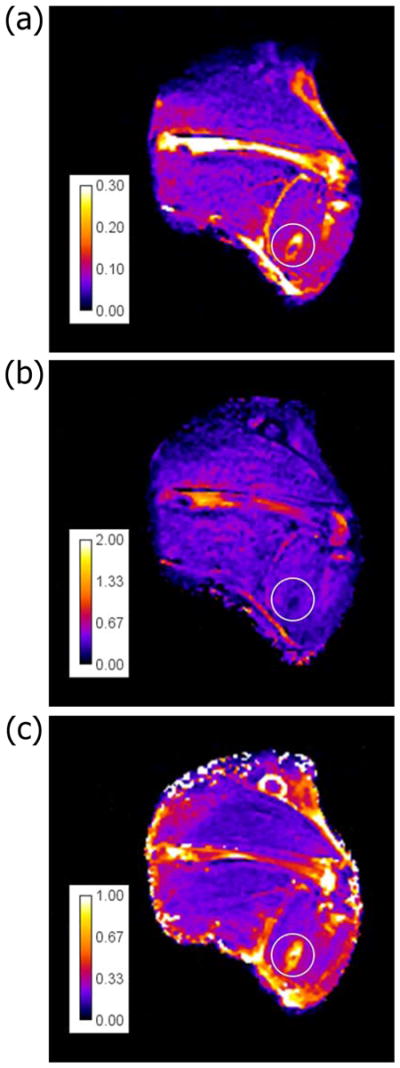
Parameters distribution after treatment. Coronal distribution map for three parameters of tissue property at 24hrs after p-HIFU treatment of thigh muscle New Zealand rabbit. (a) ktrans, (b) kep, (c) ve.
Effect of pHIFU on leakage rate in rabbit muscle
The relative values of ktrans, kep and kep for CE and burn regions measured in Figure 4 are compared to normal tissue in Figure 10. Here, ktrans increases by about 63% in the CE regions but decreases by about 61% in the burned regions. On the other hand, kep is reduced in both the CE and burned regions. ve is increased by over 125% in the CE regions, but changes little in the burned region. The result of a successful treatment is a 1.5- to 2-fold increase in permeability, coupled to a 40% reduction in clearance rate. Taken together over time, this is a factor of 3- to 4-fold increase in exposure.
Figure 10.

Parameters distribution in different regions. Relative values of (from left to right) ktrans, kep and ve in unaffected regions, regions with enhanced contrast uptake, and regions of decreased contrast (burns). Significance is determined relative to the unaffected group (* P<0.05, ** P<0.01, *** P<0.001).
DISCUSSION
This study demonstrates how controlled focused ultrasound thermal treatment can be optimized to enhance the transport properties of tissues for drug and nanoparticle delivery. The approach was to study pulsed-HIFU treatment in rabbit muscle using a clinical MRI-guided HIFU system. By studying muscle, we avoid the complications and heterogeneity of a tumor model, but still address some of the fundamental questions raised in the previous small animal work. Based on our findings, we propose the following treatment optimization strategy for general tissue:
treat with HIFU at low Pav,
use thermal feedback to reach a target temperature,
follow up with T2-weighted imaging to verify an effect,
re-treat at higher Pav if necessary,
otherwise, follow with therapeutics in the 12–36 hrs CE window.
The Tmx chosen for treatment largely depends on the trade-off between minimizing the risk of a burn and maximizing the size of the CE region. The greatest likelihood of achieving a successful treatment in muscle appears at peak temperatures of 49–52 °C (±1 °C) for treatments 50–120s in length (CEM43 about 400 minutes). A successful treatment is a several fold increase in exposure accompanied by increased penetration of therapeutics and nanoparticles into the tissue. This is, in fact, the same range of changes as were observed in the mouse experiments (4,7,9). However, one notable conclusion of this study is also the failure of treatment in rabbits when using parameters optimized for murine models. Likely this is due to the large change in muscle volume. In the mouse, boundary conditions dominate the acoustic, thermal and mechanical physics, whereas rabbit muscle is practically a bulk tissue (22). We therefore expect our rabbit study to be a more relevant indicator of success in a human treatment. Our results also eliminate any significant role for purely mechanical effects, except possibly as adjuvant to heat. A significant difference between pulsed and continuous mode HIFU is therefore not anticipated for treatments with the same temporal average power. Nevertheless, p-HIFU here was used effectively to modulate the average power and thermal deposition in real time by changing the duty cycle as an alternative to modulating the peak power. This approach is rather easily integrated into the ExAblate device and could be used in a feedback control loop.
The first observed effect immediately following successful treatment is edema, which appears in T2-weighted images taken immediately post-sonication, an effect similar to that observed in burn injuries (23). This edema is probably caused by a relaxation of the tensile intercellular forces that normally hold the tissue in a state of elevated relative pressure. In tumors with high interstitial fluid pressure (IFP), depending on boundary conditions, p-HIFU could plausibly result in a useful reduction in IFP, as observed by Watson et al. (8). Normally the reduced local pressure is quickly equilibrated by an inflow of fluid from the vasculature, until the swelling is balanced by external pressure from surrounding tissues or rise in osmotic pressure due to influx of macromolecules. Since a 0-hr increase in ktrans was not observed in our muscle experiments, an immediate increase in vascular permeability is likely not a factor in the edema. Twenty-four hours later, however, this changes, as described above. The improvement of nanoparticle uptake at the 24-hr time point was also observed in a previous study of p-HIFU treatment of mouse muscle (9). The appearance and subsequent development of the CE region over time suggests that this effect is largely biological in nature. The spread of the enhanced region along the muscle fiber direction well outside the treated region implies the diffusion of cytokines in this preferential direction. This spreading of the affected zone may be leveraged to increase the impact of treatment over a volume several times larger than the spot size. In the few animals observed outside the 0-hr and 24-hr time points, a CE effect appeared as early as 12 hrs and lasted several days, with the larger regions lasting longer. By the time the second limb was treated, typically 3–4 weeks later, treatment areas in the first leg were invariably no longer visible on either T2 or CE scans. The 24 hr histology of a successful treatment shows a region of acute inflammation that largely corresponds to the region of increased ktrans and ve. These results are consistent with observations reported in Cheng et al. (11) where a similar region encircling the central coagulative necrosis was labeled ‘Zone I’ for its inflammation. That paper suggests that Zone I is broken down and ingested by neutrophils and macrophages and repaired within one week (11). Although we did not study tissue recovery in great detail, our results largely agree with these observations. However, our treatments result in thermal boundaries that are less abrupt than those in (11), and this transition zone could have many cells that remain viable.
Further careful research on recovery following these treatments is required to properly assess the viability of tissue in and around this region, as well as the potential for leakage of small molecules, macromolecules, and nanoparticles from this region into adjacent tissues. However, one conclusion of this research is that the window for a successful treatment that causes no permanent damage is very narrow, if it exists at all, while the variability in biological response to treatment is large. We are forced to conclude that there is little margin for safety and that these treatments may not be suitable for all organs and situations.
The next step in this work is to move this effect out of muscle and into tumor tissue. One should expect that different tissues will provide somewhat different responses both in terms of the temperatures required and in terms of the magnitude of the changes accrued. It is very likely that the response of tumor to this treatment will be less dramatic than that of muscle. This is partly because tumor often already has enhanced permeability and inflammation, and partly because of lower tumor initial response to hyperthermia (24) and subsequent thermo-tolerance (25). On the other hand, with less concern for protecting tissue, it should be possible to push the treatments to slightly higher temperatures to create a more widespread effect. The combination of HIFU-enhanced delivery and chemotherapy could help in solving the practical issue of long HIFU ablation times by improving coverage via combinations of thermo- and chemo-ablation. A major advantage of this technique over many competitors, including those based on ultrasound combined with thermo-sensitive liposomes or microbubbles, is its rapid translatability. Separating the physical ultrasound treatment from the subsequent administration of drug or nanoparticle may limit the net impact of the method but also means there is no need for regulatory approval of individual drug-device combinations. This is therefore a technique that, depending on efficacy, could quickly be adopted in clinical practice for a multitude of drugs, macromolecules and nanoparticles.
In conclusion, our results demonstrate that we are able to leverage MRI guidance to optimize HIFU treatment parameters and simultaneously enhance drug penetration across the vasculature, into tissue while reducing clearance, thereby increasing residence time and influence on nearby cells.
Acknowledgments
Supported by NIH grants 5R01 EB009009 (KCL) and U01 CA166886-01 (XZ).
We would like to acknowledge the many valuable discussions with Dr. Leif Peterson and Dr. Elisabetta Sassaroli, as well the contributions of members of the Translational Biosystems Laboratory.
References
- 1.Yuh EL, Shulman SG, Mehta SA, et al. Delivery of systemic chemotherapeutic agent to tumors by using focused ultrasound: study in a murine model. Radiology. 2005;234:431–437. doi: 10.1148/radiol.2342030889. [DOI] [PubMed] [Google Scholar]
- 2.Dittmar KM, Xie J, Hunter F, et al. Pulsed high-intensity focused ultrasound enhances systemic administration of naked DNA in squamous cell carcinoma model: Initial experience. Radiology. 2005;235:541–546. doi: 10.1148/radiol.2352040254. [DOI] [PubMed] [Google Scholar]
- 3.Frenkel V, Etherington A, Greene M, et al. Delivery of liposomal doxorubicin (Doxil) in a breast cancer tumor model: Investigation of potential enhancement by pulsed-high intensity focused ultrasound exposure. Academic Radiol. 2006;13:469–479. doi: 10.1016/j.acra.2005.08.024. [DOI] [PubMed] [Google Scholar]
- 4.Khaibullina K, Jang BS, Sun H, et al. Pulsed high intensity focused ultrasound enhances uptake of radiolabeled monoclonal antibody to human epidermoid tumor in nude mice. J Nucl Med. 2008;49:295–302. doi: 10.2967/jnumed.107.046888. [DOI] [PubMed] [Google Scholar]
- 5.Frenkel V, Oberoi J, Stone MJ, et al. Pulsed high-intensity focused ultrasound enhances thrombolysis in an in vitro model. Radiology. 2006;239:86–93. doi: 10.1148/radiol.2391042181. [DOI] [PMC free article] [PubMed] [Google Scholar]
- 6.Stone MJ, Frenkel V, Dromi S, et al. Pulsed-high intensity focused ultrasound enhanced tPA mediated thrombolysis in a novel in vivo clot model, a pilot study. Thromb Res. 2007;121:193–202. doi: 10.1016/j.thromres.2007.03.023. [DOI] [PMC free article] [PubMed] [Google Scholar]
- 7.Sheikov N, McDannold N, Vykhodtseva N, Jolesz F, Hynynen K. Cellular mechanisms of the blood-brain barrier opening induced by ultrasound in presence of microbubbles. Ultrasound in Medicine & Biology. 2004;30:979–989. doi: 10.1016/j.ultrasmedbio.2004.04.010. [DOI] [PubMed] [Google Scholar]
- 8.Watson KD, Lai CY, Qin S, et al. Ultrasound increases nanoparticle delivery by reducing intratumoral pressure and increasing transport in epithelial and epithelial-mesenchymal transition tumors. Cancer Res. 2012;72:1485–1493. doi: 10.1158/0008-5472.CAN-11-3232. [DOI] [PMC free article] [PubMed] [Google Scholar]
- 9.O’Neill BE, Vo H, Angstadt M, Li KCP, Quinn TP, Frenkel V. Pulsed high intensity focused ultrasound mediated nanoparticle delivery: mechanisms and efficacy in murine muscle. Ultrasound Med Biol. 2009;35:416–424. doi: 10.1016/j.ultrasmedbio.2008.09.021. [DOI] [PMC free article] [PubMed] [Google Scholar]
- 10.Padhani AR. Dynamic contrast-enhanced MRI in clinical oncology: current status and future directions. J Magn Reson Imaging. 2002;16:407–422. doi: 10.1002/jmri.10176. [DOI] [PubMed] [Google Scholar]
- 11.Cheng HM, Purcell CM, Bilbao JM, Plewes DB. Usefulness of contrast kinetics for predicting and monitoring tissue changes in muscle following thermal therapy in long survival studies. J Magn Reson Imaging. 2004;19:329–341. doi: 10.1002/jmri.20014. [DOI] [PubMed] [Google Scholar]
- 12.Ishihara Y, Calderon A, Watanabe H, et al. A precise and fast temperature mapping using water proton chemical shift. Magn Reson Med. 1995;34:814–823. doi: 10.1002/mrm.1910340606. [DOI] [PubMed] [Google Scholar]
- 13.Sapareto SA, Dewey WC. Thermal dose determination in cancer therapy. Int J Radiat Oncol Biol Phys. 1984;10:787–800. doi: 10.1016/0360-3016(84)90379-1. [DOI] [PubMed] [Google Scholar]
- 14.Tofts PS, Brix G, Buckley DL, et al. Estimating kinteic parameters from dynamic contrast-enhanced T1 weighted MRI of a diffusable tracer: standardized quantities and symbols. J Magn Reson Imaging. 1999;10:223–232. doi: 10.1002/(sici)1522-2586(199909)10:3<223::aid-jmri2>3.0.co;2-s. [DOI] [PubMed] [Google Scholar]
- 15.Armitage P, Behrenbruch C, Brady M, Moore N. Extracting and visualizing physiological parameters using dynamic contrast-enhanced magnetic resonance imaging of the breast. Medical Image Anal. 2005;9:315–329. doi: 10.1016/j.media.2005.01.001. [DOI] [PubMed] [Google Scholar]
- 16.Deoni SC, Rutt BK, Peters TM. Rapid combined T1 and T2 mapping using gradient recalled acquisition in the steady state. Magn Reson Med. 2003;49:515–526. doi: 10.1002/mrm.10407. [DOI] [PubMed] [Google Scholar]
- 17.Kety SS. The theory and applications of the exchange of inert gas at the lungs and tissues. Pharmacol Rev. 1951;3:1–41. [PubMed] [Google Scholar]
- 18.Tofts PS. Modeling tracer kinetics in dynamic Gd-DTPA MR imaging. J Magn Reson Imaging. 1997;7:91–101. doi: 10.1002/jmri.1880070113. [DOI] [PubMed] [Google Scholar]
- 19.Powell MJD. On search directions for minimization algorithms. Mathematical Programming. 1973;4:193–201. [Google Scholar]
- 20.R Development Core Team. R: A Language and Environment for Statistical Computing. Vienna, Austria: R Foundation for Statistical Computing; 2012. [Google Scholar]
- 21.Therneau TM, Atkinson B. S-PLUS/R Functions: Packages: rpart. Mayo Clinic Division of Biomedical Statistics and Informatics; [Accessed May 2012]. Web site. http://mayoresearch.mayo.edu/mayo/research/biostat/splusfunctions.cfm. Published April, 2002. [Google Scholar]
- 22.O’Neill BE, Karmonik C, Sassaroli E, Li KCP. Translational studies of pulsed HIFU enhanced tissue permeability: mechanisms in mouse and rabbit models. In: Yuhas MP, editor. Proceedings of the 2009 IEEE Ultrasonics Symposium. 2009. Piscataway, NJ: IEEE; 2009. pp. 1795–1798. [Google Scholar]
- 23.Wiig H, Rubin K, Reed RK. New and active role of the interstitium in control of interstitial fluid pressure: potential therapeutic consequences. Acta Anaesthesiol Scand. 2003;47:111–121. doi: 10.1034/j.1399-6576.2003.00050.x. [DOI] [PubMed] [Google Scholar]
- 24.Song CW. Effect of local hyperthermia on blood flow and microenvironment: a review. Cancer Res. 1984;44:4721s–4730s. [PubMed] [Google Scholar]
- 25.Kong G, Braun RD, Dewhirst MW. Characterization of the effect of hyperthermia on nanoparticle extravasation from tumor vasculature. Cancer Res. 2001;61:3027–3032. [PubMed] [Google Scholar]