

Abstract
RNAs are prone to misfolding, but how misfolded structures are formed and resolved remains incompletely understood. The Tetrahymena group I intron ribozyme folds in vitro to a long-lived misfolded conformation (M) that includes extensive native structure but is proposed to differ in topology from the native state (N). A leading model predicts that exchange of the topologies requires unwinding of the long-range, core helix P3, despite the presence of P3 in both conformations. To test this model, we constructed sixteen mutations to strengthen or weaken P3. Catalytic activity and in-line probing showed that nearly all of the mutants form the M state before folding to N. The P3-weakening mutations accelerated refolding from M (3–30-fold) and the P3-strengthening mutations slowed refolding (6–1400-fold), suggesting that P3 indeed unwinds transiently. Upon depletion of Mg2+, the mutations had analogous effects on unfolding from N to intermediates that subsequently fold to M. The magnitudes for the P3-weakening mutations were larger than in refolding from M, and small angle X-ray scattering showed that the ribozyme expands rapidly to intermediates from which P3 is disrupted subsequently. These results are consistent with previous results indicating unfolding of native peripheral structure during refolding from M, which probably permits rearrangement of the core. Together, our results demonstrate that exchange of the native and misfolded conformations requires loss of a core helix in addition to peripheral structure. Further, the results strongly suggest that misfolding arises from a topological error within the ribozyme core, and a specific topology is proposed.
Keywords: Structured RNA, group I intron, catalytic RNA, RNA folding, RNA topology
Introduction
RNAs function in essential biological processes that require precise folding to specific three-dimensional structures. On the whole, RNA folding is sequential and hierarchical, starting with the rapid formation of base pairs to form stable helices, the basic unit of secondary structure.1, 2 These helices then adopt specific arrangements and form tertiary contacts, generating a native structure.3, 4 Numerous studies have demonstrated misfolding of RNAs to intermediates that must then refold to the native structures.5–13 Presumably, misfolding can arise at the levels of secondary or tertiary structure.14–16 However, beyond the formation of non-native secondary structures for certain RNAs, the physical origins of misfolding are largely unknown.14
The Tetrahymena thermophila group I intron and its ribozyme derivative have been used extensively to study RNA folding (Fig. 1a). Early work demonstrated that a heat renaturation step in the presence of Mg2+ ion was required for maximum catalytic activity, and in the absence of this step the RNA adopted one or more alternative, inactive conformations.13, 17 Inactive structures in the precursor RNA were also found and shown to arise from alternative base pairing arrangements involving flanking exon sequences.18, 19
Figure 1.
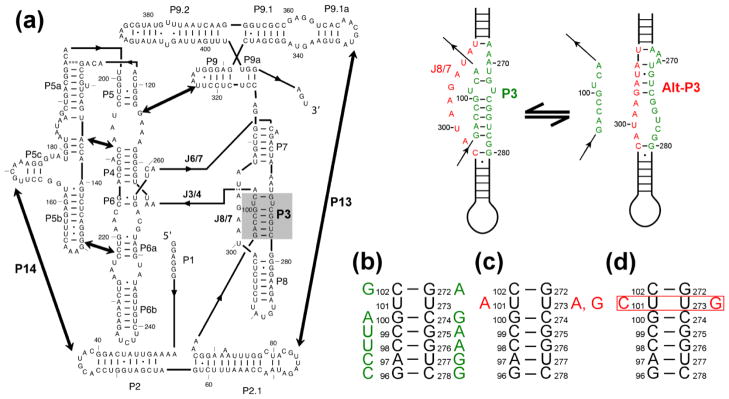
The Tetrahymena ribozyme and mutants used herein. (a) Ribozyme secondary structure. The ribozyme contains five long-range contacts, indicated by thick arrows. The P3 helix is shaded in gray. To the right of the diagram are depictions of the P3 helix in isolation and the short-range alternative helix alt-P3. (b–d) Point mutations are shown that are designed to destabilize the P3 helix by disrupting a single base pair (panel b) or stabilize P3 by creating an A-U base pair (panel c), a U-G wobble pair (panel c), or a C-G pair (panel d).
Extensive subsequent work showed that the intron RNA folds in vitro in the presence of Mg2+ through a series of intermediates.20–24 An RNase H-directed RNA cleavage approach showed rapid accumulation of an intermediate in which the P4–P6 domain was protected from cleavage, whereas full protection of the ribozyme and the onset of detectable catalytic activity occurred on the timescale of minutes.20 Further investigation of the lifetime of these folding intermediates by time-resolved hydroxyl radical footprinting elucidated a hierarchical order of folding, with protections in the P4–P6 domain and some of the P3–P9 domain occurring within milliseconds to seconds, depending on conditions, while complete folding of P3–P9 required minutes.25–27 Small angle X-ray scattering and mutagenesis showed that most of the global compaction of the ribozyme occurs concomitantly with the formation of tertiary structure within P4–P6, and subsequent folding steps reflect rearrangements of compact structures.22, 28
At least some of the accumulated intermediates were shown to reflect kinetic traps, as they require disruptions of structure to continue folding productively. Protections within P3–P9 were accelerated by mutations that weaken native structure within the peripheral element P5abc, implying that disruption of native structure in that region facilitates rearrangement of non-native structure elsewhere in the ribozyme.11 Further evidence for misfolding came from experiments using modification-interference and native gel mobility, which showed accumulation of one or more inactive intermediates.29 Here the formation of the inactive conformation(s) correlated with the predicted ability of the RNA to form a non-native base-pairing interaction within the catalytic core, alt-P3, replacing the native long-range helix P3 (Fig. 1a).29 Strong evidence came from a mutation that was predicted to stabilize P3 and destabilize alt-P3 (U273A), which resulted in a ribozyme that avoided detectable misfolding.29, 30
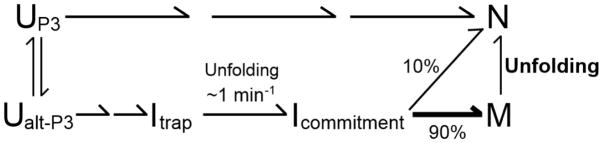
Experiments using catalytic activity as an assay for folding provided further support for the role of P3 formation in native folding and brought together the earlier observations into a unified folding framework that includes two misfolded intermediates (Scheme 1).10, 31 On the timescale of seconds under standard in vitro conditions, essentially the entire population forms the first misfolded intermediate, termed Itrap.31 A small fraction of the population then reaches the native state on the timescale of a minute, while the remainder (90% at 25 °C) forms a long-lived misfolded intermediate termed M.31–33 Refolding of M to the native state occurs slowly, in hours, and requires extensive unfolding, as the transition is accelerated by urea and mutations that disrupt any of the five native peripheral tertiary contacts.33 Population of the M state was avoided by the U273A mutation or by initiating folding from elevated Na+ concentration, which was shown to promote formation of the native P3 base pairs in the starting ensemble.30, 31, 34
Scheme 1.
With this kinetic framework established, further work probed the structure of the M state more deeply.33 Despite the apparent requirement for alt-P3 in misfolding, it was shown that P3, not alt-P3, is formed in the M state. Dimethyl sulfate (DMS) and hydroxyl radical footprinting demonstrated that M strongly resembles the native state (N), with highly localized differences within the conserved core and no differences that would indicate any changes in secondary structure.33, 34 These results were consistent with earlier evidence that the M state is highly compact and globally similar to the N state.35 Further evidence for P3 in the M state came from 2-aminopurine substitution at a nucleotide that is unpaired in P3 but paired in alt-P3.33 The apparent paradox between the structural similarity of the M and N states and their slow interconversion led to the suggestion of a novel origin of misfolding. Rather than including non-native secondary or tertiary structure, it was proposed that the M state is a topological isomer of the native conformation, with an incorrect strand crossing within the core that can only be resolved with extensive unfolding of the ribozyme. Four possible incorrect strand crossings were suggested, and modeling indicated that these strand crossings were sterically feasible.33, 35
One of these topology models also provided a possible resolution to the paradox that alt-P3 formation is required for formation of the M state but is not present in M. In this model, formation of alt-P3 early in folding leads to the incorrect arrangement of two single-stranded segments, J3/4 and J6/7, which cross each other in the ribozyme core (Fig. 1a; see also Fig. 10 and Discussion). The imprint of alt-P3 is then retained in the form of this altered strand crossing – i.e. an alternative topology – even though alt-P3 is resolved during folding to the M state.
Figure 10.

Structural model for interconversion of the native and misfolded conformations. The major domains are represented as cylinders, with the exception of P3–P8 which is depicted as black strands and P1 which is omitted for clarity. P4–P6 is purple, P5abc is blue, P9 is green, and P2 is orange, with the cylinders made transparent in order to more clearly see P3 and associated single-stranded regions. The single-stranded junctions J3/4, J6/7, and J8/7 are colored as shown in the insets. Starting from the misfolded state (bottom right), disruption of the peripheral tertiary contacts occurs prior to P3 disruption. These disruptions allow a rearrangement that generates the native topology (top left), and then the native state is generated by re-formation of P3 and the tertiary contacts (top right).
This specific topology model also leads to the strong prediction that P3 would be transiently disrupted during refolding of M, because this disruption would allow the domains to move relative to each other and to exchange the incorrect topology for the correct topology. To test this prediction, we systematically mutagenized P3 and used catalytic activity to monitor folding. We show that destabilizing P3 accelerates transitions between the native and misfolded species, while stabilizing P3 slows these transitions, suggesting that P3 is indeed transiently disrupted. In-line probing supports and extends previous analyses of the native and misfolded conformations, and together the results strongly support the model in which this non-native core topology is adopted early in folding and persists in the M state even after the native secondary structure is formed later in folding.
Results
Generation and characterization of P3 weakening and strengthening mutants
To test the model that P3 is disrupted during refolding of the misfolded ribozyme, we generated twelve mutants that are predicted to weaken P3 by creating single mismatches (Fig. 1b) and four mutants that are predicted to strengthen P3 by adding a base pair, replacing the single internal mispair (Fig. 1c–d). To maximize the chances of generating mutants that retain function, we used comparative sequence analysis to select nucleotides that are present in related group I introns.36 We first tested the mutants to ensure that they retained catalytic activity and that they misfolded. After prefolding to the native state by extended incubation at 50 °C, all of the mutants were catalytically active (Fig. S1). Although some mutants displayed decreased rate constants of substrate cleavage, all were sufficiently active to allow catalytic activity to be used to measure native folding.37 For ten of the P3-weakening mutants, omission of the 50 °C pre-folding treatment resulted in a much smaller ‘burst’ of substrate cleavage, indicating that these ribozyme mutants misfolded (described further below). For the other two P3-weakening mutants, G96C and C278G, just a brief folding incubation at 25 °C gave a population of predominantly native ribozyme for G96C and all native ribozyme within the detection limit for C287G (Fig. S2), and other experiments showed that these two mutants indeed avoid accumulation of the M state (D.M. and R.R., unpublished results). All of the P3-strengthening mutants were shown to misfold, although they gave less misfolded ribozyme than the wild type. The U101A mutation had a modest effect, with 20–30% folding rapidly to the native state instead of the 10% characteristic of the wild type (described further below; see Fig. 6a), while the other three mutants formed 70–80% native ribozyme (see Fig. 6b below). At face value, this latter result is consistent with previous results for folding of U273A, which led to the conclusion that this mutant avoided misfolding.29–31 However, further analysis, described below (see P3 is disrupted during refolding to the native state), indicated that smaller but significant fractions of these three mutants indeed misfolded, and we used catalytic activity to monitor refolding of the misfolded populations to the native state.
Figure 6.

Refolding of misfolded P3-strengthening mutant ribozymes. (a) Refolding of U101A at 37 °C and 10 mM Mg2+. The values for the fraction of native ribozyme are normalized by the amplitude for a reaction in which the ribozyme was pre-folded to the native state. (b) Folding progress curves at 37 °C and 10 mM Mg2+ for U273A, U273G, and U101C:U273G P3-strengthening mutants in the absence of additional Na+. The values for the fraction of native ribozyme are normalized by the amplitude for reactions in which each ribozyme was pre-folded to the native state. The refolding curve for the wild-type ribozyme is reproduced from Fig. 4 for comparison. (c) Refolding of U273A. The concentrations of added Na+ (in addition to ~20 mM Na+ present as a component of the 50 mM Na-MOPS buffer) are: 50 mM (filled circles), 100 mM (open circles), 150 mM (filled squares), 200 mM (open squares), 300 mM (filled diamonds), and 400 mM (open diamonds). The values for the fraction of native ribozyme are normalized by the amplitudes for reactions in which the ribozyme was pre-folded to the native state (Fig. S1). (d) Refolding rate dependence on Na+ concentration for P3-strengthening mutant ribozymes. Data for refolding of U101C:U273G is excluded in this plot because the experiment was performed at a higher temperature (50 °C) and thus is not directly comparable.
In-line probing to detect formation of the M state
To determine whether the mutants fold to the same M state as the wild-type ribozyme, we compared the misfolded structures using in-line probing, which measures spontaneous cleavage that occurs preferentially at unpaired, flexible nucleotides.38, 39 To determine whether in-line probing gives distinct signals for the M and N states, as well as to further probe the structure of the M state, we first applied the method to the wild-type ribozyme. Strand cleavage was observed at 31 positions within the native ribozyme, which were resolved to individual nucleotides or small groups of nucleotides (Fig. 2a). The same positions gave cleavage in the M state, highlighting the similarity of these structures. Of the 44 total nucleotides that were reactive, 27 gave indistinguishable intensities in the N and M states, whereas 17 were differentially reactive (Fig. 2b). While the reactive nucleotides were spread throughout the ribozyme (Fig. 2c), the differences were clustered in the core, with 11 of them present within 12 Å of A105 (at the junction of the P4–P6 and P3–P7 domains) and all but two within 20 Å (Fig. 2d). Of the 17 nucleotides, 13 gave greater cleavage in the M state, perhaps reflecting increased dynamics.40 The localization of the differences within the core is in good agreement with previous DMS and hydroxyl radical footprinting results (Fig. S3), and several of the nucleotides that gave differences by in-line probing overlapped or were close to regions that gave differences with the other probes.33 Specifically, all three probes gave differential reactivity within P7, including changes at the same nucleotide (A269), and in-line probing and DMS both gave differences in J6/6a and J9.1/9.1a, which pack against the P7-P3-P8 helical stack.
Figure 2.

In-line probing of the wild-type ribozyme. (a) Nucleotide positions that gave detectable cleavage by in-line probing of the native ribozyme. Values are reported as the normalized average and standard deviation from at least two experiments (see Methods). (b) Comparison of backbone cleavages observed in the misfolded and native states of the wild-type ribozyme. Red bars indicate individual nucleotides or groups of nucleotides that give 2-fold or greater changes, highlighting the largest differences. The red dashed lines demarcate 2-fold changes. (c) Positions within the three-dimensional structure of the ribozyme of nucleotides that gave detectable cleavage in in-line probing experiments (colored by domain). (d) Positions of nucleotides that gave differences by in-line probing in the M and N states. Nucleotides that were cleaved to a greater extent in the misfolded state colored pale red and those that were cleaved to a greater extent in the native state colored pale blue. In panels c and d a ribozyme model is shown,64 with the P2 domain in orange, P3–P8 domain in red, P4–P6 in purple, P5abc in blue, and P9 in green. Regions not probed are in gray. P1 and P10 are omitted for clarity. Nucleotide A105 is indicated by a black dot.
We then performed in-line probing of one P3-weakening mutant (C98U) and one P3-strengthening mutant (U101A). Both mutants gave intensity patterns in the N state and differences in the M state that mirrored those of each other and the wild-type ribozyme, indicating that they all form the same M state (Fig. 3). Most of the other mutants could not be probed by this method because their refolding is too fast or because only small fractions fold to M. However, the catalytic activity assays below reveal parallels in behavior of all of the mutants that misfold, and we infer that they all form a common M state, allowing the results below to be interpreted in terms of the structure and properties of this state.
Figure 3.

In-line probing of mutant ribozymes. Cleavage levels are shown for nucleotides that gave detectable cleavage of the C98U and U101A mutants in the native state (panel a) and in the misfolded state (panel b). Results from the wild-type ribozyme (WT) are shown for comparison.
P3 is disrupted during refolding to the native state
We then used this collection of mutants to probe the structure of the M state by monitoring the kinetics of the folding transition to the N state. This transition is complex and includes both unfolding and folding steps;33 for simplicity we refer to the entire transition as refolding of M. We reasoned that if the native P3 helix is present in the M state and is disrupted in the transition state for refolding, destabilizing P3 should facilitate disruption of the helix and increase the rate constant. Likewise, stabilizing the helix should decrease the rate constant. For the P3-weakening mutants, we generated the misfolded ribozyme in a brief incubation at 25 °C and 10 mM Mg2+. We then transferred the ribozyme to 37 °C to measure refolding under the same conditions as previous analyses31–33 by withdrawing aliquots at various folding times and determining the fraction of added substrate that is cleaved rapidly (Fig. 4a).37 The P3-weakening mutants refolded approximately 3-fold to 30-fold faster than the wild-type ribozyme (Fig. 4b, Fig. S4, and Table 1). Refolding was generally faster at lower Mg2+ concentrations and occurred in a single exponential phase under all conditions tested, as expected for a single misfolded conformation or an ensemble of rapidly interconverting conformations (Fig. S5).31
Figure 4.
Refolding of misfolded P3-weakening mutants. (a) Reaction scheme. (b) Refolding of wild-type ribozyme (filled circles, 0.0023 min−1) and two representative P3-weakening mutant ribozymes, C98U (open squares, 0.0059 min−1) and G272A (open diamonds, 0.036 min−1). Analogous refolding curves are shown for all of the P3-weakening mutants in Fig. S4, and rate constants are given in Table 1. The values for the fraction of native ribozyme are normalized by the amplitudes for reactions in which the ribozyme was prefolded to the native state (Fig. S1).
Table 1.
Rate constants for refolding to the native state of P3-weakening mutants.
| Ribozyme | M-to-N Refolding at 37 °C | M-to-N Refolding at 25 °C | ||
|---|---|---|---|---|
|
| ||||
| krefold (min−1) a | Rel | krefold (min−1) a | Rel | |
| Wild-Type | 0.0023 ± 0.0002 | (1) | 0.00032 ± 0.00012 | (1) |
| A97C | 0.024 ± 0.001 | 10 | 0.00032 ± 0.00012 | 1.0 |
| C98U | 0.0059 ± 0.0005 | 2.6 | 0.00057 ± 0.00013 | 1.8 |
| C99U | 0.019 ± 0.002 | 8.4 | 0.0019 ± 0.00005 | 5.7 |
| G100A | 0.023 ± 0.001 | 9.9 | 0.0026 ± 0.0009 | 8.0 |
| C102G | 0.0077 ± 0.001 | 3.4 | 0.00056 ± 0.00011 | 1.7 |
| G272A | 0.036 ± 0.0023 | 16 | 0.0031 ± 0.0005 | 9.6 |
| C274G | 0.0058 ± 0.0003 | 2.5 | 0.00045 ± 0.00003 | 1.4 |
| G275A | 0.012 ± 0.001 | 5.1 | 0.00067 b | 2.1 |
| G276A | 0.062 ± 0.012 | 27 | 0.0054 ± 0.0026 | 17 |
| U277G | 0.026 ± 0.002 | 12 | 0.0022 ± 0.00045 | 6.6 |
Values represent the average and standard error from at least two experiments.
Value for G275A represents the rate constant from a single experiment.
We performed a double mutant cycle to confirm that the effects of the mutations arise from destabilizing P3. The A97C:U277G mutant includes two point mutations that disrupt a base pair and accelerate refolding when introduced individually (10-fold for A97C and 12-fold for U277G; Table 1), but restore base pairing when introduced together. Rather than giving independent effects, i.e. 120-fold faster refolding, the double mutant gave a rate constant within 2-fold of that for the wild-type ribozyme (Fig. 5). Together, these results provide strong support for the presence of the P3 helix in M and its disruption during refolding to N.
Figure 5.
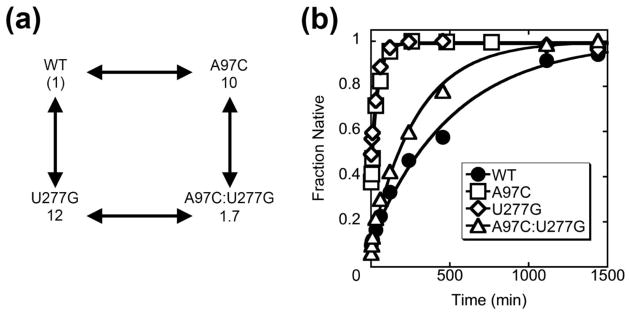
Restoration of a disrupted base pair in P3 slows ribozyme refolding. (a) The double-mutant cycle for A97C:U277G. The numbers represent the rate constants for refolding, relative to that of the wild-type ribozyme (0.0023 min−1), for each mutant. (b) Refolding of the ribozymes listed in (a) at 37 °C and in 50 mM Na-MOPS, pH 7.0, 10 mM Mg2+, and 1 mM guanosine. The values for the fraction of native ribozyme are normalized by the amplitude for reactions in which each ribozyme was pre-folded to the native state. The refolding curves for the wild-type ribozyme and the single mutants are reproduced from Fig. 4 and Fig. S4, respectively.
Next we tested the P3-strengthening mutants. The U101A mutant showed clear misfolding and refolding to N. The refolding transition was slower than that of the wild-type ribozyme (6-fold), as expected (Fig. 6a). The other three P3-strengthening mutants were less straightforward. They formed predominantly native ribozyme rapidly upon Mg2+ addition, as observed previously for one of them,29, 31 and incubations under standard conditions or at 50 °C did not give readily detectable increases in the fraction of native ribozyme (Fig. 6b and Table 2). Nevertheless, the native fraction was smaller than for other ribozyme variants, leaving open the possibility that a fraction of the population misfolded and was very long-lived. To test this possibility, we added Na+ during the refolding incubation, which was shown previously to accelerate refolding of the wild-type ribozyme.33 With as little as 150 mM added Na+, U273A and U273G gave clear increases in the burst amplitude, with transitions that were slower than that of the wild-type ribozyme by 28- and 43-fold, respectively, under the same conditions (Fig. 6c and Fig. S6). The Na+ concentration dependences were similar for the U273A, U273G, U101A, and wild-type ribozymes, suggesting that they all form the same M state (Fig. 6d). For the U101C:U273G double mutant, refolding was slower still, and a combination of Na+ and elevated temperature (50 °C) was used to measure refolding (Table 2).
Table 2.
Rate constants for refolding to the native state of P3-strengthening mutants.
| Ribozyme | 37 °C | 37 °C; 150 mM Added Na+ | 50 °C; 150 mM Added Na+ | |||
|---|---|---|---|---|---|---|
|
| ||||||
| krefold (min−1) | Rel | krefold (min−1) | Rel | krefold (min−1) | Rel | |
| Wild-Type | 0.0023 | (1) | 0.66 | (1) | 33 a | (1) |
| U101A | 0.00035 | 0.15 | 0.19 | 0.29 | -- | -- |
| U273A | -- | -- | 0.024 | 0.036 | -- | -- |
| U273G | -- | -- | 0.015 | 0.023 | -- | -- |
| U101C:U273G | -- | -- | -- | -- | 0.024 | 0.00073 |
Calculated as the value measured under standard conditions at 37 °C (0.0023 min−1 column 1) multiplied by the effects of adding 150 mM Na+ (290-fold, column 2) and raising the temperature to 50 °C (50-fold, ref. 33).
The refolding rate constants were used to calculate the extent to which each mutation altered the stability of the M state relative to the transition state for refolding. The experimental ΔΔG‡ values range from 2.0 kcal mol−1 (destabilizing) to −3.9 kcal mol−1 (stabilizing). In Fig. 7, these values are plotted against the values predicted from thermodynamic parameters41–45 to assess a simple model in which P3 is completely disrupted in the transition state for the overall refolding process. There is qualitative agreement between the measured and predicted values, but significant differences are present. The measured free energy differences are generally smaller than the predicted values for complete P3 disruption. This difference may reflect differences in solution conditions or complicating effects of the higher-order ribozyme structure, or it may indicate that the rate-limiting transition state is reached with P3 partially formed, presumably with dissociation of the remaining base pairs being rapid and favorable.46 In addition, the weakening mutants give approximately equal values despite a range of predicted effects. The simplest model to account for this effect is that when P3 is destabilized there is a change in rate-limiting step, perhaps to disruption of a peripheral tertiary contact or contacts (see Fig. 10 and Discussion).32 Together, the results in this section provide strong evidence that P3 is disrupted during refolding from the M state to the native state.
Figure 7.

Comparison of predicted and experimentally derived ΔΔG‡ values are plotted for each of the P3-weakening mutant ribozymes. P3-weakening mutant ribozymes are shown in green and P3-strengthening mutant ribozymes are shown in red. ΔΔG‡ values for U273A, U273G, and U101C:U273G were measured in the presence of 150 mM added Na+. The gray dotted line represents a match between the measured and calculated ΔΔG‡ values.41–45
P3 disruption during unfolding of the native ribozyme
If P3 is disrupted during the transition from the misfolded to the native state, the same should be true for the reverse reaction. It is not straightforward to measure this transition directly because the native structure is much more stable than the misfolded state.31, 40 However, upon dilution of Mg2+ the native state is destabilized and unfolds to intermediates or unfolded species that are no longer committed to fold directly to N and will instead fold to M upon Mg2+ addition.31 Although the lower Mg2+ concentration is certain to change the folding landscape dramatically and may lead to new pathways and intermediates, we reasoned that the most basic features of the rearrangements that allow exchange of the M and N states may be maintained.
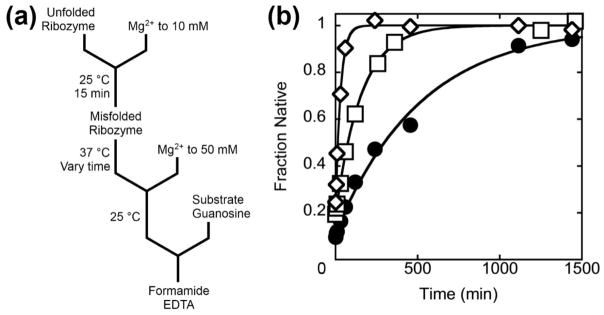
To measure unfolding of the wild-type ribozyme, we folded it to the native state at 50 °C and then added excess EDTA to chelate Mg2+ ions (Fig 8a). The reaction was performed at low temperature (0 °C) to slow the transitions sufficiently for manual pipetting. At various times after EDTA addition we re-added Mg2+ at 25 °C and measured by catalytic activity the fraction of the ribozyme that remained native or remained committed to fold to the native state upon Mg2+ addition. The loss of commitment to native folding occurred with two phases, a rapid phase (> 10 min−1) of variable amplitude followed by a slower phase (0.15 ± 0.03 min−1) (Fig. 8b). The origin of the fast phase is unclear, but it may arise as an artifact from transiently greater EDTA concentrations immediately upon mixing, and we focused on the slow phase. Addition of 50 mM Na+ with EDTA further decreased this rate constant to a value of 0.050 ± 0.014 min−1.
Figure 8.

Ribozyme unfolding monitored by catalytic activity. (a) Reaction scheme. EDTA is added to chelate Mg2+ and the time is varied before Mg2+ is again added. This addition allows the ribozyme to fold back to the native state or to misfold. (b) Unfolding of the wild-type ribozyme (black circles) and the P3-weakening mutants C98U (open squares), G272A (filled triangles), and G276A (filled squares) at 0 °C and 50 mM Na+. The amplitude for the faster phase of unfolding generally is 0.15 – 0.2, although in some experiments the amplitude was as large as 0.65. (c) Unfolding of the wild-type ribozyme (black circles) and the P3-strengthening mutants U101A (open triangles), U273A (red-over-white squares), U273G (white-over-red squares), and U101C:U273G (white discs inset in red squares) at 0 °C. (d) Comparison of the predicted and experimentally observed ΔΔG‡ values for unfolding of P3-weakening mutants (green) or P3-strengthening mutants (red). The corresponding ΔΔG‡ values for refolding (gray) are reproduced from Fig. 7 for comparison.
Mutations that weakened P3 increased the observed rate constant for loss of native folding, in qualitative agreement with their effects on refolding (Fig. 8b and Table 3). However, the accelerations were larger than in the refolding reaction, and some for some mutants only a lower limit could be determined. The P3-strengthening mutants gave slower transitions than the wild-type ribozyme, also in qualitative agreement with their effects on refolding of M (Fig. 8c and Table 3). Again there was a general but imperfect correspondence between the observed and predicted ΔΔG‡ values. For the P3-weakening mutants, the observed values largely matched the predicted values up to the detection limit of ~3.5 kcal mol−1 (Fig. 8d). This indicates that P3 disruption remains rate-limiting for this transition even when it is dramatically accelerated by weakening P3 with mutations (see below). In contrast, the effects of the P3-strengthening mutant ribozymes were smaller than the calculated values and appeared to reach a plateau (see Discussion).
Table 3.
Rate constants for unfolding of the native ribozyme to intermediates that form M.a
| P3-weakening mutants b | P3-strengthening mutants c | ||||
|---|---|---|---|---|---|
|
| |||||
| Ribozyme | kunfold (min−1) | Rel d | Ribozyme | kunfold (min−1) | Rel |
| Wild-Type | 0.050 ± 0.014 | (1) | Wild-Type | 0.15 ± 0.034 | (1) |
| A97C | 11 ± 3.9 | 410 ± 52 | U101A | 0.027 ± 0.0095 | 0.28 ± 0.1 |
| C98U | 0.47 ± 0.24 | 14 ± 0.86 | U273A | 0.026 ± 0.0036 | 0.25 ± 0.08 |
| C99U | 1.8 ± 1.2 | 48 ± 11 | U273G | 0.026 ± 0.0034 | 0.22 ± 0.06 |
| G100A | 2.1 ± 1.1 | 61 ± 4.9 | U101C:U273G | 0.013 ± 0.0017 | 0.091 ± 0.03 |
| C102G | 9.9 ± 6.4 | 220 ± 72 | |||
| G272A | 2.3 ± 0.90 | 100 ± 3.6 | |||
| C274G | ≥15 | ≥300 | |||
| G275A | ≥15 | ≥300 | |||
| G276A | ≥15 | ≥300 | |||
| U277G | ≥15 | ≥300 | |||
Values represent the average and standard error from at least two experiments.
Unfolding reactions were performed at 0 °C in the presence of standard buffer plus 50 mM Na+.
Unfolding reactions were performed at 0 °C in the absence of added Na+.
Relative values are given as the average of the corresponding values calculated independently for each experiment. Error is given as standard error.
Extensive unfolding precedes P3 disruption
A likely model to account for the result that P3 unfolding remains rate-limiting for the loss of commitment to native folding across a broad range of P3 stabilities is that that the peripheral contacts are disrupted rapidly, as they presumably have to be disrupted first to allow P3 to unwind (Scheme 2). Unlike during refolding in the presence of Mg2+, here the loss of tertiary structure is likely to be favorable, such that P3 would then be disrupted from a ground-state intermediate that has already lost global compaction.
Scheme 2.
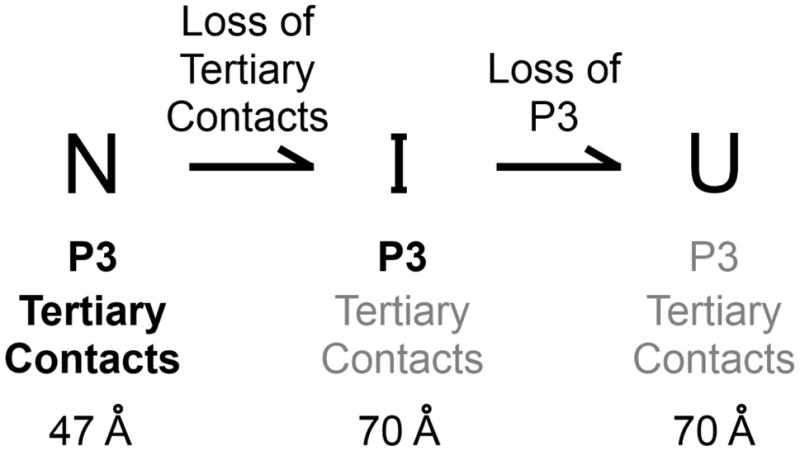
To test this model, we turned to small-angle X-ray scattering (SAXS).3, 47 We used a custom-built mixing device to monitor EDTA-induced unfolding of native ribozyme under the conditions of catalytic activity measurements. The wild-type ribozyme was dramatically expanded within the dead time (0.5–1 s), giving a rate constant of ≥7 s−1 (Fig. 9a and b), at least three orders of magnitude faster than the loss of commitment to native folding measured by catalytic activity. In this transition, the radius of gyration (Rg) increased from 47 Å to 70 Å, nearly the same as the value of 76 Å measured for the unfolded ribozyme in the absence of Mg2+ and EDTA (Fig. S7).3, 35 In the presence of 50 mM Na+, the resulting Rg value was 66 Å, similar to but slightly lower than the value obtained in a static measurement in the absence of Mg2+ and EDTA but at the same Na+ concentration (71 Å, Fig. S7). There was no further increase in the Rg value with increasing unfolding time up to 3 h, such that these small differences, also evident from the Kratky representations of the data, were most likely caused by the differences in solution conditions (Fig. 9a and Fig. S7).
Figure 9.
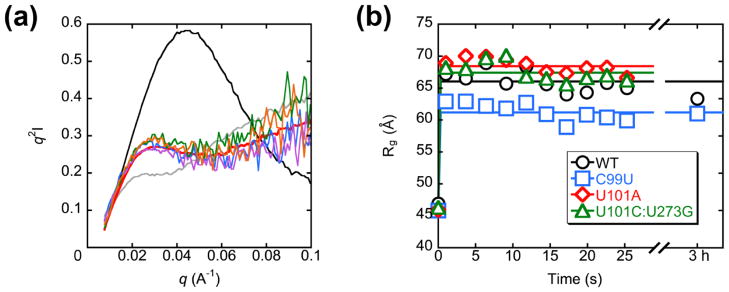
Monitoring global unfolding of native ribozyme by SAXS. (a) Kratky plots of the wild-type ribozyme at 2 °C and 50 mM Na+ after free Mg2+ removal by EDTA addition. Unfolding times are 1 s (blue), 6 s (purple), 15 s (green), and 25 s (orange) after addition of EDTA. Also shown for comparison are plots of the native ribozyme (black), unfolded ribozyme (gray), and a 3 hr time point after EDTA-mediated Mg2+ removal (red). (b) Time course of ribozyme expansion at 2 °C and 50 mM Na+. Rg values are plotted against time after addition of EDTA.
Similar results were obtained for a representative set of mutants. The P3-weakening mutant C99U and P3-strengthening mutants U101A and U101C:U273G gave rapid expansions and no further changes across the observation time (Fig. 9b). Interestingly, the catalytic activity assays above showed that the C99U mutant loses the commitment for native folding within the observation time of the SAXS experiment. The lack of an increase in the Rg value, beyond the rapid, initial change, suggests that the structural rearrangement responsible for the loss of native folding (presumably involving P3 disruption) is not detected by SAXS.
Together the results from catalytic activity assays and SAXS indicate that unfolding occurs in two discrete steps under these very low Mg2+ conditions: the peripheral tertiary contacts are disrupted rapidly, giving a dramatic loss of compaction but not a loss of commitment to native folding, and then P3 is disrupted more slowly in a transition that gives little or no change when monitored by SAXS. It is this disruption of P3 from a globally unfolded structure that allows the rearrangement, postulated to be a change in topology, that leads to misfolding upon subsequent addition of Mg2+ (see Discussion).
Discussion
The Tetrahymena group I intron ribozyme has been known to form alternative conformations for more than twenty years and known to fold to a dominant long-lived misfolded intermediate for a decade, but our understanding of the physical events that lead to misfolding and the non-native structural features of the misfolded intermediate remain incomplete. Here we have provided strong evidence that the core helix P3 is disrupted during transitions from the M state to the native state and from the N state to intermediates that can subsequently misfold upon Mg2+ re-addition. Together with previous results supporting extensive unfolding of the periphery during refolding of M,33 this work indicates that transitions between the highly structured misfolded state and the native state require extensive unfolding of both the periphery and the core. The requirement for unfolding within the core provides further support for models in which the misfolded conformation is a topological isomer of the native state and supports a specific topological change, as noted in the Introduction and outlined in more detail below. Further, as described below, the extensive unfolding of both periphery and core suggests that the transition state ensemble for interconversion of the M and N states resembles early folding intermediates.
A specific topology model for the M state
It was shown previously that the misfolded intermediate is highly structured, including extensive native core and peripheral structure, and native peripheral contacts are disrupted during refolding from the M state.11, 33 The large amount of native structure in the M state and the requirement for peripheral unfolding suggested that the origin of misfolding was likely to be topological.33 There are three single-stranded segments within the core, J3/4, J6/7, and J8/7, that could be crossed incorrectly with any of the others while still allowing an overall folded state of the RNA with extensive native structure (three possible crosses).33, 48 Additionally, J6/7 could be imagined to cross further to the 3′ from J8/7, within the J7/9 segment, giving a cross that is topologically the same as a cross of J6/7 and J8/7.33
Of these strand crossings, only the one between J3/4 and J6/7 requires that both the peripheral contacts and P3 be disrupted in transitions between the M and N states (Fig. 10). In the native structure, J3/4 emanates from P3 and passes behind the P7 helix and J6/7 (in the standard view of the ribozyme). In the misfolded arrangement, J3/4 remains behind P7 but passes in front of J6/7, crossing it incorrectly. The most straightforward mechanism to resolve this topological error is to first disrupt the long-range tertiary contacts and then separate the strands of P3, allowing the 5′ strand of P3, along with the P1/P2 subdomain, to thread between the P4–P6 and P3–P8 subdomains and move to the back of the molecule (Fig. 10). This movement would allow formation of the correct topology, formation of P3, and ultimately reformation of native tertiary contacts and generation of the native state.
Although non-topological origins for misfolding have not been ruled out, they are increasingly unlikely in light of the results herein. A small and local structural difference in the core would be consistent with the prior and current footprinting results, and in principle could give a folding transition that is accelerated by P3 disruption. However, it is difficult to envision such a local difference giving a transition that is so slow and so dependent on P3 disruption. Indeed, P3 strengthening mutants give up to 1400-fold slowing, indicating that any pathway that does not involve P3 disruption is at least 1400-fold slower than the pathway that includes its disruption. This strict requirement for P3 disruption provides further strong evidence against local changes and in support of a topology change.
In addition to being supported by the current data, the specific topology change proposed here is physically plausible, as noted in the Introduction, and it provides a simple explanation as to how formation of alt-P3 at the outset of folding leads to misfolding even though the non-native pairing is replaced by the native P3 helix in the M state. Because alt-P3 is a local, intra-domain pairing, it is expected to increase the range of motion of the various domains relative to each other, allowing adoption of the incorrect topology early in folding. This topological error is retained even as P3 replaces alt-P3 later in folding. On the other hand, formation of the long-range, interdomain P3 helix can be envisioned to enforce the correct interdomain arrangement and therefore the topology, such that the M state is avoided.
Thus, this transition between alternative secondary structures early in folding is proposed to govern the choice of topologies. It should be noted that the transition is likely to include other structural changes that are coupled to the exchange of P3 and alt-P3. Indeed, an alternative pairing termed alt-P1 was shown to coexist with alt-P3 but not with P3, as it includes the 5′ strand of P3 pairing with the internal guide sequence (IGS) at the 5′ end of the ribozyme.29 Replacement of alt-P3 with P3 later in folding would also require disruption of alt-P1, and consistent with this model, the misfolded ribozyme binds the oligonucleotide substrate with a rate constant that is indistinguishable from that of the native ribozyme, indicating that the IGS is not sequestered within an intramolecular helix.31, 33
Intermediates in folding transitions between the native and misfolded states
The model for the M structure and the steps required for interconversion, as shown in Fig. 10, also account well for the results of experiments that monitored unfolding from the native state to intermediates that lost the commitment to native folding (Fig. 8 and 9). The effects of the P3 mutations indicate that the rate-limiting step for this transition is the disruption of P3, and SAXS experiments showed that P3 disruption follows a global expansion that implies a loss of tertiary contacts. These experiments were performed in very low Mg2+ concentration and therefore probe a different folding landscape from the experiments monitoring refolding from the M state. Nevertheless, we propose that the intermediates shown in Fig. 10 are relevant for both sets of conditions, because peripheral unfolding probably occurs first to allow rearrangements within the core. The key difference is that the low Mg2+ concentration stabilizes the expanded intermediate relative to the folded states, such that it accumulates as a rapidly-formed ground state (Fig. 10). In contrast, analogous intermediates do not accumulate during refolding of M (I.J. and R.R., unpublished results).
This model also provides a framework for further interpretation of earlier and current results. Incubation of the ribozyme with high Na+ concentration was shown previously to give formation of P3 and other structural changes,27, 34 and the intermediate was committed to fold to the native state upon Mg2+ addition. The loss of this commitment upon dilution of Na+, prior to Mg2+ addition, gave a similar time dependence as observed here upon Mg2+ depletion (Fig. 8 and D.M. and R.R., unpublished results).34 Thus, we suggest that although the starting states are different in the two sets of experiments, the ribozyme expands rapidly to the same intermediate ensemble, which then undergoes the rate-limiting loss of P3 and subsequent topology change. The idea of different ground states for the two sets of experiments herein also provides an explanation for the different effects of modest increases in Na+ concentration. Addition of 50 mM Na+ slowed the unfolding transition (Fig. 8), presumably by stabilizing the P3 helix while still favoring the rapid expansion to the intermediate state in the very low Mg2+ conditions. In contrast, the same Na+ concentration accelerated the refolding transition from M (Fig. 6),33 most likely by displacing site-bound or delocalized Mg2+ ions, destabilizing tertiary structure and increasing the population of the expanded intermediate while retaining the M structure as the ground state.
One result cannot be explained by the model in Fig. 10. The P3 strengthening mutants gave smaller decreases in the experiments monitoring loss of native folding than in M refolding and gave a plateau with increased strengthening of P3. This plateau suggests that when P3 becomes sufficiently stable, an alternative pathway becomes dominant, which does not involve P3 disruption and is not shown in Fig. 10. It is possible that the topology could be changed by rotating the entire P4–P6 domain 360° into the plane of the page. Regardless of the specific features of the alternative pathway, it is less accessible for refolding from the M state, where no plateau is observed with P3 strengthening, perhaps because it requires transient formation of very extended conformations, which are more strongly disfavored in the presence of Mg2+.
The timing of native structure formation
The early formation of P3 is key to avoiding the pathway that includes the M state,30, 31 as the P3-stabilized mutants are rapidly committed to folding along a pathway that gives native state formation and avoids the M state. On the other hand, if P3 forms later along the pathway to the M state, our catalytic activity results show that refolding to the native state requires the disruption of P3 in addition to disruption of the peripheral structure. The simplest model is that the error occurred early in folding, when P3 did not form, and it can only be corrected by reforming extended, ‘early’ folding intermediates, as shown in Fig. 10. Indeed, earlier results suggested that the transition state ensemble lacks all five long-range tertiary contacts and the current results suggest that it lacks P3. Together, these contacts represent nearly all of the structure that is observed to form during Mg2+-induced folding.
Thus, the results are consistent with a model in which P3 is required to form early, and if it does not form early, the structure that forms subsequently is required to unfold, regenerating the set of intermediates from which the error occurred. A minor fraction of the population achieves this ‘backtracking’ during folding from the intermediate Itrap and therefore avoids the M state (10%, refs. 31, 32), while most of the population continues folding to the more stable M state and must then backtrack more extensively to ultimately reach the native state. This ‘backtracking’ behavior would share key features with an earlier model in which correct and incorrect folding pathways were proposed to diverge exclusively from unfolded conformations.9 Here, rather than the position of the branchpoint relative to the overall folding process, we emphasize the ordered folding; i.e. a misfolded intermediate unfolds sufficiently to return to a defined branchpoint, wherever it may lie within the overall folding pathway. Conceptually, ordered folding is consistent with folding energy landscapes, particularly those that include channels, with misfolded intermediates as ‘dead-ends’ that must be resolved by backing up through the channel to a branchpoint.34, 49 At the physical level, ordered folding may arise for large RNAs if peripheral structure is built progressively around a central core, because an error in the core can only be corrected if the periphery unfolds transiently to allow rearrangements within the core. Ordered folding may also be present for RNP complexes, with the ordered steps including protein assembly steps. For example, early folding steps of the small ribosomal subunit rRNA are proposed to allow binding of certain ribosomal proteins, and these associations then allow additional RNA folding steps.50–54 Thus, at least key folding and assembly steps proceed in a defined order. A corollary of this model is that when one of these events happens in the wrong order, backtracking may be required to correct it.
On the other hand, not all RNA misfolded structures are expected to display this behavior. An example is the alternative helix P(−1), which can form between the 5′ splice site of the Tetrahymena intron and a sequence upstream of it, blocking P1 formation.18 Because P(−1) is separate from the core intron structure and there is no indication that it is stabilized by intronic structure, there is no expectation that resolving P(−1) would require disruption of the intron structure. Thus, refolding of misfolded structures like P(−1) could occur equally well early or late in folding.
The observation of ordered folding leads to the question of whether there are features in vivo that influence this behavior. Co-transcriptional folding is highly likely to change the order of contact formation because some contacts can form before other contact-forming regions are synthesized, and this may be important for avoiding the incorrect orders and the formation of trapped intermediates.55–57 However, there is no expectation for co-transcriptional folding to influence the degree to which a certain order is required. It is possible that chaperone proteins can decrease the requirement for ordered contact formation by disrupting local structures that are otherwise long-lived, thereby allowing additional folding or refolding pathways to become viable.14, 16, 58–60 Nevertheless, much of the requirement for ordered folding may arise from the basic structural and architectural features of RNA, and the main function of chaperones may be to generate local unfolding, providing additional opportunities for higher-order folding steps to proceed in the correct order.
Materials and Methods
Materials
The L-21/ScaI Tetrahymena ribozyme was purified using Qiagen RNeasy columns as described.61 The oligonucleotide substrate (CCCUCUA5, rSA5) (Dharmacon, Lafayette, CO) was 5′-end-labeled with [γ-32P] ATP using T4 polynucleotide kinase and purified by non-denaturing polyacrylamide gel electrophoresis as described.62 RNA concentrations were determined spectrophotometrically using the following extinction coefficients: wild-type and mutant ribozymes, 3.9 × 10⁶ M−1 cm−1; rSA5, 1.09 × 10⁵ M−1 cm−1.
In-line probing
Ribozymes were 5′-end-labeled with [γ-32P] ATP using T4 polynucleotide kinase or 3′-end-labeled with [α-32P] dATP and were purified by non-denaturing polyacrylamide gel electrophoresis as described.62, 63 Wild-type ribozyme (100 nM with a trace concentration of 3′- or 5′-32P-labeled ribozyme) was incubated in 10 mM MgCl2 (50 mM Na-MOPS, pH 7.0) for 15 min at 25 °C to generate misfolded ribozyme or for 45–60 min at 50 °C to generate native ribozyme. Analogous reactions were performed with 5′-end-labeled C98U and U101A mutants. Additional MgCl2 was added to a total concentration of 100 mM to reduce refolding during the in-line probing incubation (40–100 hr at 25 °C).31 The extent of backbone cleavage was measured by using an 8% denaturing polyacrylamide gel (7 M urea, 70 mM tris-HCl, 20 mM taurine, 0.4 mM EDTA). Size marker lanes were 5′-radiolabeled ribozyme digested with ribonuclease T1 (15 min at 37 °C, 1 mM Na-citrate, pH 8.2) or subjected to partial alkaline hydrolysis (5 min at 95 °C, 50 mM NaHCO3/Na2CO3, 1 mM EDTA, pH 9.2). Intensity values were normalized by the average intensity of all cleaved positions.
Measurement of substrate cleavage
P3-weakening mutant ribozymes were incubated in 50 mM Na-MOPS, pH 7.0, 1 mM guanosine, and 50 mM MgCl2 for 40 min at 50 °C to fold the ribozymes to the native state. Ribozymes were transferred to 25 °C and substrate was added to initiate the cleavage reaction. P3-strengthening mutant ribozymes in identical solution conditions as above were incubated for 75 min at 50 °C to fold the ribozymes to the native state. Aliquots were removed from the cleavage reaction at various times and further catalytic activity was quenched by addition of formamide and EDTA. Radiolabeled product (CCCUCU) was separated from uncleaved substrate on a 7 M urea/20% denaturing polyacrylamide gel.
Measuring formation of the native state
Refolding from the misfolded state was measured for the wild-type ribozyme, the P3-weakening mutants, and the U101A mutant by incubating the ribozymes with 10 mM MgCl2 for 10–20 min at 25 °C (50 mM Na-MOPS, pH 7.0) to generate misfolded ribozyme (50% to 90% of the population, depending on the ribozyme). The ribozymes were transferred to 37 °C to measure the rate of refolding to the native state. In some experiments, the Mg2+ concentration was changed at this stage. At various times, aliquots were removed and further refolding was inhibited by adding 50 mM MgCl2 at 25 °C. The fraction of native ribozyme was determined by catalytic activity as described.31, 33, 37 Free energy differences between the mutants and the wild-type ribozyme (ΔΔG‡) were calculated from the refolding rate constants using equation (1):
| (1) |
For the other P3-strengthening mutants, refolding was monitored by incubating the ribozymes in 10 mM MgCl2 (50 mM Na-MOPS, pH 7.0) to generate a small population of misfolded ribozyme (see Results). The Na+ concentration was increased by adding the indicated amount of NaCl and the temperature was shifted to 37 °C for U273A and U273G, or to 50 °C for U101C:U273G. At various times, aliquots were removed, the Na+ concentration was decreased ~10-fold by dilution, and further refolding was inhibited by the addition of 50 mM MgCl2 at 25 °C. The fraction of native ribozyme was determined as above.
Measuring loss of commitment for native folding
Native ribozyme was generated by incubation at 50 °C for 45–60 min in 10 mM MgCl2 (50 mM Na-MOPS, pH 7.0). For P3-strengthening mutants, the temperature was shifted to 0 °C and unfolding was initiated by the addition of 15 mM EDTA (50 mM Na-MOPS, pH 7.0). For the P3-weakening mutants, 50 mM NaCl was added simultaneously with 15 mM EDTA. At various times, aliquots were transferred into two volumes of 50 mM MgCl2 (50 mM Na-MOPS, pH 7.0), followed by incubation at 25 °C for 4 min to allow folding to the native and misfolded states. When necessary, reactions were stored briefly at 0 °C after the folding incubation, and then the fraction of native ribozyme was determined by catalytic activity as above. Free energy changes between the mutants and the wild-type ribozyme (ΔΔG‡) were calculated using eq. 1.
Small-angle X-ray scattering
Measurements were performed at the Advanced Photon Source beamline 12-ID-C, using a sample-detector distance of 2 m and 1 s exposure time (12 keV) at a sample concentration of 1 μM. Static measurements were performed with 20× 1 s exposures that were averaged. Time-resolved measurements were performed using a custom-built, remotely controlled syringe-pump based mixing device, with a dead time of 0.5 – 1 s. The temperature was maintained at 2 °C or 25 °C to mimic activity measurements. Long (3 h) time points were measured as static samples after incubation on ice in the laboratory. SAXS data were circularly averaged and analyzed using Igor Pro (WaveMetrics). Radius of gyration (Rg) values were estimated using the pair distribution function P(r) and the Guinier approximation.47
Supplementary Material
Acknowledgments
We thank Dan Herschlag and members of the Russell lab for helpful comments on the manuscript. This work was supported by grants to R.R. from the NIH (GM070456) and the Welch Foundation (F-1563). D.M was supported by NIH Award F31GM084692.
Abbreviations used
- DMS
dimethyl sulfate
- EDTA
ethylenediaminetetraacetic acid
- IGS
internal guide sequence
- Rg
radius of gyration
- SAXS
small angle X-ray scattering
Footnotes
Publisher's Disclaimer: This is a PDF file of an unedited manuscript that has been accepted for publication. As a service to our customers we are providing this early version of the manuscript. The manuscript will undergo copyediting, typesetting, and review of the resulting proof before it is published in its final citable form. Please note that during the production process errors may be discovered which could affect the content, and all legal disclaimers that apply to the journal pertain.
References
- 1.Brion P, Westhof E. Hierarchy and dynamics of RNA folding. Annu Rev Biophys Biomol Struct. 1997;26:113–37. doi: 10.1146/annurev.biophys.26.1.113. [DOI] [PubMed] [Google Scholar]
- 2.Tinoco I, Jr, Bustamante C. How RNA folds. J Mol Biol. 1999;293:271–81. doi: 10.1006/jmbi.1999.3001. [DOI] [PubMed] [Google Scholar]
- 3.Russell R, Millett IS, Tate MW, Kwok LW, Nakatani B, Gruner SM, Mochrie SG, Pande V, Doniach S, Herschlag D, Pollack L. Rapid compaction during RNA folding. Proc Natl Acad Sci U S A. 2002;99:4266–71. doi: 10.1073/pnas.072589599. [DOI] [PMC free article] [PubMed] [Google Scholar]
- 4.Weeks KM. Protein-facilitated RNA folding. Curr Opin Struct Biol. 1997;7:336–42. doi: 10.1016/s0959-440x(97)80048-6. [DOI] [PubMed] [Google Scholar]
- 5.Adams A, Lindahl T, Fresco JR. Conformational differences between the biologically active and inactive forms of a transfer ribonucleic acid. Proc Natl Acad Sci U S A. 1967;57:1684–91. doi: 10.1073/pnas.57.6.1684. [DOI] [PMC free article] [PubMed] [Google Scholar]
- 6.Gartland WJ, Sueoka N. Two interconvertible forms of tryptophanyl sRNA in E. coli. Proc Natl Acad Sci U S A. 1966;55:948–56. doi: 10.1073/pnas.55.4.948. [DOI] [PMC free article] [PubMed] [Google Scholar]
- 7.Ishida T, Sueoka N. Effect of ambient conditions on conformations of tryptophan transfer ribonucleic acid of Escherichia coli. J Biol Chem. 1968;243:5329–36. [PubMed] [Google Scholar]
- 8.Lindahl T, Adams A, Fresco JR. Renaturation of transfer ribonucleic acids through site binding of magnesium. Proc Natl Acad Sci U S A. 1966;55:941–8. doi: 10.1073/pnas.55.4.941. [DOI] [PMC free article] [PubMed] [Google Scholar]
- 9.Pan J, Thirumalai D, Woodson SA. Folding of RNA involves parallel pathways. J Mol Biol. 1997;273:7–13. doi: 10.1006/jmbi.1997.1311. [DOI] [PubMed] [Google Scholar]
- 10.Russell R, Herschlag D. New pathways in folding of the Tetrahymena group I RNA enzyme. J Mol Biol. 1999;291:1155–67. doi: 10.1006/jmbi.1999.3026. [DOI] [PubMed] [Google Scholar]
- 11.Treiber DK, Rook MS, Zarrinkar PP, Williamson JR. Kinetic intermediates trapped by native interactions in RNA folding. Science. 1998;279:1943–6. doi: 10.1126/science.279.5358.1943. [DOI] [PubMed] [Google Scholar]
- 12.Treiber DK, Williamson JR. Exposing the kinetic traps in RNA folding. Curr Opin Struct Biol. 1999;9:339–45. doi: 10.1016/S0959-440X(99)80045-1. [DOI] [PubMed] [Google Scholar]
- 13.Walstrum SA, Uhlenbeck OC. The self-splicing RNA of Tetrahymena is trapped in a less active conformation by gel purification. Biochemistry. 1990;29:10573–6. doi: 10.1021/bi00498a022. [DOI] [PubMed] [Google Scholar]
- 14.Russell R. RNA misfolding and the action of chaperones. Front Biosci. 2008;13:1–20. doi: 10.2741/2557. [DOI] [PMC free article] [PubMed] [Google Scholar]
- 15.Thirumalai D, Woodson SA. Maximizing RNA folding rates: a balancing act. RNA. 2000;6:790–4. doi: 10.1017/s1355838200000522. [DOI] [PMC free article] [PubMed] [Google Scholar]
- 16.Herschlag D. RNA chaperones and the RNA folding problem. J Biol Chem. 1995;270:20871–4. doi: 10.1074/jbc.270.36.20871. [DOI] [PubMed] [Google Scholar]
- 17.Downs WD, Cech TR. An ultraviolet-inducible adenosine-adenosine cross-link reflects the catalytic structure of the Tetrahymena ribozyme. Biochemistry. 1990;29:5605–13. doi: 10.1021/bi00475a027. [DOI] [PubMed] [Google Scholar]
- 18.Woodson SA, Cech TR. Alternative secondary structures in the 5′ exon affect both forward and reverse self-splicing of the Tetrahymena intervening sequence RNA. Biochemistry. 1991;30:2042–50. doi: 10.1021/bi00222a006. [DOI] [PubMed] [Google Scholar]
- 19.Woodson SA, Emerick VL. An alternative helix in the 26S rRNA promotes excision and integration of the Tetrahymena intervening sequence. Mol Cell Biol. 1993;13:1137–45. doi: 10.1128/mcb.13.2.1137. [DOI] [PMC free article] [PubMed] [Google Scholar]
- 20.Zarrinkar PP, Williamson JR. Kinetic intermediates in RNA folding. Science. 1994;265:918–24. doi: 10.1126/science.8052848. [DOI] [PubMed] [Google Scholar]
- 21.Downs WD, Cech TR. Kinetic pathway for folding of the Tetrahymena ribozyme revealed by three UV-inducible crosslinks. RNA. 1996;2:718–32. [PMC free article] [PubMed] [Google Scholar]
- 22.Kwok LW, Shcherbakova I, Lamb JS, Park HY, Andresen K, Smith H, Brenowitz M, Pollack L. Concordant exploration of the kinetics of RNA folding from global and local perspectives. J Mol Biol. 2006;355:282–93. doi: 10.1016/j.jmb.2005.10.070. [DOI] [PubMed] [Google Scholar]
- 23.Shcherbakova I, Brenowitz M. Perturbation of the hierarchical folding of a large RNA by the destabilization of its Scaffold’s tertiary structure. J Mol Biol. 2005;354:483–96. doi: 10.1016/j.jmb.2005.09.032. [DOI] [PubMed] [Google Scholar]
- 24.Shcherbakova I, Mitra S, Laederach A, Brenowitz M. Energy barriers, pathways, and dynamics during folding of large, multidomain RNAs. Curr Opin Chem Biol. 2008;12:655–66. doi: 10.1016/j.cbpa.2008.09.017. [DOI] [PMC free article] [PubMed] [Google Scholar]
- 25.Sclavi B, Sullivan M, Chance MR, Brenowitz M, Woodson SA. RNA folding at millisecond intervals by synchrotron hydroxyl radical footprinting. Science. 1998;279:1940–3. doi: 10.1126/science.279.5358.1940. [DOI] [PubMed] [Google Scholar]
- 26.Sclavi B, Woodson S, Sullivan M, Chance MR, Brenowitz M. Time-resolved synchrotron X-ray “footprinting”, a new approach to the study of nucleic acid structure and function: application to protein-DNA interactions and RNA folding. J Mol Biol. 1997;266:144–59. doi: 10.1006/jmbi.1996.0775. [DOI] [PubMed] [Google Scholar]
- 27.Shcherbakova I, Gupta S, Chance MR, Brenowitz M. Monovalent ion-mediated folding of the Tetrahymena thermophila ribozyme. J Mol Biol. 2004;342:1431–42. doi: 10.1016/j.jmb.2004.07.092. [DOI] [PubMed] [Google Scholar]
- 28.Das R, Kwok LW, Millett IS, Bai Y, Mills TT, Jacob J, Maskel GS, Seifert S, Mochrie SG, Thiyagarajan P, Doniach S, Pollack L, Herschlag D. The fastest global events in RNA folding: electrostatic relaxation and tertiary collapse of the Tetrahymena ribozyme. J Mol Biol. 2003;332:311–9. doi: 10.1016/s0022-2836(03)00854-4. [DOI] [PubMed] [Google Scholar]
- 29.Pan J, Woodson SA. Folding intermediates of a self-splicing RNA: mispairing of the catalytic core. J Mol Biol. 1998;280:597–609. doi: 10.1006/jmbi.1998.1901. [DOI] [PubMed] [Google Scholar]
- 30.Pan J, Deras ML, Woodson SA. Fast folding of a ribozyme by stabilizing core interactions: evidence for multiple folding pathways in RNA. J Mol Biol. 2000;296:133–44. doi: 10.1006/jmbi.1999.3439. [DOI] [PubMed] [Google Scholar]
- 31.Russell R, Herschlag D. Probing the folding landscape of the Tetrahymena ribozyme: commitment to form the native conformation is late in the folding pathway. J Mol Biol. 2001;308:839–51. doi: 10.1006/jmbi.2001.4751. [DOI] [PubMed] [Google Scholar]
- 32.Wan Y, Suh H, Russell R, Herschlag D. Multiple unfolding events during native folding of the Tetrahymena group I ribozyme. J Mol Biol. 2010;400:1067–77. doi: 10.1016/j.jmb.2010.06.010. [DOI] [PMC free article] [PubMed] [Google Scholar]
- 33.Russell R, Das R, Suh H, Travers KJ, Laederach A, Engelhardt MA, Herschlag D. The paradoxical behavior of a highly structured misfolded intermediate in RNA folding. J Mol Biol. 2006;363:531–44. doi: 10.1016/j.jmb.2006.08.024. [DOI] [PubMed] [Google Scholar]
- 34.Russell R, Zhuang X, Babcock HP, Millett IS, Doniach S, Chu S, Herschlag D. Exploring the folding landscape of a structured RNA. Proc Natl Acad Sci U S A. 2002;99:155–60. doi: 10.1073/pnas.221593598. [DOI] [PMC free article] [PubMed] [Google Scholar]
- 35.Russell R, Millett IS, Doniach S, Herschlag D. Small angle X-ray scattering reveals a compact intermediate in RNA folding. Nat Struct Biol. 2000;7:367–70. doi: 10.1038/75132. [DOI] [PubMed] [Google Scholar]
- 36.Cannone JJ, Subramanian S, Schnare MN, Collett JR, D’Souza LM, Du Y, Feng B, Lin N, Madabusi LV, Muller KM, Pande N, Shang Z, Yu N, Gutell RR. The comparative RNA web (CRW) site: an online database of comparative sequence and structure information for ribosomal, intron, and other RNAs. BMC Bioinformatics. 2002;3:2. doi: 10.1186/1471-2105-3-2. [DOI] [PMC free article] [PubMed] [Google Scholar]
- 37.Wan Y, Mitchell D, 3rd, Russell R. Catalytic activity as a probe of native RNA folding. Methods Enzymol. 2009;468:195–218. doi: 10.1016/S0076-6879(09)68010-1. [DOI] [PMC free article] [PubMed] [Google Scholar]
- 38.Winkler W, Nahvi A, Breaker RR. Thiamine derivatives bind messenger RNAs directly to regulate bacterial gene expression. Nature. 2002;419:952–6. doi: 10.1038/nature01145. [DOI] [PubMed] [Google Scholar]
- 39.Regulski EE, Breaker RR. In-line probing analysis of riboswitches. Methods Mol Biol. 2008;419:53–67. doi: 10.1007/978-1-59745-033-1_4. [DOI] [PubMed] [Google Scholar]
- 40.Johnson TH, Tijerina P, Chadee AB, Herschlag D, Russell R. Structural specificity conferred by a group I RNA peripheral element. Proc Natl Acad Sci U S A. 2005;102:10176–81. doi: 10.1073/pnas.0501498102. [DOI] [PMC free article] [PubMed] [Google Scholar]
- 41.Xia T, SantaLucia J, Jr, Burkard ME, Kierzek R, Schroeder SJ, Jiao X, Cox C, Turner DH. Thermodynamic parameters for an expanded nearest-neighbor model for formation of RNA duplexes with Watson-Crick base pairs. Biochemistry. 1998;37:14719–35. doi: 10.1021/bi9809425. [DOI] [PubMed] [Google Scholar]
- 42.Davis AR, Znosko BM. Thermodynamic characterization of single mismatches found in naturally occurring RNA. Biochemistry. 2007;46:13425–36. doi: 10.1021/bi701311c. [DOI] [PubMed] [Google Scholar]
- 43.Freier SM, Kierzek R, Jaeger JA, Sugimoto N, Caruthers MH, Neilson T, Turner DH. Improved free-energy parameters for predictions of RNA duplex stability. Proc Natl Acad Sci U S A. 1986;83:9373–7. doi: 10.1073/pnas.83.24.9373. [DOI] [PMC free article] [PubMed] [Google Scholar]
- 44.Serra MJ, Turner DH. Predicting thermodynamic properties of RNA. Methods Enzymol. 1995;259:242–61. doi: 10.1016/0076-6879(95)59047-1. [DOI] [PubMed] [Google Scholar]
- 45.Mathews DH, Sabina J, Zuker M, Turner DH. Expanded sequence dependence of thermodynamic parameters improves prediction of RNA secondary structure. J Mol Biol. 1999;288:911–40. doi: 10.1006/jmbi.1999.2700. [DOI] [PubMed] [Google Scholar]
- 46.Woodside MT, Anthony PC, Behnke-Parks WM, Larizadeh K, Herschlag D, Block SM. Direct measurement of the full, sequence-dependent folding landscape of a nucleic acid. Science. 2006;314:1001–4. doi: 10.1126/science.1133601. [DOI] [PMC free article] [PubMed] [Google Scholar]
- 47.Doniach S. Changes in biomolecular conformation seen by small angle X-ray scattering. Chem Rev. 2001;101:1763–78. doi: 10.1021/cr990071k. [DOI] [PubMed] [Google Scholar]
- 48.Golden BL, Gooding AR, Podell ER, Cech TR. A preorganized active site in the crystal structure of the Tetrahymena ribozyme. Science. 1998;282:259–64. doi: 10.1126/science.282.5387.259. [DOI] [PubMed] [Google Scholar]
- 49.Laederach A, Shcherbakova I, Jonikas MA, Altman RB, Brenowitz M. Distinct contribution of electrostatics, initial conformational ensemble, and macromolecular stability in RNA folding. Proc Natl Acad Sci U S A. 2007;104:7045–50. doi: 10.1073/pnas.0608765104. [DOI] [PMC free article] [PubMed] [Google Scholar]
- 50.Batey RT, Williamson JR. Effects of polyvalent cations on the folding of an rRNA three-way junction and binding of ribosomal protein S15. RNA. 1998;4:984–97. doi: 10.1017/s1355838298980426. [DOI] [PMC free article] [PubMed] [Google Scholar]
- 51.Ramaswamy P, Woodson SA. Global stabilization of rRNA structure by ribosomal proteins S4, S17, and S20. J Mol Biol. 2009;392:666–77. doi: 10.1016/j.jmb.2009.07.032. [DOI] [PMC free article] [PubMed] [Google Scholar]
- 52.Bunner AE, Beck AH, Williamson JR. Kinetic cooperativity in Escherichia coli 30S ribosomal subunit reconstitution reveals additional complexity in the assembly landscape. Proc Natl Acad Sci U S A. 2010;107:5417–22. doi: 10.1073/pnas.0912007107. [DOI] [PMC free article] [PubMed] [Google Scholar]
- 53.Jagannathan I, Culver GM. Assembly of the central domain of the 30S ribosomal subunit: roles for the primary binding ribosomal proteins S15 and S8. J Mol Biol. 2003;330:373–83. doi: 10.1016/s0022-2836(03)00586-2. [DOI] [PubMed] [Google Scholar]
- 54.Shajani Z, Sykes MT, Williamson JR. Assembly of bacterial ribosomes. Annu Rev Biochem. 80:501–26. doi: 10.1146/annurev-biochem-062608-160432. [DOI] [PubMed] [Google Scholar]
- 55.Zemora G, Waldsich C. RNA folding in living cells. RNA Biol. 2010;7:634–41. doi: 10.4161/rna.7.6.13554. [DOI] [PMC free article] [PubMed] [Google Scholar]
- 56.Wong TN, Sosnick TR, Pan T. Folding of noncoding RNAs during transcription facilitated by pausing-induced nonnative structures. Proc Natl Acad Sci U S A. 2007;104:17995–8000. doi: 10.1073/pnas.0705038104. [DOI] [PMC free article] [PubMed] [Google Scholar]
- 57.Pan T, Sosnick T. RNA folding during transcription. Annu Rev Biophys Biomol Struct. 2006;35:161–75. doi: 10.1146/annurev.biophys.35.040405.102053. [DOI] [PubMed] [Google Scholar]
- 58.Russell R, Jarmoskaite I, Lambowitz AM. Toward a molecular understanding of RNA remodeling by DEAD-box proteins. RNA Biol. 2013;10:1–12. doi: 10.4161/rna.22210. [DOI] [PMC free article] [PubMed] [Google Scholar]
- 59.Woodson SA. Taming free energy landscapes with RNA chaperones. RNA Biol. 2010;7:677–86. doi: 10.4161/rna.7.6.13615. [DOI] [PMC free article] [PubMed] [Google Scholar]
- 60.Rajkowitsch L, Chen D, Stampfl S, Semrad K, Waldsich C, Mayer O, Jantsch MF, Konrat R, Blasi U, Schroeder R. RNA chaperones, RNA annealers and RNA helicases. RNA Biol. 2007;4:118–30. doi: 10.4161/rna.4.3.5445. [DOI] [PubMed] [Google Scholar]
- 61.Russell R, Herschlag D. Specificity from steric restrictions in the guanosine binding pocket of a group I ribozyme. RNA. 1999;5:158–66. doi: 10.1017/s1355838299981839. [DOI] [PMC free article] [PubMed] [Google Scholar]
- 62.Zaug AJ, Grosshans CA, Cech TR. Sequence-specific endoribonuclease activity of the Tetrahymena ribozyme: enhanced cleavage of certain oligonucleotide substrates that form mismatched ribozyme-substrate complexes. Biochemistry. 1988;27:8924–31. doi: 10.1021/bi00425a008. [DOI] [PubMed] [Google Scholar]
- 63.Huang Z, Szostak JW. A simple method for 3′-labeling of RNA. Nucleic Acids Res. 1996;24:4360–1. doi: 10.1093/nar/24.21.4360. [DOI] [PMC free article] [PubMed] [Google Scholar]
- 64.Lehnert V, Jaeger L, Michel F, Westhof E. New loop-loop tertiary interactions in self-splicing introns of subgroup IC and ID: a complete 3D model of the Tetrahymena thermophila ribozyme. Chem Biol. 1996;3:993–1009. doi: 10.1016/s1074-5521(96)90166-0. [DOI] [PubMed] [Google Scholar]
Associated Data
This section collects any data citations, data availability statements, or supplementary materials included in this article.