

Abstract
Background
Overdiagnosis in breast cancer screening is a controversial topic. One difficulty in estimation of overdiagnosis is the separation of overdiagnosis from lead time that is the advance in the time of diagnosis of cancers, which confers an artificial increase in incidence when a screening programme is introduced.
Methods
We postulated a female population aged 50-79 with a similar age structure and age-specific breast cancer incidence as in England and Wales before the screening programme. We then imposed a two-yearly screening programme; screening women aged 50-69, to run for twenty years, with exponentially distributed lead time with an average of 40 months in screen-detected cancers. We imposed no effect of the screening on incidence other than lead time.
Results
Comparison of age- and time-specific incidence between the screened and unscreened populations showed a major effect of lead time, which could only be adjusted for by follow-up for more than two decades and including ten years after the last screen. From lead time alone, twenty-year observation at ages 50-69 would confer an observed excess incidence of 37%. The excess would only fall below 10% with 25 years or more follow-up. For the excess to be nullified, we would require 30 year follow-up including observation up to 10 years above the upper age limit for screening.
Conclusion
Studies using shorter observation periods will overestimate overdiagnosis by inclusion of cancers diagnosed early due to lead time among the nominally overdiagnosed tumours.
Introduction
The issue of overdiagnosis in breast cancer screening is a topic of much interest and controversy [1-3]. Overdiagnosis is usually defined as the diagnosis as a result of screening of cancer that would never have been diagnosed in the woman's life in the absence of screening [1]. In theory, overdiagnosis can be estimated by comparison of incidence in a randomized trial of screening, but this would require that the control group was never screened and that both intervention and control groups were followed up to expiry or for more than at least two decades. In practice, none of the trials satisfy both of these criteria [4]. Consequently, overdiagnosis rates are usually estimated on the basis of changes in breast cancer incidence following the introduction of screening services in a population setting [1-3,5,6]. There is no uniform method of estimation, and, consequently, estimates vary considerably, from less than 5% to around 50% [1].
One of the first observable effects of breast screening is the capability to diagnose cancer before it would have occurred symptomatically, since screening works by diagnosing breast cancer at an earlier and more treatable stage [7]. The temporal advance in the time of diagnosis is known as the lead time. A major complication of estimating overdiagnosis is taking account of lead time to disentangle overdiagnosed from early-diagnosed cases [1]. Overdiagnosis can be thought of as cases whose lead time exceeds their remaining years of life. Cases whose lead time does not exceed their future lifetime will cause an increase in incidence to be observed but should not be included in the estimation of overdiagnosis. There is disagreement about the importance of lead time [8,9], but there is no doubt that the phenomenon exists, since incidence of breast cancer after a screen is considerably lower than in the absence of screening, indicating that many tumors have their period of diagnosis advanced [10].
In this article, we generate a set of breast cancer incidence figures, by individual year of age and individual calendar year, in the absence of screening. These are based approximately on the population of age 50 to 79 and the age-specific incidence of breast cancer in the late 1980s in the UK, just before the screening program started. We then generate the effect on occurrence of breast cancer of a 2-yearly screening program from age 50 to 69, assuming only lead time and no overdiagnosis. We use the difference between the two to evaluate the reliability of different strategies for adjusting for lead time in estimation of overdiagnosis.
Materials and methods
We postulated a population of age 50 to 79 and of size and structure similar to those prevailing in the female population in England and Wales in the late 1980s [11,12]. We further postulated that invasive breast cancer incidence rates in the absence of screening would increase from 158.4 per 100,000 person-years at age 50 to 272.7 per 100,000 at age 79, again corresponding roughly to those prevailing in England and Wales in the years immediately prior to the screening program [11,12]. The population, incidence rates, and numbers of cases are shown by individual year of age in Table 1. For simplicity, we assumed that in the absence of screening, the population age structure and age-specific breast cancer incidence rates remain stable for the following 30 years. Thus, the same number of cases in each individual year of age occurred for the following 30 years.
Table 1.
Postulated incidence of breast cancer by individual year of age in the absence of screening
| Age, years | Population | Incidence, per 100,000 | Number of cases |
|---|---|---|---|
| 50 | 253,157 | 158.4 | 401 |
| 51 | 252,774 | 162.2 | 410 |
| 52 | 253,012 | 166.0 | 420 |
| 53 | 253,239 | 169.8 | 430 |
| 54 | 253,026 | 173.5 | 439 |
| 55 | 262,267 | 177.3 | 465 |
| 56 | 261,879 | 181.0 | 474 |
| 57 | 261,905 | 184.8 | 484 |
| 58 | 261,780 | 191.0 | 500 |
| 59 | 262,170 | 197.2 | 517 |
| 60 | 275,947 | 203.3 | 561 |
| 61 | 275,895 | 209.5 | 578 |
| 62 | 275,846 | 215.7 | 595 |
| 63 | 276,020 | 218.1 | 602 |
| 64 | 276,191 | 220.5 | 609 |
| 65 | 231,943 | 222.9 | 517 |
| 66 | 232,135 | 225.3 | 523 |
| 67 | 231,884 | 227.7 | 528 |
| 68 | 232,059 | 232.7 | 540 |
| 69 | 231,805 | 237.7 | 551 |
| 70 | 231,974 | 242.7 | 563 |
| 71 | 232,136 | 247.7 | 575 |
| 72 | 231,896 | 252.7 | 586 |
| 73 | 232,003 | 255.6 | 593 |
| 74 | 231,811 | 258.4 | 599 |
| 75 | 189,820 | 261.3 | 496 |
| 76 | 190,080 | 264.1 | 502 |
| 77 | 189,888 | 267.0 | 507 |
| 78 | 190,070 | 269.9 | 513 |
| 79 | 189,952 | 272.7 | 518 |
We then assumed the introduction of a screening program with 2-yearly screening applied to all women currently 50 to 69 years old, at years 1, 3, 5, and so on up to year 19 (that is, 10 rounds of screening in all). We assumed that the only effect of screening on incidence of breast cancer was one of lead time. We postulated that in screening a population age x in year y we would find 86% of the cancers which would have occurred in age x+1, year y+1, 64% of tumors which would have occurred in age x+2, year y+2, and so on up to 7% of the tumors from age x+10, y+11, as shown in Table 2. These figures correspond to an average lead time of around 40 months, which is consistent with the estimates for this age group [13-16], most of which also found screening sensitivities of close to 100%. For mathematical details, see the Appendix.
Table 2.
Proportion of cancers with time of diagnosis advanced to the year of screening, by year*
| Years after screen | Percentage of diagnoses advanced to screen year |
|---|---|
| 1 | 86 |
| 2 | 64 |
| 3 | 48 |
| 4 | 35 |
| 5 | 26 |
| 6 | 20 |
| 7 | 15 |
| 8 | 11 |
| 9 | 9 |
| 10 | 7 |
By year at which diagnosis would have taken place in the absence of screening
We then compared the numbers of cancers between the screening and no-screening scenarios, for different age groups and periods of observation, to estimate the excess incidence that would be observed as a result of lead time alone and to evaluate the likely efficacy of various methods of taking account of lead time. We also calculated the resulting estimates for different strategies used in the past to take lead time into account. These include considering incidence up to 5 and 10 years after the upper age limit for screening and comparing breast cancer incidence in the screened population with the corresponding incidence of subjects in the unscreened population who are 2 to 5 years older [5,6]. This was solely a modeling study that involved no experimental work on human or animal subjects. No ethical approval or consent was required.
Results
Table 3 shows the numbers of cancers diagnosed over 30 years, by calendar year and year of age, under the scenario of 2-yearly screening of women 50 to 69 years old for 10 rounds (the first 20 years) as described above. The corresponding numbers of cancers in the absence of screening would simply be the column of cancers in Table 1, 401, 410, and so on, repeated 30 times. The lead-time effect can be seen for age 50, year 1, for example, as
Table 3.
Numbers of tumors diagnosed by age and year in a 2-yearly screening program
| Age, years | Calendar year | |||||||||||||||||||||||||||||
|---|---|---|---|---|---|---|---|---|---|---|---|---|---|---|---|---|---|---|---|---|---|---|---|---|---|---|---|---|---|---|
| 1 | 2 | 3 | 4 | 5 | 6 | 7 | 8 | 9 | 10 | 11 | 12 | 13 | 14 | 15 | 16 | 17 | 18 | 19 | 20 | 21 | 22 | 23 | 24 | 25 | 26 | 27 | 28 | 29 | 30 | |
| 50 | 1,812 | 401 | 1,812 | 401 | 1,812 | 401 | 1,812 | 401 | 1,812 | 401 | 1,812 | 401 | 1,812 | 401 | 1,812 | 401 | 1,812 | 401 | 1,812 | 401 | 401 | 401 | 401 | 401 | 401 | 401 | 401 | 401 | 401 | 401 |
| 51 | 1,863 | 57 | 1,863 | 57 | 1,863 | 57 | 1,863 | 57 | 1,863 | 57 | 1,863 | 57 | 1,863 | 57 | 1,863 | 57 | 1,863 | 57 | 1,863 | 57 | 410 | 410 | 410 | 410 | 410 | 410 | 410 | 410 | 410 | 410 |
| 52 | 1,919 | 59 | 1,242 | 59 | 1,242 | 59 | 1,242 | 59 | 1,242 | 59 | 1,242 | 59 | 1,242 | 59 | 1,242 | 59 | 1,242 | 59 | 1,242 | 59 | 151 | 420 | 420 | 420 | 420 | 420 | 420 | 420 | 420 | 420 |
| 53 | 1,979 | 60 | 1,282 | 31 | 1,282 | 31 | 1,282 | 31 | 1,282 | 31 | 1,282 | 31 | 1,282 | 31 | 1,282 | 31 | 1,282 | 31 | 1,282 | 31 | 155 | 224 | 430 | 430 | 430 | 430 | 430 | 430 | 430 | 430 |
| 54 | 2,045 | 61 | 1,326 | 32 | 1,119 | 32 | 1,119 | 32 | 1,119 | 32 | 1,119 | 32 | 1,119 | 32 | 1,119 | 32 | 1,119 | 32 | 1,119 | 32 | 103 | 228 | 285 | 439 | 439 | 439 | 439 | 439 | 439 | 439 |
| 55 | 2,111 | 65 | 1,364 | 34 | 1,149 | 25 | 1,149 | 25 | 1,149 | 25 | 1,149 | 25 | 1,149 | 25 | 1,149 | 25 | 1,149 | 25 | 1,149 | 25 | 109 | 179 | 302 | 344 | 465 | 465 | 465 | 465 | 465 | 465 |
| 56 | 2,164 | 66 | 1,397 | 35 | 1,176 | 26 | 1,087 | 26 | 1,087 | 26 | 1,087 | 26 | 1,087 | 26 | 1,087 | 26 | 1,087 | 26 | 1,087 | 26 | 89 | 182 | 246 | 351 | 379 | 474 | 474 | 474 | 474 | 474 |
| 57 | 2,224 | 68 | 1,433 | 35 | 1,204 | 26 | 1,112 | 22 | 1,112 | 22 | 1,112 | 22 | 1,112 | 22 | 1,112 | 22 | 1,112 | 22 | 1,112 | 22 | 91 | 158 | 252 | 304 | 387 | 411 | 484 | 484 | 484 | 484 |
| 58 | 2,288 | 70 | 1,467 | 36 | 1,229 | 27 | 1,133 | 23 | 1,098 | 23 | 1,098 | 23 | 1,098 | 23 | 1,098 | 23 | 1,098 | 23 | 1,098 | 23 | 83 | 164 | 231 | 315 | 356 | 425 | 445 | 500 | 500 | 500 |
| 59 | 2,351 | 72 | 1,497 | 38 | 1,249 | 28 | 1,149 | 24 | 1,113 | 22 | 1,113 | 22 | 1,113 | 22 | 1,113 | 22 | 1,113 | 22 | 1,113 | 22 | 86 | 154 | 239 | 296 | 368 | 400 | 460 | 470 | 517 | 517 |
| 60 | 2,408 | 79 | 1,516 | 41 | 1,261 | 30 | 1,157 | 26 | 1,119 | 23 | 1,112 | 23 | 1,112 | 23 | 1,112 | 23 | 1,112 | 23 | 1,112 | 23 | 87 | 167 | 241 | 321 | 371 | 434 | 464 | 511 | 522 | 561 |
| 61 | 2,422 | 81 | 1,516 | 42 | 1,259 | 31 | 1,155 | 26 | 1,115 | 24 | 1,108 | 24 | 1,108 | 24 | 1,108 | 24 | 1,108 | 24 | 1,108 | 24 | 90 | 172 | 249 | 331 | 383 | 447 | 478 | 526 | 538 | 578 |
| 62 | 2,416 | 83 | 1,505 | 43 | 1,249 | 32 | 1,146 | 27 | 1,105 | 25 | 1,098 | 25 | 1,098 | 25 | 1,098 | 25 | 1,098 | 25 | 1,098 | 25 | 92 | 177 | 256 | 341 | 394 | 460 | 492 | 541 | 553 | 595 |
| 63 | 2,385 | 84 | 1,485 | 44 | 1,234 | 32 | 1,133 | 28 | 1,094 | 25 | 1,087 | 25 | 1,087 | 25 | 1,087 | 25 | 1,087 | 25 | 1,087 | 25 | 93 | 179 | 259 | 345 | 399 | 466 | 498 | 548 | 560 | 602 |
| 64 | 2,333 | 85 | 1,462 | 44 | 1,219 | 33 | 1,122 | 28 | 1,086 | 25 | 1,079 | 25 | 1,079 | 25 | 1,079 | 25 | 1,079 | 25 | 1,079 | 25 | 94 | 181 | 262 | 349 | 403 | 471 | 504 | 554 | 566 | 609 |
| 65 | 2,260 | 72 | 1,442 | 38 | 1,208 | 28 | 1,114 | 24 | 1,079 | 22 | 1,073 | 22 | 1,073 | 22 | 1,073 | 22 | 1,073 | 22 | 1,073 | 22 | 80 | 154 | 223 | 296 | 342 | 400 | 428 | 470 | 481 | 517 |
| 66 | 2,286 | 73 | 1,456 | 38 | 1,218 | 28 | 1,123 | 24 | 1,088 | 22 | 1,081 | 22 | 1,081 | 22 | 1,081 | 22 | 1,081 | 22 | 1,081 | 22 | 81 | 156 | 225 | 299 | 346 | 405 | 433 | 476 | 486 | 523 |
| 67 | 2,313 | 74 | 1,470 | 38 | 1,228 | 28 | 1,131 | 24 | 1,095 | 22 | 1,089 | 22 | 1,089 | 22 | 1,089 | 22 | 1,089 | 22 | 1,089 | 22 | 82 | 157 | 227 | 302 | 350 | 408 | 437 | 480 | 491 | 528 |
| 68 | 2,340 | 76 | 1,482 | 39 | 1,235 | 29 | 1,136 | 25 | 1,099 | 23 | 1,093 | 23 | 1,093 | 23 | 1,093 | 23 | 1,093 | 23 | 1,093 | 23 | 84 | 161 | 232 | 309 | 358 | 418 | 447 | 491 | 502 | 540 |
| 69 | 2,360 | 77 | 1,487 | 40 | 1,237 | 30 | 1,136 | 25 | 1,098 | 23 | 1,092 | 23 | 1,092 | 23 | 1,092 | 23 | 1,092 | 23 | 1,092 | 23 | 85 | 164 | 237 | 315 | 365 | 426 | 456 | 501 | 512 | 551 |
| 70 | 563 | 79 | 203 | 41 | 132 | 30 | 105 | 26 | 94 | 23 | 87 | 23 | 87 | 23 | 87 | 23 | 87 | 23 | 87 | 23 | 87 | 168 | 242 | 322 | 373 | 435 | 466 | 512 | 524 | 563 |
| 71 | 575 | 575 | 207 | 299 | 135 | 221 | 108 | 188 | 96 | 171 | 89 | 171 | 247 | 329 | 381 | 445 | 89 | 171 | 89 | 171 | 89 | 171 | 247 | 329 | 381 | 445 | 476 | 523 | 535 | 575 |
| 72 | 586 | 586 | 586 | 305 | 381 | 225 | 305 | 192 | 271 | 174 | 252 | 174 | 252 | 335 | 388 | 453 | 485 | 174 | 252 | 174 | 252 | 174 | 252 | 335 | 388 | 453 | 485 | 533 | 545 | 586 |
| 73 | 593 | 593 | 593 | 593 | 385 | 439 | 308 | 373 | 274 | 339 | 255 | 339 | 255 | 339 | 393 | 459 | 491 | 540 | 255 | 339 | 255 | 339 | 255 | 339 | 393 | 459 | 491 | 540 | 551 | 593 |
| 74 | 599 | 599 | 599 | 599 | 599 | 443 | 479 | 377 | 426 | 343 | 397 | 343 | 397 | 343 | 397 | 463 | 496 | 545 | 557 | 343 | 397 | 343 | 397 | 343 | 397 | 463 | 496 | 545 | 557 | 599 |
| 75 | 496 | 496 | 496 | 496 | 496 | 496 | 397 | 422 | 353 | 384 | 328 | 384 | 328 | 384 | 328 | 384 | 411 | 451 | 461 | 496 | 328 | 384 | 328 | 384 | 328 | 384 | 411 | 451 | 461 | 496 |
| 76 | 502 | 502 | 502 | 502 | 502 | 502 | 502 | 427 | 447 | 388 | 416 | 388 | 416 | 388 | 416 | 388 | 416 | 457 | 467 | 502 | 502 | 388 | 416 | 388 | 416 | 388 | 416 | 457 | 467 | 502 |
| 77 | 507 | 507 | 507 | 507 | 507 | 507 | 507 | 507 | 451 | 461 | 420 | 461 | 420 | 461 | 420 | 461 | 420 | 461 | 472 | 507 | 507 | 507 | 420 | 461 | 420 | 461 | 420 | 461 | 472 | 507 |
| 78 | 513 | 513 | 513 | 513 | 513 | 513 | 513 | 513 | 513 | 467 | 477 | 467 | 477 | 467 | 477 | 467 | 477 | 467 | 477 | 513 | 513 | 513 | 513 | 467 | 477 | 467 | 477 | 467 | 477 | 513 |
| 79 | 518 | 518 | 518 | 518 | 518 | 518 | 518 | 518 | 518 | 518 | 482 | 518 | 482 | 518 | 482 | 518 | 482 | 518 | 482 | 518 | 518 | 518 | 518 | 518 | 482 | 518 | 482 | 518 | 482 | 518 |
Thus, the effect of lead time is to shift cancers along the diagonal of the table, upward and leftward. This reflects the fact that earlier detection brings forward the diagnosis of the tumor both in calendar period and age. For example, without screening in year 1, there would be 4,540 cancers diagnosed at ages 50 to 59; with screening, there would be 20,756. Conversely, in year 10 at ages 70 to 79, there would be 5,452 cancers diagnosed without screening but only 3,268 with screening. This shift in age and time of diagnosis also means that if incidence is increasing with age, with time, or with both, then the observed excess due to lead time will be larger. Figure 1 shows the cumulative numbers of breast cancer cases observed in the cohort of age 50 at year 1, over 30 years, with and without screening. The incidences separate dramatically, in the first 10 years, and the disparity remains roughly constant over the following 10 years; then the two cumulative graphs come together at 30 years. This demonstrates that the only phenomenon generated by the screening in this scenario is lead time. The screening diagnoses many cancers earlier than they would have been diagnosed in the absence of screening, but after the screening stops, there is a deficit of cases in the screened group and the unscreened group 'catches up'.
Figure 1.
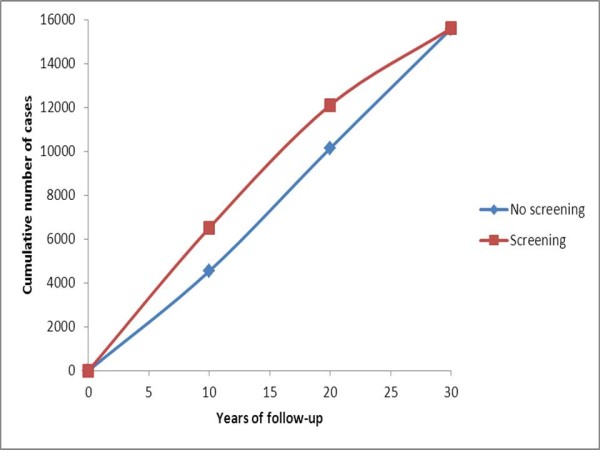
Expected cumulative incidence over ages 50 to 79 in a cohort of women of age 50 at the start, with and without 2-yearly screening from age 50 to 69.
Some researchers attempt to control for lead time by comparing incidence up to 10 years above the upper age limit for screening [5]. The rationale for this approach is that an excess of cases observed at screening ages because of lead time will be balanced by a corresponding deficit in cases above the screening age range. Table 4 shows the cumulative numbers of cancers with and without screening, by years of follow-up and upper age limit. Clearly, when the age range for screening alone is observed, lead time confers a substantial increase in observed cases, which remains substantial 10 years after the program has stopped. From lead time alone, 20-year observation at ages 50 to 69 would confer an observed excess incidence of 37% in the screened population. The excess would only fall below 10% with a follow-up of 25 years or more. For the excess to be nullified, or almost nullified, we would require a 30-year follow-up, including observation up to 10 years above the upper age limit for screening. This is because lead time shifts the diagnosis not only in terms of age of the subject but also in terms of the calendar year of diagnosis.
Table 4.
Cumulative numbers of breast cancer cases observed with and without screening
| Age range observed, years | Years of follow-up | Number of cases | Observed percentage excess | |
|---|---|---|---|---|
| Without screening | With screening | incidence With screening | ||
| 50-69 | 5 | 50,270 | 102,380 | 102 |
| 10 | 101,440 | 153,460 | 51 | |
| 15 | 152,160 | 226,680 | 49 | |
| 20 | 202,880 | 277,060 | 37 | |
| 25 | 253,600 | 304,080 | 20 | |
| 30 | 304,320 | 351,260 | 15 | |
| 50-74 | 5 | 65,300 | 113,400 | 74 |
| 10 | 130,600 | 170,500 | 31 | |
| 15 | 195,900 | 250,100 | 28 | |
| 20 | 261,200 | 307,675 | 18 | |
| 25 | 326,500 | 341,975 | 5 | |
| 30 | 391,800 | 402,100 | 3 | |
| 50-79 | 5 | 77,980 | 126,069 | 62 |
| 10 | 155,960 | 195,018 | 25 | |
| 15 | 233,940 | 285,435 | 22 | |
| 20 | 311,920 | 354,714 | 14 | |
| 25 | 389,900 | 400,239 | 3 | |
| 30 | 467,880 | 472,014 | 1 | |
Another strategy sometimes employed to account for lead time is to compare the incidence in the screened population with the corresponding incidence of subjects in the unscreened population who are 2 to 5 years older [5,6]. Table 5 shows the incidence per 100,000 person-years in 5-year age groups and time periods in the screened and unscreened populations. Note that because alternate 5-year periods contain two screens and three screens, the overall incidence in the screened population fluctuates from period to period. Note also that within 5-year periods there is no monotonic increase in incidence with age, because some of the older age groups have cases shifted to younger groups because of lead time. If we compare the cumulative incidence over 10 years between the age group of 50 to 69 in the screened population and the age group of 55 to 74 in the unscreened population, using Table 5 data, we would observe 3,000 cases per 100,000 women in the screened population and 2,190 in the latter, an excess of 37%. At 20 years, we would observe 5,415 cases per 100,000 women in the screened population and 4,380 in the unscreened population, an excess of 24%. At 30 years, the cumulative incidence figures would be 6,865 and 6,570, an excess of 4%.
Table 5.
Incidence rates per 100,000 person-years in the screened and unscreened populations
| Age | Population | Calendar period, years | |||||
|---|---|---|---|---|---|---|---|
| group, years | 1-5 | 6-10 | 11-15 | 16-20 | 21-25 | 26-30 | |
| 50-54 | Screened | 406 | 259 | 365 | 259 | 143 | 166 |
| Unscreened | 166 | 166 | 166 | 166 | 166 | 166 | |
| 55-59 | Screened | 379 | 176 | 258 | 175 | 94 | 180 |
| Unscreened | 186 | 186 | 186 | 186 | 186 | 186 | |
| 60-64 | Screened | 381 | 169 | 242 | 164 | 91 | 190 |
| Unscreened | 213 | 213 | 213 | 213 | 213 | 213 | |
| 65-69 | Screened | 441 | 196 | 285 | 193 | 97 | 204 |
| Unscreened | 229 | 229 | 229 | 229 | 229 | 229 | |
| 70-74 | Screened | 190 | 104 | 110 | 125 | 125 | 223 |
| Unscreened | 251 | 251 | 251 | 251 | 251 | 251 | |
| 75-79 | Screened | 267 | 250 | 228 | 246 | 236 | 246 |
| Unscreened | 267 | 267 | 267 | 267 | 267 | 267 | |
A more exact 'aging' adjustment for lead time might be to compare the cumulative incidence of a screened cohort with that of an unscreened cohort that is 5 years older. Figure 2 shows the cumulative incidence per 100,000 women up to year 25 (not 30, since we do not have data for ages 80 and above) for ages 50 to 54 at the start of the follow-up period in the screened population and 55 to 59 in the unscreened population. The incidence curves come together only at 25 years. There is still a substantial excess in the screened population at 20 years.
Figure 2.
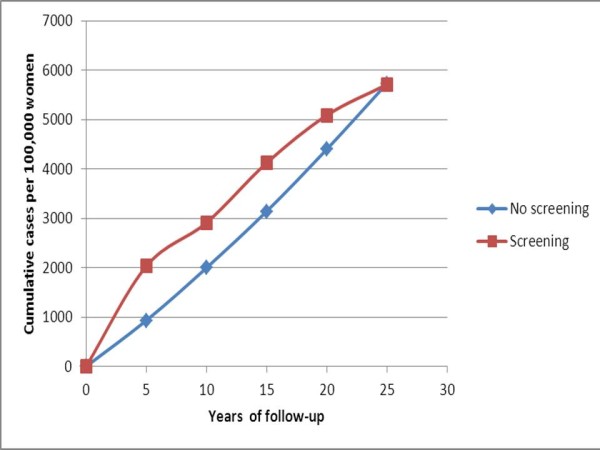
Expected cumulative incidence over 25 years in a screened group of ages 50 to 54 and in an unscreened group of age 55 to 59 at recruitment at the start of follow-up.
Discussion
We posited a population of age 50 to 79 with age distribution and breast cancer incidence similar to those that prevailed in the UK before the NHS Breast Screening Programme was initiated. We assumed that age-specific incidence in an unscreened population would remain unchanged over 30 years. We then imposed a screening program with 2-yearly screening for 20 years from age 50 to 69 (as is common in Europe). We calculated the incidence in the screened population, assuming that the only influence of screening on incidence was lead time, using lead-time parameters similar to those observed in a large breast screening trial [13,14]. Thus, we calculated the expected effects on incidence from lead time alone, with no influence of overdiagnosis or changes in underlying risk.
The most important finding was that lead time can be expected to add substantially to observed incidence in a screened population. Although the increase is greatest in the early years of the program, there is still a substantial excess at long-term follow-up. From Table 4, in the screened age group, 50 to 69, a 37% excess cumulative incidence was apparent at 20 years, and a 15% excess at 30 years, 10 years after the program stopped. Thus, the first conclusions from this work must be that lead time contributes a considerable observed increase in incidence in screening age groups and that for an estimate of overdiagnosis to be reliable, it must correct for lead time.
Secondly, the results give us some qualifications to the use of common methods of correction for lead time and suggest that correction for lead time in our estimates and those of others may be inadequate [2,3,5,6]. The method of considering incidence up to an age in excess of the upper age limit for screening can be reliable but only if more than two decades of follow-up are available. From Table 4, with incidence to age 74, the excess from lead time alone at 20 years was 18%. With incidence to age 79, the excess at 20 years was 14%. It is only at 25 to 30 years of follow-up that the excess incidence decreased to a figure close to zero.
It should be noted that our estimates pertain to a population that is 100% screened. In the screening trials, results are usually given for the group randomly assigned to the offer of screening, which will contain some non-attenders. Both lead-time effects and overdiagnosis will be smaller in an invited group, and the attenuation depends on the proportion of non-attenders.
At the end of 10 years, from lead time alone there was an excess cumulative incidence at ages 50 to 79 of 25% in the screened population. Kalager and colleagues [5], who used this method of controlling for lead time, observed an 18% excess incidence in the Norwegian breast screening program at approximately 10 years. With 77% participation in the Norwegian program [5], one would expect 19% (0.77 × 25%) at 10 years. Thus, all of the excess incidence in that study might be explained by lead time. The excess incidence in the screened ages at a follow-up of only 10 years amounts to 52,020 cases, whereas the deficit above the screened ages is only 12,962 cases (Table 4). In the age group of 70 to 79 in the first 10 years, 70% of the cancers diagnosed are in women who have never been screened (Table 3). Our study [3] had a 15-year follow-up, but even at 15 years, our results here indicate that there would still be residual lead-time effects when this type of correction is used.
We assumed that the incidence rates would have remained stable over time in the absence of screening, for simplicity of calculation. If we had assumed that underlying incidence rates were increasing, as indeed they were almost everywhere in the world in the late 20th century, the effect of lead time and the potential to overestimate overdiagnosis would have been even greater.
Our lead-time model is based on the exponential sojourn time model of Walter and Day [15], whose article gives a full discussion of the mathematical details and modeling assumptions involved in estimating cancer screening parameters. Walter and Day gave a range of estimates of the mean preclinical screen detectable period from 1.7 to 3.1 years; however, more recent estimates have been close to our estimate of 40 months [13-16].
The recent UK review of breast cancer screening estimated overdiagnosis of 10% to 20% depending on the denominator used, from the difference between study and control group incidence in three of the randomized screening trials [16]. For two of the trials, the incidence extended only 6 years beyond the end of screening in the study group, so the overdiagnosis estimates in the review are also likely to be overestimates.
Similarly, the attempt by Kalager and colleagues [5] to control for lead time by comparing the screened population with subjects in the unscreened population who are 2 to 5 years older is inadequate for adjusting for lead time. Our results show that at 10 years, even with the 5-year adjustment, lead time would confer a 37% increase in incidence. Correcting for the participation rate of 77%, we would expect a 28% increase in incidence, and the increase observed by Kalager and colleagues [5] was actually smaller than this (18%).
Morrell and colleagues [6] applied a similar 5-year aging correction for lead time in the New South Wales breast screening program and observed a 30% excess incidence after adjustment, and at about 10 years after the program started, with 60% participation. From lead time alone, we would expect a 22% increase (0.6 × 37%), suggesting that overdiagnosis accounts for an 8% excess and that the remainder of the 30% is a residual lead-time effect. It is also worth noting that the estimate by Morell and colleagues [6] is not based on cumulative incidence but only on the three years from 1999 to 2001 when the program was mature. More importantly, it is worth noting that the estimate of more than 30% overdiagnosis in the UK program by Jørgensen and Gøtzsche [2] has no adjustment for lead time at all and therefore cannot be regarded as a reliable estimate of overdiagnosis.
Further empirical evidence that overdiagnosis is a smaller problem than generally thought comes from the Swedish Two-County Trial of breast cancer screening. In one county, the cumulative incidence over 29 years was identical between study and control groups [17]. Since the control group was subject to screening 7 years later than the study group, this does not rule out overdiagnosis, but the fact that a population experiencing an additional 100,000 screening episodes had no increase whatsoever in incidence suggests that overdiagnosis is a minor phenomenon.
It should be noted that our estimates are based on incidence of invasive cancer only. We have blocked the time into discrete years and posited simultaneous screening of all subjects rather than a screening round taking several months to cover the population. Also, it could be argued that the average sojourn time (the duration of the preclinical screen detectable period), and therefore lead time, is smaller than used in our estimates. We did, however, use an estimate of just over 3 years, which is commonly observed for ages of 50 or more [13,14,18,19]. Indeed, some colleagues have estimated considerably greater sojourn times, albeit with lesser sensitivity [20]. Also, the general point will still hold that lead time confers an excess incidence even with the common corrections used up to 20 years after the program starts. Improvements to screening technology may change the sojourn time and sensitivity parameters. However, they are likely to increase rather than reduce lead time, so the qualitative implications of our results will remain relevant. It should also be noted that although we posited an average lead time of 40 months, the range of individual values is wide. For example, 35% of cancers that would have occurred 3 to 4 years after a screen have their diagnosis advanced to the screening year.
We estimated effects on incidence of lead time alone. Of course, there will be other influences, including changes in underlying incidence because of trends in risk factor exposure and because of overdiagnosis. However, our results show that estimation of either of the latter will be contaminated by lead time unless there is very long (greater than two decades) observation. The major implication of this is that it is easy to overestimate overdiagnosis, particularly in uncontrolled observation of incidence before and after screening. To avoid such overestimation, it is necessary to estimate lead time explicitly or to have a very long period of observation. To conclude that large numbers of breast cancers would never progress in the absence of treatment is a major biological leap of faith, and every effort should be made to rule out alternative explanations of increases in breast cancer incidence.
Conclusions
The results here indicate that to estimate overdiagnosis using either the compensatory drop above the age range for screening or an age inflation, very-long-term follow-up is required to avoid bias from residual lead-time effects. Previous estimates of overdiagnosis are likely to be overestimates.
Appendix
Estimation of proportions of cancers with diagnosis time shifted by screening, by year since screen
Let λ0 be the instantaneous rate of transition from no detectable disease to presymptomatic screen-detectable breast cancer, and λ1 the subsequent rate of transition to symptomatic disease. With an exponential distribution of time to each transition [13], the probability of clinical symptomatic disease between time 0 and time 1 year, in a person screened negative at time 0, is
This is essentially the probability of transition from no detectable disease to presymptomatic including the possibilities of remaining presymptomatic or progressing to symptomatic disease MINUS the probability of transition only to the presymptomatic phase. This difference is equal to the probability of transition from no detectable disease to symptomatic disease. Suppose an incidence of 2 per thousand per year. The corresponding value for λ0 would be 0.002 (corresponding to an incidence of 2 per thousand person-years) and λ1 = 0.3 (corresponding to a mean sojourn time of 40 months), this probability is 0.000272, 14% of the expected incidence (0.000272/0.002 = 0.14). Thus 86% of the tumours expected to arise in the first year after screening have their diagnosis advanced to the time of the screen.
The probability of symptomatic incidence in years 0 to 2 is correspondingly
With λ0 = 0.002 and λ1 = 0.3, this would be 0.000991. Therefore, the probability of symptomatic occurrence between 1 and 2 years after the screen would be 0.000991-0.000272 = 0.000719, 36% of the expected incidence in the absence of screening. Thus 64% of the tumours which would have arisen in the second year after screening have their diagnosis advanced to the time of the screen. Proportions for subsequent years are calculated similarly.
Competing interests
The authors declare that they have no competing interests.
Authors' contributions
SWD was responsible for the concept of the study and for the mathematical formulation and contributed to drafting the manuscript. DP was responsible for informatics and computing modeling and contributed to drafting the manuscript. Both authors read and approved the final manuscript.
Contributor Information
Stephen W Duffy, Email: s.w.duffy@qmul.ac.uk.
Dharmishta Parmar, Email: d.parmar@qmul.ac.uk.
Acknowledgements
The Policy Research Unit in Cancer Awareness, Screening, and Early Diagnosis receives funding for a research program from the Department of Health Policy Research Programme. It is a collaboration between researchers from seven institutions (Queen Mary University of London, UCL, King's College London, London School of Hygiene and Tropical Medicine, Hull York Medical School, Durham University, and Peninsula Medical School). We thank Judith Offman for assistance with graphics.
References
- Puliti D Duffy S Miccinesi G de Koning H Lynge E Zappa M Paci E Methodology and estimate of overdiagnosis in breast cancer service screening: a review of the European studies J Med Screen 201219S142–54.22972810 [Google Scholar]
- Jørgensen KJ, Gøtzsche PC. Overdiagnosis in publicly organised mammography screening programmes: systematic review of incidence trends. BMJ. 2009;339:b2587. doi: 10.1136/bmj.b2587. [DOI] [PMC free article] [PubMed] [Google Scholar]
- Duffy SW, Tabar L, Olsen AH, Vitak B, Allgood PC, Chen TH, Yen AM, Smith RA. Absolute numbers of lives saved and overdiagnosis in breast cancer screening, from a randomized trial and from the Breast Screening Programme in England. J Med Screen. 2010;17:25–30. doi: 10.1258/jms.2009.009094. [DOI] [PMC free article] [PubMed] [Google Scholar]
- Moss S. Overdiagnosis and overtreatment of breast cancer: overdiagnosis in randomised controlled trials of breast cancer screening. Breast Cancer Res. 2005;7:230–234. doi: 10.1186/bcr1314. [DOI] [PMC free article] [PubMed] [Google Scholar]
- Kalager M, Adami H, Bretthauer M, Tamimi R. Overdiagnosis of invasive breast cancer due to mammogrpahy screening: results from the Norwegian screening program. Ann Intern Med. 2010;156:491–499. doi: 10.7326/0003-4819-156-7-201204030-00005. [DOI] [PubMed] [Google Scholar]
- Morrell S, Barratt A, Irwig L, Howard K, Biesheuvel C, Armstrong B. Estimates of overdiagnosis of invasive breast cancer associated with screening mammography. Cancer Causes Control. 2010;21:275–282. doi: 10.1007/s10552-009-9459-z. [DOI] [PubMed] [Google Scholar]
- Duffy S, Lynge E, Jonsson H, Ayyaz S, Olsen A. Complexities in the estimation of overdiagnosis in breast cancer screening. Br J Cancer. 2008;99:1176–1178. doi: 10.1038/sj.bjc.6604638. [DOI] [PMC free article] [PubMed] [Google Scholar]
- Gøtzsche PC, Jørgensen KJ, Maehlen J, Zahl PH. Estimation of lead time and overdiagnosis in breast cancer screening. Br J Cancer. 2009;100:219. doi: 10.1038/sj.bjc.6604762. author reply 220. [DOI] [PMC free article] [PubMed] [Google Scholar]
- Duffy S, Lynge E, Jonsson H. Estimation of lead time and overdiagnosis in breast cancer screening. Br J Cancer. 2009;100:220. doi: 10.1038/sj.bjc.6604824. [DOI] [PMC free article] [PubMed] [Google Scholar]
- Bennett RL, Sellars SJ, Moss SM. Interval cancers in the NHS breast cancer screening programme in England, Wales and Northern Ireland. Br J Cancer. 2011;104:571–577. doi: 10.1038/bjc.2011.3. [DOI] [PMC free article] [PubMed] [Google Scholar]
- Office of Population Censuses and Surveys. Cancer Statistics Registrations 1986. London: Her Majesty's Stationery Office (HMSO); 1991. [Google Scholar]
- Office of Population Censuses and Surveys. Cancer Statistics Registrations 1987. London: Her Majesty's Stationery Office (HMSO); 1993. [Google Scholar]
- Chen H, Duffy S, Tabar L, Day N. Markov chain models for progression of breast cancer, part 1: tumour attributes and the preclinical screen-detectable phase. J Epidemiol Biostat. 1997;2:9–23. [Google Scholar]
- Tabar L, Vitak B, Chen HH, Duffy SW, Yen MF, Chiang CF, Krusemo UB, Tot T, Smith RA. The Swedish Two-County Trial twenty years later. Updated mortality results and new insights from long-term follow-up. Radiol Clin North Am. 2000;38:625–651. doi: 10.1016/S0033-8389(05)70191-3. [DOI] [PubMed] [Google Scholar]
- Walter SD, Day NE. Estimation of the duration of a pre-clinical disease state using screening data. Am J Epidemiol. 1983;118:865–886. doi: 10.1093/oxfordjournals.aje.a113705. [DOI] [PubMed] [Google Scholar]
- Independent UK Panel on Breast Cancer Screening. The benefits and harms of breast cancer screening: an independent review. Lancet. 2012;380:1778–1786. doi: 10.1016/S0140-6736(12)61611-0. [DOI] [PubMed] [Google Scholar]
- Yen AM, Duffy SW, Chen TH, Chen LS, Chiu SY, Fann JC, Wu WY, Su CW, Smith RA, Tabar L. Long-term incidence of breast cancer by trial arm in one county of the Swedish Two-County Trial of mammographic screening. Cancer. 2012;118:5728–5732. doi: 10.1002/cncr.27580. [DOI] [PubMed] [Google Scholar]
- Shen Y, Zelen M. Screening sensitivity and sojourn time form breast cancer early detection clinical trials: mammograms and physical examinations. J Clin Oncol. 2001;19:3490–3499. doi: 10.1200/JCO.2001.19.15.3490. [DOI] [PubMed] [Google Scholar]
- Olsen AH, Agbaje OF, Myles JP, Lynge E, Duffy SW. Overdiagnosis, sojourn time, and sensitivity in the Copenhagen mammography screening program. Breast J. 2006;12:338–342. doi: 10.1111/j.1075-122X.2006.00272.x. [DOI] [PubMed] [Google Scholar]
- Weedon-Fekjaer H, Vatten LJ, Aalen OO, Lindqvist B, Tretli S. Estimating mean sojourn time and screening test sensitivity in breast cancer mammography screening: new results. J Med Screen. 2005;12:172–178. doi: 10.1258/096914105775220732. [DOI] [PubMed] [Google Scholar]