Abstract
Adipocytes hypertrophy is the main cause of obesity and its affliction such as type 2 diabetes (T2D). Since superparamagnetic iron oxide nanoparticles (SPIONs) are used for a wide range of biomedical/medical applications, we aimed to study the effect of SPIONs on 22 and 29 risk genes (Based on gene wide association studies) for obesity and T2D in human adipocytes. The mRNA expression of lipid and glucose metabolism genes was changed upon the treatment of human primary adipocytes with SPIONs. mRNA of GULP1, SLC30A8, NEGR1, SEC16B, MTCH2, MAF, MC4R, and TMEM195 were severely induced, whereas INSIG2, NAMPT, MTMR9, PFKP, KCTD15, LPL and GNPDA2 were down-regulated upon SPIONs stimulation. Since SEC16B gene assist the phagocytosis of apoptotic cells and this gene were highly expressed upon SPIONs treatment in adipocytes, it is logic to assume that SPIONs may play a crucial role in this direction, which requires more consideration in the future.
Adipocytes hypertrophy is the major cause of obesity, which promotes an inflammation state and this, in turn, is implicated with pathophysiological metabolic disorders1,2 such as insulin resistance (IR), type 2 diabetes (T2D) and cardiovascular disease (CVD )3,4,5,6. While adipocytes play a central role in maintaining lipid homeostasis and energy balance, recent studies suggest that adipose tissue (AT) is a key site for chronic inflammation in obese human subjects and rodents7,8, and the macrophage content of AT in obese humans and rodents increases dramatically. Meijer et al.2 has recently shown that adipocytes exhibit immune cell function and are able to prime inflammation independent of macrophages. For example, hypertrophic adipocytes in obese individuals alter the adipose tissue macrophages (ATMs) from resident to activated macrophages, secreting secrete a range of cytokines and chemokines, which the latter recruit T cells towards AT. Since obesity and its associated metabolic disorders are multifactorial disease and adipocytes hypertrophy is the main cause of obesity, a comprehensive approach to identify biological and functional pathways of adipocytes-genes associated with the diseases is necessary to clarify the molecular signatures of obesity and related diseases9,10,11. Based on epidemiological and gene wide association studies (GWAS), one cluster of genes is considered as potential risk for obesity and one gene cluster is potentially involved in the development of T2D12. In fact gene expression can be influenced by many factors including organism's internal signals as well as external environment factors13.
With the rapid advances of nanoscience and nanotechnology, our exposure to nanomaterials is significantly increasing, however, the potential risks of these nanomaterials are largely unknown14,15. Because of their very small size, nanoparticles (NPs) are capable of entering the human body by inhalation, ingestion, skin penetration or via injections; in this case, it may be assumed that NPs have capability to interact with intracellular structures and macromolecules for long periods16,17. One particularly important toxicological endpoint is genotoxicity, as large-scale gene expression analysis provides a logical approach to study the detailed mechanisms of NPs toxicity. Recent studies have shown that NPs can changes gene expression, thus, altering cellular functions or even NPs could be the cause of toxicity18,19,20.
The aim of this study is to investigate whether superparamagnetic iron oxide nanoparticles (SPIONs) affect down or up-regulation of two cluster genes involved in the development of obesity and T2D in human primary adipocytes. SPIONs are amongst the most used NPs in medicine and they have been investigated for many applications, including magnetic labeling21,22, cell isolation23, hyperthermia24, and controlled drug release25. Due to their small size, these NPs can produce excess reactive oxygen species (ROS) through their dissolution and formation of  and
and  radicals from H2O2 via the Fenton reaction26,27,28. Moreover, the obesity-induced oxidative stress and localized inflammation in AT leads to important changes in adipocyte gene expression with downstream effects on adipocyte lipid metabolism and triglycerides as the stored energy in the lipid droplets29,30. Since adipocytes hypertrophy is the main cause of obesity and, in turn, T2D, we design this study to investigate the effect of SPIONs on 22 and 29 risk genes associated with obesity and T2D in human primary adipocytes.
Results
Synthesis and characterization of SPIONS
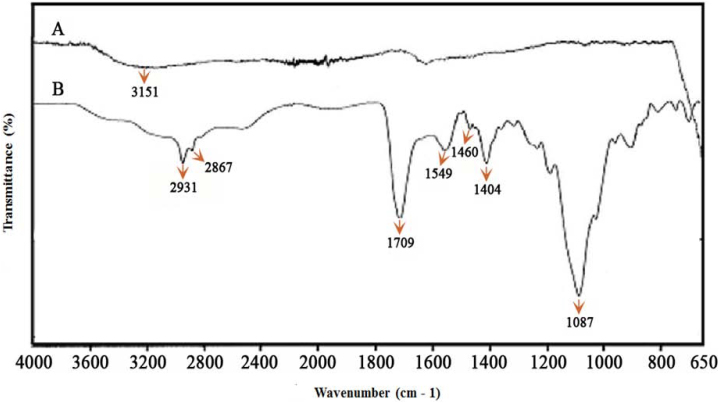
The Fourier transform infrared spectroscopy (FTIR) generated spectra of bare SPIONs and Carboxyethylsilanetriol (CES) grafted SPIONs are shown in Figure 1. The broad band at 3400–3500 cm−1 indicated the presence of surface hydroxyl groups in bare SPIONs (Figure 1A). In the FTIR spectrum of CES-grafted SPIONs (see Figure 1B), a strong peak at 1709 cm−1 is present due to acidic carbonyl (C = O) groups. Symmetric and asymmetric stretching vibrations of methylene groups in CES showed absorption bands at 2931 and 2867 cm−1, respectively. Strong peak at 1087 cm−1 is due to C–O of CES group. The absorption band at 1460 cm−1 is due to bending vibrations of CH2 groups of CES groups.
Figure 1. Fourier Transform Infrared Spectroscopy (FTIR) of (A) bare and (B) CES-grafted SPIONs.
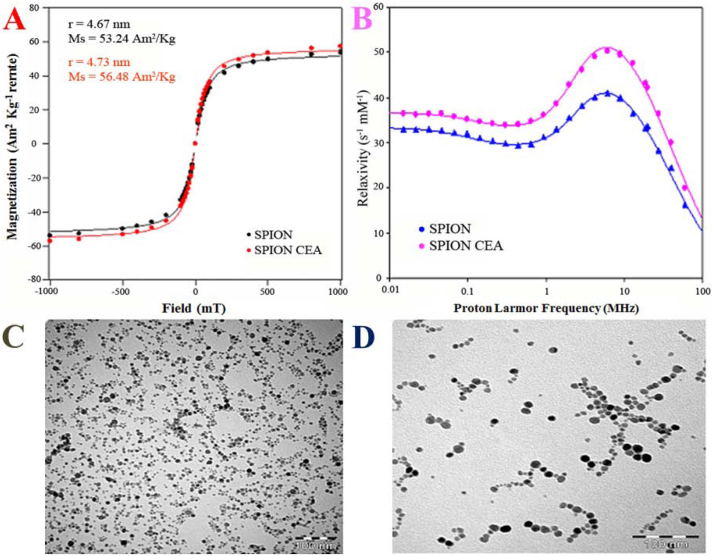
TEM of the SPIONs is shown in Figure 2A and 2B confirming the formation of SPIONs with a very narrow size distribution. More quantitative analyses of particles were conducted using magnetometry and relaxometry. In Figure 2D and 2C, these corresponding curves of the SPIONs are shown. A Langevin function was fitted to the data, providing a particle radius R of 4.73 and saturation magnetization (Ms) of 56.48 A m2/kg for CES grafted SPIONs. Particle radius and saturation magnetization (Ms) of bare SPIONs were found to be 4.67 and 53.24 A m2/kg respectively. The Nuclear Magnetic Relaxation Dispersion (NMRD)-profile of a SPIONs is reported on Figure 2B. As it is clear from the picture, R1 values increased after grafting with CSE. The curve represents a peak in the high field (10–60 MHz), which is due is slow rotational correlation time of self-agglomerates.
Figure 2. Magnetization curves, NMRD profiles, and Transmission Electron Micrographs of bare and CES-grafted SPIONS.
(A) Magnetization curves for bare and CES-grafted SPIONs, (B) NMRD profiles of bare and CES-grafted SPIONs, and Transmission Electron Micrographs of (C) bare and (D) CES-grafted SPIONs.
The effect of SPIONs on high risk genes associated with obesity and type 2 diabetes in human primary adipocytes
The mRNA analysis of high risk genes-associated with obesity and type 2 diabetes
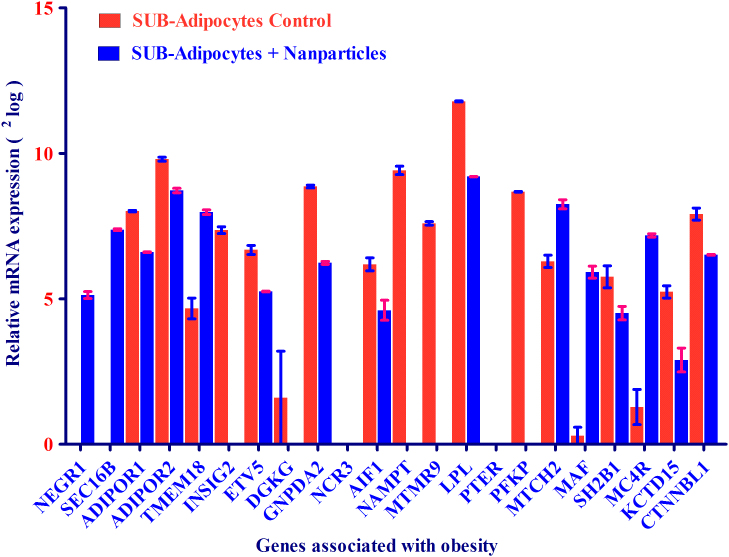
The procedure for growth of human primary adipocytes was already described2,7. To investigate whether SPIONs affect the expression of high risk genes associated with obesity and T2D, mRNA expression of 22 and 29 genes with high susceptibility to obesity and T2D, respectively, were measured in human primary adipocytes, which were already established as an energy metabolism model. Upon SPIONs stimulation, most of these adipocyte-associated high-risk genes for obesity were down-regulated and a few up-regulated such as (e.g. INSIG2, NAMPT (also called Visfatin, which is mainly present in adipocytes), MTMR9, PFKP, KCTD15, LPL and GNPDA2 highly down-regulated) and (e.g. NEGR1, SEC16B, MTCH2, MAF and MC4R highly up-regulated)) as depicted in Figure 3. However, three genes DGKG, NCR3 and PTER were not detected in human primary adipocytes treated with and without SPION.
Figure 3. mRNA expression of 22 genes associated with obesity as found by GWAS was analyzed in adipocytes after treatment with and without SPIONs.
mRNA expression of 22 genes was expressed as 2log values on the y-axis. Relative mRNA intensity was obtained from two measurements.
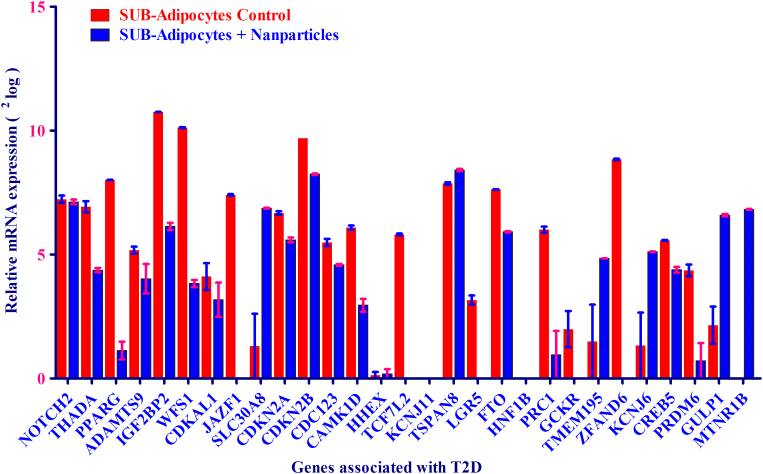
The mRNA expression of high-risk genes associated with T2D was also measured in human primary adipocytes, upon SPIONs treatment. As depicted in Figure 4, after stimulation of human primary adipocytes with SPIONs, the majority of high risk genes linked with T2D was highly down regulated such as PPAR-γ, IGF2BP2, WFS1, JAZF1, CAMK1D, PRC1, TCF7L2 and ZFAND6. The other genes such as GULP1, SLC30A8, and TMEM195 were severely induced upon SPIONs stimulation as compared to control. The mRNA of the following genes KCNJ11, HHEX, and HNF1B were not detectable in either state.
Figure 4. mRNA expression of 29 genes associated with type 2 diabetes (T2D) as found by GWAS was analyzed in adipocytes after treatment with and without SPIONs.
mRNA expression of 29 genes was expressed as 2log values on the y-axis. Relative mRNA intensity was obtained from two measurements.
Functional pathway and disorder analysis of obesity-associated genes in human primary adipocytes upon SPION stimulation
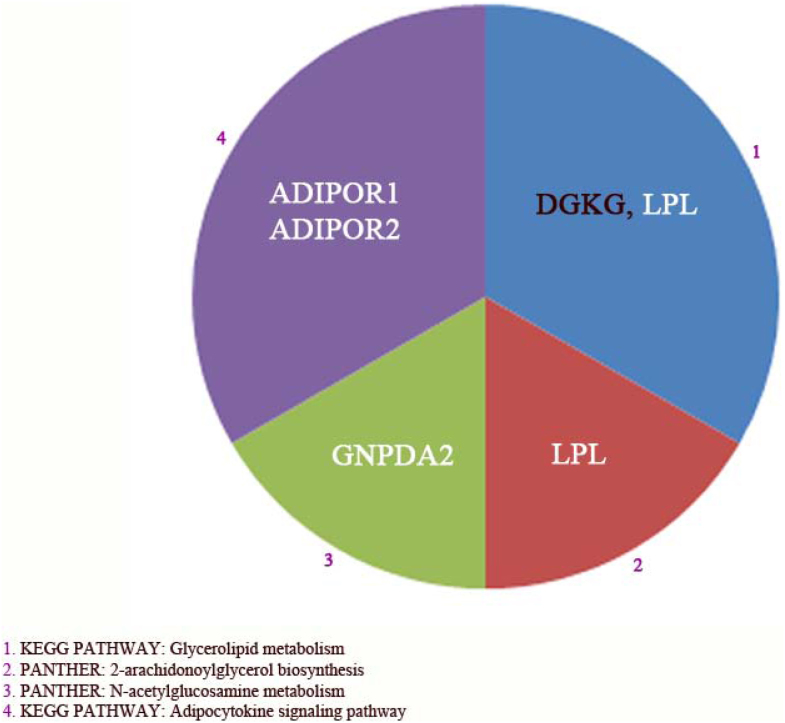
To gain more insight into the possible physiological functions of obesity-associated genes, statistically enriched pathways and diseases for the 22 genes involved in obesity were investigated using KOBAS 2.0. KOBAS 2.0 was combined with hypergeometric test and Benjamini-Hochberg FDR correction and considering all human genes as background. This included Kyoto Encyclopedia of Genes and Genomes (KEGG) pathway, Pathway Interaction Database (PID) curated, PID BioCarta, PID reactome, BioCyc, Reactome and Protein Analysis Through Evolutionary Relationships (PANTHER) pathway databases and KEGG disease, Genetic Association Database (GAD), Functional disease ontology (FunDO), Online Mendelian Inheritance in Man (OMIM) and National Human Genome Research Institute (NHGRI) human disease databases. Functional Pathways and disorders with a corrected p-value < 0.05 were considered relevant and are shown in Figure 5 and 6 respectively. 4 functional pathways were found to be related to Glycerolipid metabolism (KEGG), adipocytokine signaling pathway (KEGG), N-acetylglucosamine metabolism (PANTHER) and 2-arachidonoylglycerol biosynthesis (PANTHER). These data further illustrated that lipids and glucose also have a key role in these pathways. These four pathways were resulted from only 5/22 analyzed genes of which three genes were adipocytes differentiation markers (e.g. ADIPOR1, ADIPOR2, and LPL) (Figure 5). Upon SPION treatment, all genes found in this pathway were down-regulated in adipocytes as compared to control adipocytes, except DGKG, which was not detectable in either state.
Figure 5. Enriched pathways related to the 22 genes found by Gene Wide Association Study (GWAS) as risk genes for obesity.
The abbreviations or description is: Kyoto Encyclopedia of Genes and Genomes (KEGG), and Gene Analysis Through Evolutionary Relationships (PANTHER). Only pathways with corrected p-values < 0.05 are presented. Abbreviations in Figure are: ADIPOR1 and 2 (Adiponectin receptor gene 1 and 2), LPL (lipoprotein lipase), DGKG (Diacylglycerol kinase gamma), and Glucosamine-6-phosphate isomerase 2. The complete list of abbreviations was shown in table 1.
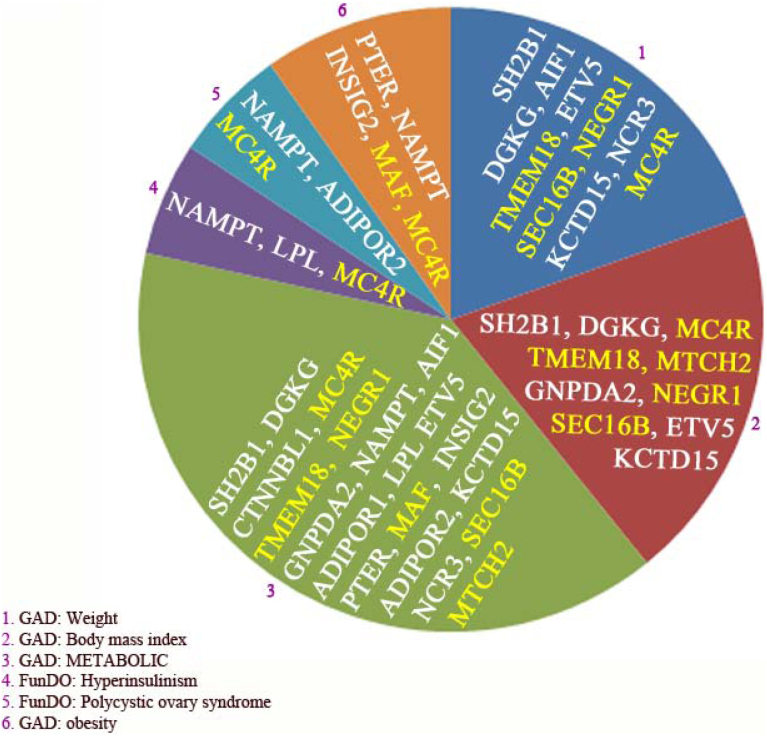
Figure 6. Enriched disorder pathways related to the 22 genes found by GWAS as risk genes for obesity.
The abbreviations or description is: Genetic Association Database (GAD), and Functional disease ontology (FunDO). Only disorders with corrected p-values < 0.05 were included in the analysis. The complete list of abbreviations was shown in table 1.
Subsequently, we investigated whether obesity-associated genes could have a role in human diseases. As displayed in Figure 6, 8 diseases were screened of which 5 appeared to be involved in lipid metabolism and AT. Importantly, one disorder related to hyperinsulinism, which may be also caused by an increase of AT-mass. Based on disorder enrichment analysis, obesity-associated genes involve in the development of human polycystic ovary syndrome. The disorder analysis also revealed that weight (i.e. 10 genes from 19 genes in this pathway) and body mass index (BMI) (i.e. 10 from 23 genes in this pathway) were considered as the most enriched disease processes, which fits well with the known involvement of these two factors in obesity disease, although it also suggests that the contribution of fat mass increase to hyperinsulinism might be due to the expression of insulin by AT and in particular adipocytes. It is noteworthy to mention that weight is one of two factors in BMI equation and obesity can be calculated by BMI. Importantly, disorder enrichment analysis showed that metabolic disorders (i.e. 20 from 719 genes present in this pathway) constituted approximately gene coverage of 3–4% as identified by disorder enrichment analysis. As depicted in Figure 6, the second hit of disorder analysis is BMI and covered by 10 genes of which 5 genes (i.e. MCR4, TMEM18, MTCH2, NEGR1 and SEC16B) show a higher mRNA expression in SPION adipocytes than control adipocytes and 4 genes display an opposite version. DGKG was not detected in both states. Moreover, the sixth hit of disorder analysis is obesity with 5 genes of which after SPIONs treatment the expression of two genes (i.e. MAF and MC4R) go up and two genes (i.e. NAMPT and INSIG2B) goes down and one gene (i.e. PTER) not detected in both states.
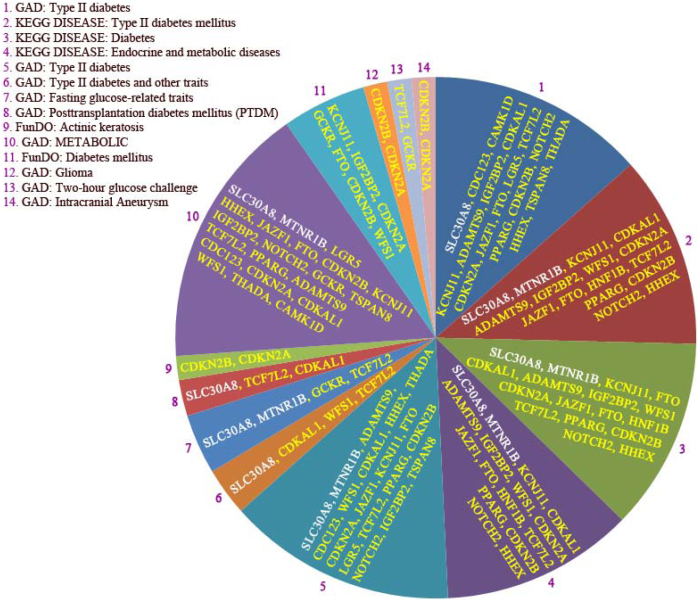
Figure 8. Enriched disorder pathways linked to the 29 genes found by GWAS as risk genes for type 2 diabetes (T2D).
The abbreviations are: Kyoto Encyclopedia of Genes and Genomes (KEGG), Genetic Association Database (GAD), and Functional disease ontology (FunDO). Only disorders with corrected p-values < 0.05 were included in the analysis. The complete list of gene abbreviations was shown in table 1.
Functional pathway and disorder analysis of T2D-associated genes in human primary adipocytes upon SPIONs stimulation
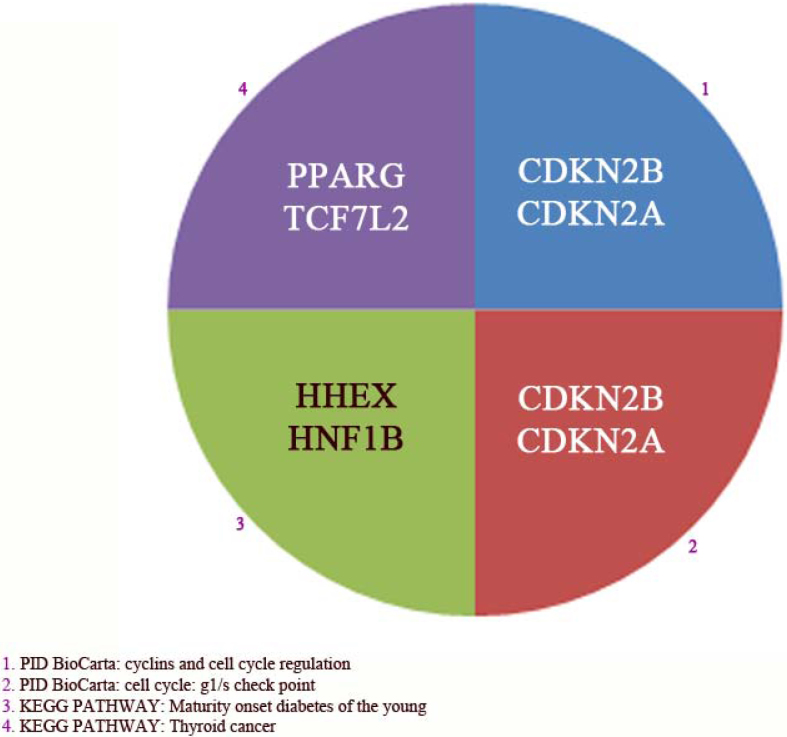
To shed more light into the possible physiological functions of T2D-associated genes, statistically enriched pathways and diseases for the 29 genes involved in T2D were detected using the same procedure and databases as we applied for obesity-associated genes. Functional Pathways and disorders with a corrected p-value < 0.05 were considered relevant and are shown in Figure 7 and 8 respectively. 4 functional pathways were found of which 2 played a role in the cell cycle and cell check point (i.e. PID BioCarta) as depicted in Figure 7. However, only one pathway was found to be directly related to diabetes (i.e. KEGG). The last detected functional pathway was Thyroid cancer (i.e. KEGG). These 4 functional pathways were found by PID BioCarta and KEGG databases and include 6/29 genes of which mRNA expression of 4 genes (i.e. PPARγ, TCF7L2, CDKN2A and CDKN2B) were down-regulated or not detected upon treatment of adipocytes with SPION and two genes (i.e. HHEX and HINF1B) were not detected in either state.
Figure 7. Enriched pathways related to the 29genes found by GWAS as risk genes for type 2 diabetes (T2D).
The abbreviations or description is: Kyoto Encyclopedia of Genes and Genomes (KEGG), and gene Analysis through Evolutionary Relationships (PANTHER). Only pathways with corrected p-values < 0.05 are presented. Abbreviations are: CDKN2A and B (Cyclin-dependent kinase inhibitor 2A and B, isoform 4), PPARγ (Peroxisome proliferator-activated receptor gamma), HHEX (Hematopoietically expressed homeobox protein HHEX), TCF7L2 (Transcription factor 7-like 2) HNF1B (Hepatocyte nuclear factor 1). The complete list of abbreviations was shown in table 1.
T2D-associated genes were also examined whether they could have a role for human diseases. As depicted in Figure 8, the majority of found disorders are T2D as expected. Also 4 disorders were identified of which two diseases related to the metabolism and two associated with glucose metabolism. These two disorders also considered to be truly involved in T2D. Another disorder was matched to the intracranial aneurysm, which may be due to T2D as cause of this disease. Disorder enrichment analysis logically revealed that (i.e. 15–24/29 genes) T2D, glucose metabolism in general were considered as the most enriched disease processes identified by disorder enrichment analysis, which matches well with the known role of these factors in T2D disease. Since all disorders ended to T2D, we have chosen to dissection the hit number 1 (Figure 8), which pointed to T2D includes 18 genes of 25 genes found in this pathway (i.e. GAD database; hit 1); a coverage of 70% (18:25 genes). Upon SPIONs treatment, importantly, mRNA expression of 11 genes (i.e. CDC123, CAMK1D, IGF2BP2, CDKN2A, JAZF1, FTO, LGR5, TCSF7-L2, PPARγ, CDKN2B, and THADA) was down-regulated as compared to control adipocytes. Two genes (i.e. KCNJ11 and HHEX) were neither detected in SPIONs adipocytes nor control. However, mRNA expression of four genes (i.e. ADAMTS9, CDKAL1, NOTCH2 and TSPAN8) was equal for both states and one gene (i.e. SLC30A8) up-regulated in SPION adipocytes.
Functional pathway and disorder analysis of combined set genes associated with obesity and T2D in human primary adipocytes upon SPION stimulation
To obtain further insight into the specific roles that obesity- and T2D-associated genes might have in pathophysiology, we also analyzed the combined set of genes linked with these two disorders (see Table 1, Figure 9 and Figure 10).
Table 1. The analysis of Risk genes associated with obesity and type 2 diabetes in adipocytes after treatment with and without SPIONs.
| Gene Name | Gene Description | Disease (GWAS) | MW (kDa) | pI | AD Exp | Adipocytes + SPION |
|---|---|---|---|---|---|---|
| NEGR1 | Neuronal growth regulator 1 | OBESITY | 24.7 | 6.29 | ND | UP |
| SEC16B | Protein transport protein Sec16B | OBESITY | 116.0 | 5.71 | ND | UP |
| ADIPOR1 | Adiponectin receptor protein 1 | OBESITY | 42.6 | 6.53 | Yes | Down |
| ADIPOR2 | Adiponectin receptor protein 2 | OBESITY | 43.8 | 6.11 | Yes | Down |
| TMEM18 | Transmembrane protein 18 | OBESITY | 16.2 | 9.35 | Yes | UP |
| INSIG2 | Insulin-induced gene 2 protein | OBESITY | 24.7 | 8.16 | Yes | Down(ND) |
| ETV5 | ETS translocation variant 5 | OBESITY | 57.8 | 5.43 | Yes | Down |
| DGKG | Diacylglycerol kinase gamma | OBESITY | 89.1 | 6.36 | ND | ND |
| GNPDA2 | Glucosamine-6-phosphate isomerase 2 | OBESITY | 31.0 | 6.45 | Yes | Down |
| NCR3 | Natural cytotoxicity triggering receptor 3 | OBESITY | 19.2 | 8.91 | ND | ND |
| AIF1 | Allograft inflammatory factor 1 | OBESITY | 16.7 | 5.97 | Yes | Down |
| NAMPT | Nicotinamide phosphoribosyltransferase | OBESITY | 55.5 | 6.69 | Yes | Down(ND) |
| MTMR9 | Myotubularin-related protein 9 | OBESITY | 63.4 | 5.98 | Yes | Down(ND) |
| LPL | Lipoprotein lipase | OBESITY | 53.1 | 8.37 | Yes | Down |
| PTER | Phosphotriesterase-related protein | OBESITY | 39.0 | 6.07 | ND | ND |
| PFKP | 6-phosphofructokinase | OBESITY | 22.8 | 8.87 | Yes | Down |
| MTCH2 | Mitochondrial carrier homolog 2 | OBESITY | 33.3 | 8.25 | Yes | UP |
| MAF | Transcription factor Maf | OBESITY | 38.4 | 6.44 | ND | UP |
| SH2B1 | SH2B adapter protein 1 | OBESITY | 79.3 | 5.26 | Yes | Down |
| MC4R | Melanocortin receptor 4 | OBESITY | 36.9 | 7.88 | Yes | UP |
| KCTD15 | BTB/POZ domain-containing protein KCTD15 | OBESITY | 31.9 | 7.05 | Yes | Down |
| CTNNBL1 | Beta-catenin-like protein 1 | OBESITY | 85.4 | 5.53 | Yes | Down |
| NOTCH2 | Neurogenic locus notch homolog protein 2 | T2DM | 132.1 | 4.65 | Yes | = |
| THADA | Thyroid adenoma-associated protein | T2DM | 219.6 | 5.71 | Yes | Down |
| PPARG | Peroxisome proliferator-activated receptor gamma | T2DM | 57.6 | 5.61 | Yes | Down |
| ADAMTS9 | A disintegrin & metalloproteinase with thrombospondin motifs 9 | T2DM | 216.4 | 8.13 | Yes | = |
| IGF2BP2 | Insulin-like growth factor 2 mRNA-binding protein 2 | T2DM | 66.1 | 8.48 | Yes | Down |
| WFS1 | Wolframin | T2DM | 100.2 | 8.34 | Yes | Down |
| CDKAL1 | Threonylcarbamoyladenosine tRNA methylthiotransferase | T2DM | 65.1 | 7.2 | Yes | = |
| JAZF1 | Juxtaposed with another zinc finger protein 1 | T2DM | 27.0 | 8.63 | Yes | Down(ND) |
| SLC30A8 | Zinc transporter 8 | T2DM | 40.7 | 6.11 | ND | UP |
| CDKN2A | Cyclin-dependent kinase inhibitor 2A, isoform 4 | T2DM | 61.1 | 9.13 | Yes | Down |
| CDKN2B | Cyclin-dependent kinase inhibitor 2B, isoform 4 | T2DM | 14.7 | 6.08 | Yes | Down |
| CDC123 | Cell division cycle protein 123 homolog | T2DM | 32.1 | 4.63 | Yes | Down |
| CAMK1D | Calcium/calmodulin-dependent protein kinase type 1D | T2DM | 42.9 | 6.77 | Yes | Down |
| HHEX | Hematopoietically-expressed homeobox protein HHEX | T2DM | 23.9 | 7.10 | ND | ND |
| TCF7L2 | Transcription factor 7-like 2 | T2DM | 63.4 | 9.03 | Yes | Down(ND) |
| KCNJ11 | ATP-sensitive inward rectifier potassium channel 11 | T2DM | 43.5 | 8.15 | ND | ND |
| TSPAN8 | Tetraspanin-8 | T2DM | 26.4 | 5.48 | Yes | = |
| LGR5 | Leucine-rich repeat-containing G-protein coupled receptor 5 | T2DM | 99.9 | 6.12 | Yes | Down(ND) |
| FTO | Alpha-ketoglutarate-dependent dioxygenase FTO | T2DM | 58.2 | 5.10 | Yes | Down |
| HNF1B | Protein regulator of cytokinesis 1 | T2DM | 61.3 | 7.39 | ND | ND |
| PRC1 | Glucokinase regulatory protein | T2DM | 71.6 | 6.29 | Yes | Down |
| GCKR | Transmembrane protein 195 | T2DM | 68.6 | 6.24 | Yes | Down(ND) |
| TMEM195 | Alkylglycerol monooxygenase | T2DM | 51.5 | 7.75 | Yes | UP |
| ZFAND6 | AN1-type zinc finger protein 6 | T2DM | 22.5 | 6.87 | Yes | Down(ND) |
| KCNJ6 | G protein-activated inward rectifier potassium channel 2 | T2DM | 48.4 | 5.24 | Yes | UP |
| CREB5 | Cyclic AMP-responsive element-binding protein 5 | T2DM | 56.9 | 8.76 | Yes | Down |
| PRDM6 | Putative histone-lysine N-methyltransferase PRDM6 | T2DM | 64.4 | 7.93 | Yes | = |
| GULP1 | PTB domain-containing engulfment adapter protein 1 | T2DM | 34.4 | 8.04 | Yes | UP |
| MTNR1B | Melatonin receptor type 1B | T2DM | 40.1 | 9.12 | ND | UP |
Gene name, gene description, pI (isoelectric focusing point), the Molecular weight (Mw) and the mRNA expression of each studied gene were shown in this table. Other abbreviations and symbols are: ND (not detectable), Down (down-regulation), UP (Up-regulation) and = (equal mRNA expression of that gene was observed for adipocytes (control) and upon SPIONs treatment. The Mw was expressed in kDa. pI was resulted from whole amino acid sequence of each protein and derived from www.expasy.org.
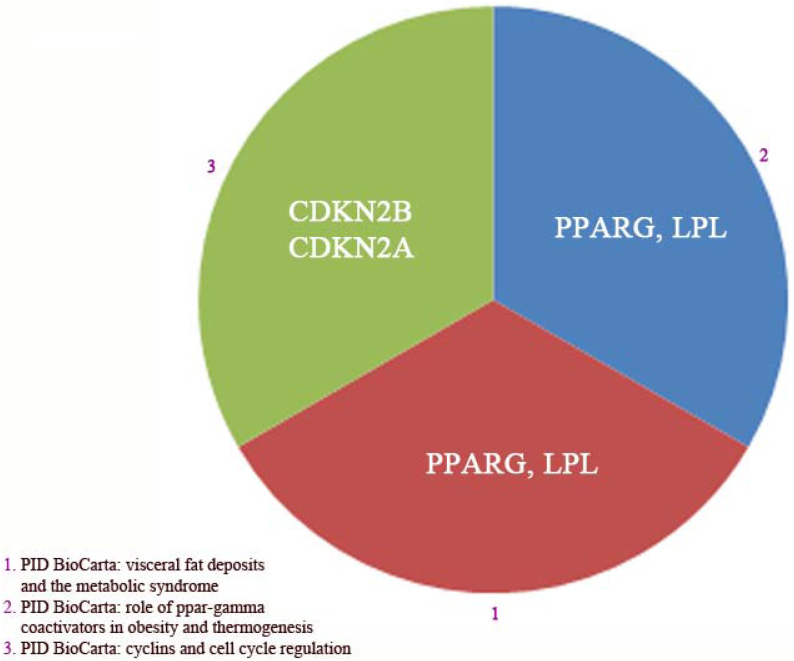
Figure 9. Enriched functional pathways related to a combined set of the 22 and 29 genes found by GWAS as risk genes for obesity and type 2 diabetes (T2D) respectively.
Only pathways with corrected p-values < 0.05 are presented. Pathway Interaction Database (PID) BioCarta was found significant. All three pathways were found by PID BioCarta database. The identified genes responsible for these three pathways are CDKN2A, CDKN2B, PPARγ and LPL (see also table 1).
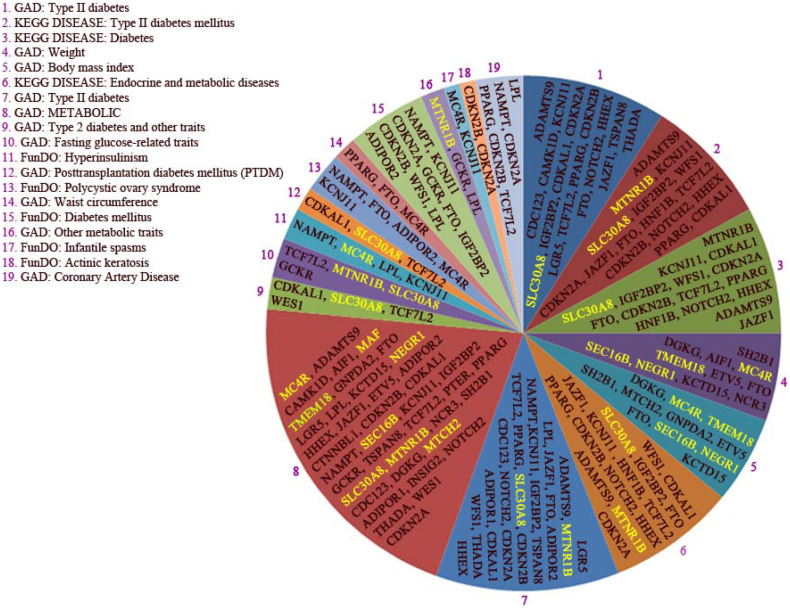
Figure 10. Enriched disorder pathways related to a combined set of the 22 and 29 genes found by GWAS as risk genes for obesity and type 2 diabetes (T2D) respectively.
Only disorders with corrected p-values < 0.05 were included in the analysis. The complete list of gene abbreviations was shown in table 1. Kyoto Encyclopedia of Genes and Genomes (KEGG) pathway Genetic Association Database (GAD), and Functional disease ontology (FunDO) were found significant. The databases used in this combined set was, PIDcurated PID reactome, BioCyc, Reactome and Protein Analysis through Evolutionary Relationships (Panther) pathway databases and KEGG.
KOBAS version 2.0 was also applied to detect the functional and disorder pathways in this combined set of genes. As exhibited in Figure 9, unexpectedly, we found only three pathways of which two pathways appeared to have a role in lipid metabolism and one pathway in cell cycle. PPARγ and LPL genes were accounted for lipid metabolism, and CDKN2A and CDKN2B are responsible for cell cycle31,32,33. Upon SPIONs treatment, mRNA expression of LPL and PPARγ severely down-regulated in adipocytes as compared to control adipocytes. Regarding CDKN2A and CDKN2B, as depicted in Figure 3 and 4 they are slightly down-regulated after treatment of adipocytes with SPIONs.
Based on disorder enrichment analysis, we detected 19 hits of which weight, BMI and T2D were considered as the most enriched disease process identified by disorder enrichment analysis, which fits well with the known involvement of these genes in the development of these two diseases as noted by Gene Wide Association study (i.e. GWAS). As depicted in Figure 10, The GAD and KEGG databases analysis (i.e. hit number 1 and 2 respectively) revealed that diabetes (i.e. 18 from 25 genes found in hit 1, and 16 from 19 genes detected in hit 2) and weight (i.e. 11 from 19 genes identified by GAD database analysis; hit number 4) as well as BMI (i.e. 11 from 23 genes screened in this database; hit number 5) are the most enriched disease pathways. T2D covered approximately 75–80% of this disease pathway and weight/BMI showed pathway coverage of about 50%. The disorder analysis obesity-associated genes are also involved in the human polycystic ovary syndrome. Disorder T2D was identified by GAD database (i.e. hit number 1) includes 18 genes of which, upon SPIONs treatment, 7 genes like CDKAL1 were severely, 4 genes slightly such as CDKN2B down-regulated. However, the expression of 4 genes was remained unchanged like ADAMTS9 and two genes (i.e. HHEX and KCNJ11) were not detected, when we compare control adipocytes with SPION adipocytes. Notably, only 1 gene (i.e. SLC30A8) was highly expressed upon SPION treatment as compared to control (Figure 3 and Figure 10). Surprisingly, based on GAD database (hit 5) BMI disorder is the most prominent disease. In this regard, the mRNA expression of 5 genes (MC4R, TMEM18, MTCH2, SEC16B, and NEGR1) was highly up-regulated in SPIONs adipocytes comparing with control adipocytes. DGKG gene was not detected in either state. The rest of genes like FTO were expressed higher in control adipocytes than SPIONs adipocytes (see Table 1 and Figure 10, hit 5).
Differences and similarities between before and after treatment of human adipocytes with SPIONs with respect to mRNA expression
We found the expression of 6 genes from 22 genes-linked with obesity up-regulated after treatment with SPION as compared to control adipocytes. Notably, the mRNA expression of NEGR1, SEC16B and MAF was not detectable and MCR4 was just detected as traces (Figure 3 and table 1), indicating that 30% of the obesity genes were up-regulated after treatment of the cells with SPIONs. Whereas, the mRNA of INSIG2, NAMPT, and MTMR9 were not detectable upon treatment of adipocytes with SPIONs as compared to control cells. In addition, three genes (i.e. DGKG, NCR3, and PTER) were not expressed in both states; upon SPION treatment and control. Finally, the rest of obesity-associated genes were shown to have a higher mRNA expression in control adipocytes than adipocytes after SPIONs treatment.
We observed an equal mRNA expression of NOTCH2, ADAMTS9, CDKAL1, TSPAN8 and PRDM6 (as a part of T2D-associated genes) for both control and SPION adipocytes. There was no mRNA expression observed for HHEX, HNF1B and KCNJ11 for either state. As depicted in Table 1 and Figure 4, mRNA expression of the following genes MTNR1B, GULP1, KCNJ6, CDKN2B, and TMEM195 were found to be higher in human adipocytes upon SPIONs treatment than control adipocytes. The remaining genes from T2D cluster genes showed a higher mRNA expression in control adipocytes than SPION adipocytes.
Discussion
An imbalance or dysfunction of adipocytes leads to obesity. Obesity is linked with metabolic disorders and in particular insulin resistance, T2D, and the prevalence of these diseases are increasing worldwide2. As SPIONs have several unique properties that maintain various medical applications such as drug delivery, transfection, and imaging34, we studied the effect of SPIONs on the expression of the 22 and 29 genes-associated with obesity and T2D in human adipocytes respectively.
In order to mitigate any agglomeration of SPIONs and avoid possible shape related interference with our design15, we used CES grafted SPIONs to stabilize particles and avoid agglomeration. The results of VSM and relaxometry analysis confirmed the superparamagnetic behavior along with success of coating. In fact, slight increase in magnetic saturation and relaxivity can be attributed to the increase of the weight and volume of magnetite nanoparticles after grafting with CES35,36.
The reason why we have chosen these specific genes to study the effect of SPIONs is that these genes were found to be associated with obesity and T2D in several and large genome-wide association studies (GWAS). Moreover, all these genes were also validated by single nucleotide polymorphisms (SNPs)37.
For the functional pathway and disorder analysis in the current study, we include many databases. The increase of number of databases ensures the reduction of the chance for missing pathway(s). That was the reason why we applied multiple databases to detect the potential functional and disorder pathways link to the genes associated with obesity and T2D.
The pathway analysis ended to four functional pathways with ADIPOR1 and R2 as well as LPL as major genes in these pathways. These three genes play an important role in lipid metabolism and all function as anti T2D31,38,39,40,41 and a reduction of these three genes contributes to the metabolic dysfunction and its associated disorders as consequences. However, all these three genes were down-regulated upon SPION treatment. This may mean that SPIONs has a disadvantage in this context. Interestingly, mRNA expression of 5 genes was found to be highly up-regulated upon SPIONs treatment of adipocytes, and the concrete function of some of them still under investigation. However, MTCH2 is involved in the depolarization of mitochondria42. Two scenarios is possible 1- upon SPIONs treatment, MTCH2 gene expresses very high, which in turn lead to the depolarization of mitochondria and as consequence the leaking of mitochondria membrane, and 2- if the first option is true; that means that SPIONs may enter the cell and may subsequently enter to the mitochondria.
The functions of GULP1 are to assist the phagocytosis of the apoptotic cells and also modulate the cholesterol transport43. Intriguingly, mRNA of GULP1 was highly expressed in SPIONs adipocytes as compared to control. In obese adipocytes, the efficiency of mitochondria function is reduced, long chain fatty acids will be accumulated within adipocytes. ATMs are meant to phagocyte the not functional components of the cells. It is already present reports that SPIONs produce ROS44. Thus, it may then logic to assume that SPIONs produce ROS, which, in turn, affect the mRNA expression of GULP1 that possibly contributes to the function of macrophages in the phagocytosis of apoptotic cells43. Thus, we are allowed to assume that this effect of SPIONs is a positive effect.
T2D-associated genes showed four functional pathways, which pointed to the cell cycle with the involvement of the following PPARγ, TCF7L2, CDKN2A, and CDKN2B genes. Notably, all these four genes from slightly to severely down-regulated in SPIONs adipocytes, indicating that cell cycle damage may contribute to the development of T2D and the use of SPIONs in biological application may affect the regulation of cell cycle31. Interestingly, we found that the most of genes associated with the risk for T2D were down-regulated after treatment of adipocytes with SPIONs and only one gene (i.e. SLC30A8) was up-regulated, which ensure the transport of accumulated Zinc to the intracellular vesicles45. Thus, SPIONs appeared to affect the expression of this gene. It must be noted that the function of some of these genes remained to be completed or to be under the investigations.
Surprisingly, after the combination of two clusters of genes, we observed only three pathways pointed to AT and cell cycle. This indicates that not only the role of adipocytes cannot be ignored in the development of obesity but also cell cycle may be a target of intervention for the therapy of these metabolic disorders. As it is already established, PPARγ and LPL are considered as anti-aging-related diseases such as T2D and atherosclerosis32,46,47,48. Based on this finding, we may cautiously assume that SPIONs may behave as pro-aging-linked disorders rather than anti-aging-related diseases.
Based on this study, we found that SPIONs play clearly a crucial role in the expression of the selected genes based on GWAS. The expression of some genes increases, while the expression of other genes decreased when we treated the adipocytes with SPIONs. Moreover, SPIONs may play dual roles (i.e. positive and negative). Also, the application of SPIONs in human primary adipocytes as an established model for the study of energy metabolism provides us more knowledge about these types of NPs. We may cautiously conclude that SPIONs influence the gene expression of lipid and glucose metabolism. Thus, the effect of SPIONs must be extended to other cells in vitro and in particular in vivo. Also the interaction between SPIONs and adipocytes-secreted proteins must be investigated in future to gain more knowledge about the protein content of Corona (surface of SPIONs coated with proteins), which helps us to understand better the role of SPIONs in Nano- Biological application. We also find that the link between SPIONs, mitochondria, and adipocytes must not be ignored.
Methods
FeCl2.4H2O, FeCl3.6H2O, diethylene glycol, o-(2-aminoethyl)-o'-methylpolyethylene glycol (PEG-NH2, MW = 750), and N,N-dimethylformamide (DMF) were purchased from Sigma-Aldrich, Germany. Carboxyethylsilanetriol (CES) was granted by Wacker-Chemie GmbH, Burghausen, Germany. Preadipocytes were purchased from LONZA (Belgium). All media and supplements for differentiation of the preadipocytes were provided by LONZA and PromoCell (Germany).
Synthesis of SPIONs
In order to obtain nanoparticles with a narrow size distribution, the polyol-method was employed49. Briefly, 5 mL of an aqueous solution of FeCl2.4H2O (0.045 M) and FeCl3.6H2O (0.0375 M) were added to 250 mL of diethyleneglycol. The mixture was heated to 170°C and maintained at this temperature for 15 min before addition of the base (i.e. solid NaOH (0.375 M). Subsequently, temperature was maintained at 170°C for a period of 1 h before cooling to 60°C. The synthesized SPIONs were collected with a neodymium magnet and washed with 100 mL of a HNO3 (1 M) solution.
Grafting of SPIONs with Carboxyethylsilanetriol (CES)
CES was grafted on the surfaces of SPIONs, as described elsewhere49. Briefly, 100 ml of nanoparticle solution (0.3 M iron) was added to 100 ml DMF and 45 ml of 0.15 M CES was slowly added before adding 25 ml water followed by 15 ml of NaOH solution (1 M) at room temperature and under homogenization (about 8000–24,000 rpm). The solution was heated to 100°C for 24 h under continuous stirring. The SPIONs were precipitated by addition of acetone/ether (50/50) mixture and collected with neodymium magnet. The precipitate was washed with acetone several times and finally dispersed in water. Excess of silane derivative and other chemicals were removed by dialysis using a dialysis bag (Spectrum Laboratories, Inc; MWCO = 10000) for 48 h in water.
Characterizations of SPIONs
Fourier transform infrared (FTIR) spectra were collected using a PerkinElmer Spectrum 100 spectrometer in the range of 4000–650 cm−1, and each spectrum was obtained by averaging 32 interfere grams with a resolution of 4 cm−1. Samples for FTIR analysis were prepared by lyophilizing SPION suspensions in water and a thin film of lyophilized SPIONs was placed on the attenuated total reflectance crystal for spectral recording.
The magnetization of the SPIONS in a variable magnetic field was measured using a vibrating-sample magnetometer (VSM) with a sensitivity of 10−3 emu and a maximum magnetic field of 10 kOe. The magnetic field was changed uniformly at a rate of 66 Oe/s.
The morphology and size of the particles was investigated using transmission electron microscopy (TEM),( ZEISS, EM-10C, Germany) operating at 100 kV. For sample preparation, a drop of the SPOIN suspension was placed on a copper grid and was dried under vacuum. Phase characterization was accomplished using the XRD (X-ray powder diffraction, Siemens, D5000, Germany) technique with Cu KR radiation, and the Scherrer method was used for particle size determination.
All these relexometric measurements were performed at room temperature. In the plot shown in this work, the magnetic field is expressed in terms of the proton Larmor frequency. The results are represented in terms of longitudinal relaxivities.
Cell culture
Human primary preadipocytes (Lonza) were culture to confluence in growth media provided by PromoCell in 5% CO2 at 37°C. When the cells reached confluence, the growth media were removed and replaced with preadipocyte differentiation FCS free media supplemented with (provided by promoCell) of 0.5 mM 3-isobutyl-1-methyxanthine, 400 ng/ml dexamethasone, 0.5 ug/ml bovine insulin, L-thyroxin 9 ng/ml, ciglitazone 3 ug/ml and d-biotin 8 ug/ml for 72 hours. After Three days, the differentiation media were removed and replaced with adipocyte nutrition medium containing 3% FCS, d-biotin 8 ug/ml, 0.5 ug/ml bovine insulin, and 400 ng/ml dexamethasone for a period of 16 days (terminal phase of differentiation). After maturation of adipocytes, the nutrition media were and the cells were washed 5 times with the differentiation FCS free media. After wash steps, the cells were incubated with the differentiation media with and without SPION for 30 h. Then the cells were washed with PBS for 5 times. Then the cells were lyzed and total RNA were extracted. The characterization of the cells was already established2,50,51,52.
mRNA expression array
Total RNA was extracted from human primary adipocytes cultured in 6 wells (9 cm2). The quality and concentration of the RNA were determined by Bioanalyser using the Agilent RNA 6000 Nano kit (Agilent, The Netherlands).
Total Prep RNA Amplification Kit was used to amplify and label the RNA. (Applied Biosystems, The Netherlands). Total RNA was used to make cDNA and the concentrations were determined in nanodrop. cRNA was used to Biotinylate applying RNA Amplification Kit (Ambion, Inc., Austin, TX) according to the manufacturer's instructions starting with 200 ng total RNA. Samples were purified using the RNeasy kit (Qiagen, Valencia, CA). Hybridization to the Sentrix HumanRef-12 Expression BeadChip array (Illumina, San Diego, CA, USA), washing, and scanning were performed according to the Illumina BeadStation 500 manual (revision C). One BeadChip with twelve arrays were used. Slide was scanned immediately.
After the scanning, the following steps were performed: 1- quality check, 2- background correction, and utile normalization of the data using Beadstudio Expression module v 3.2.7. and 3- Statistics and the generation of gene lists using Genespring GX 7.3.1 (Agilent). P-values were corrected for multiple testing using Benjamini and Hochberg False Discovery Rates.
Functional and disorder pathway analysis
KOBAS version 2.0 combined with hypergeometric test and Benjamini-Hochberg FDR correction were performed to screen the enriched pathways and disorders, which obesity- and T2D-associated genes may have a role53.
Author Contributions
F.R. designed, supervised and coordinated the study. F.R. and S.S. wrote the paper. All authors; S.S., S.D., M.M.M., B.B., B.S., A.K., A.R., S.L., M.P.P., F.R. performed the experiments. All authors; S.S., S.D., M.M.M., B.B., B.S., A.K., A.R., S.L., M.P.P., F.R. participated in the analyzing data and contributed to the editing of the paper.
References
- Xu H. et al. Chronic inflammation in fat plays a crucial role in the development of obesity-related insulin resistance. J Clin Invest 112, 1821–1830 (2003). [DOI] [PMC free article] [PubMed] [Google Scholar]
- Meijer K. et al. Human primary adipocytes exhibit immune cell function: adipocytes prime inflammation independent of macrophages. PLoS One 6, e17154 (2011). [DOI] [PMC free article] [PubMed] [Google Scholar]
- Calabro P. et al. Adipose tissue-mediated inflammation: the missing link between obesity and cardiovascular disease? Intern Emerg Med 4, 25–34 (2009). [DOI] [PubMed] [Google Scholar]
- Kahn B. B. & Flier J. S. Obesity and insulin resistance. J Clin Invest 106, 473–481 (2000). [DOI] [PMC free article] [PubMed] [Google Scholar]
- Nadler S. T. et al. The expression of adipogenic genes is decreased in obesity and diabetes mellitus. Proc Natl Acad Sci U S A 97, 11371–11376 (2000). [DOI] [PMC free article] [PubMed] [Google Scholar]
- Scherer P. E. Adipose tissue: from lipid storage compartment to endocrine organ. Diabetes 55, 1537–1545 (2006). [DOI] [PubMed] [Google Scholar]
- Weisberg S. P. et al. Obesity is associated with macrophage accumulation in adipose tissue. J Clin Invest 112, 1796–1808 (2003). [DOI] [PMC free article] [PubMed] [Google Scholar]
- Zeyda M. et al. Human adipose tissue macrophages are of an anti-inflammatory phenotype but capable of excessive pro-inflammatory mediator production. Int J Obes (Lond) 31, 1420–1428 (2007). [DOI] [PubMed] [Google Scholar]
- Bell C. G., Walley A. J. & Froguel P. The genetics of human obesity. Nat Rev Genet 6, 221–234 (2005). [DOI] [PubMed] [Google Scholar]
- O'Rahilly S., Barroso I. & Wareham N. J. Genetic factors in type 2 diabetes: the end of the beginning? Science 307, 370–373 (2005). [DOI] [PubMed] [Google Scholar]
- Takamura T. et al. Obesity upregulates genes involved in oxidative phosphorylation in livers of diabetic patients. Obesity (Silver Spring) 16, 2601–2609 (2008). [DOI] [PubMed] [Google Scholar]
- Bradfield J. P. et al. A genome-wide association meta-analysis identifies new childhood obesity loci. Nat Genet 44, 526–531 (2012). [DOI] [PMC free article] [PubMed] [Google Scholar]
- Choi J. K. & Kim S. C. Environmental effects on gene expression phenotype have regional biases in the human genome. Genetics 175, 1607–1613 (2007). [DOI] [PMC free article] [PubMed] [Google Scholar]
- Mahmoudi M., Azadmanesh K., Shokrgozar M. A., Journeay W. S. & Laurent S. Effect of nanoparticles on the cell life cycle. Chem Rev 111, 3407–3432 (2011). [DOI] [PubMed] [Google Scholar]
- Sharifi S. et al. Toxicity of nanomaterials. Chem Soc Rev 41, 2323–2343 (2012). [DOI] [PMC free article] [PubMed] [Google Scholar]
- Monopoli M. P. et al. Physical-chemical aspects of protein corona: relevance to in vitro and in vivo biological impacts of nanoparticles. J Am Chem Soc 133, 2525–2534 (2011). [DOI] [PubMed] [Google Scholar]
- Walczyk D., Bombelli F. B., Monopoli M. P., Lynch I. & Dawson K. A. What the cell "sees" in bionanoscience. J Am Chem Soc 132, 5761–5768 (2010). [DOI] [PubMed] [Google Scholar]
- Hauck T. S., Ghazani A. A. & Chan W. C. Assessing the effect of surface chemistry on gold nanorod uptake, toxicity, and gene expression in mammalian cells. Small 4, 153–159 (2008). [DOI] [PubMed] [Google Scholar]
- Rahman M. F. et al. Expression of genes related to oxidative stress in the mouse brain after exposure to silver-25 nanoparticles. Toxicol Lett 187, 15–21 (2009). [DOI] [PubMed] [Google Scholar]
- Shimizu M. et al. Maternal exposure to nanoparticulate titanium dioxide during the prenatal period alters gene expression related to brain development in the mouse. Part Fibre Toxicol 6, 20 (2009). [DOI] [PMC free article] [PubMed] [Google Scholar]
- Bulte J. W., Duncan I. D. & Frank J. A. In vivo magnetic resonance tracking of magnetically labeled cells after transplantation. J Cereb Blood Flow Metab 22, 899–907 (2002). [DOI] [PubMed] [Google Scholar]
- Bulte J. W. et al. Magnetodendrimers allow endosomal magnetic labeling and in vivo tracking of stem cells. Nat Biotechnol 19, 1141–1147 (2001). [DOI] [PubMed] [Google Scholar]
- Lewin M. et al. Tat peptide-derivatized magnetic nanoparticles allow in vivo tracking and recovery of progenitor cells. Nat Biotechnol 18, 410–414 (2000). [DOI] [PubMed] [Google Scholar]
- Dave S. R. & Gao X. Monodisperse magnetic nanoparticles for biodetection, imaging, and drug delivery : a versatile and evolving technology. Wiley Interdiscip Rev Nanomed Nanobiotechnol 1, 583–609 (2009). [DOI] [PubMed] [Google Scholar]
- Mahmoudi M., Simchi A., Imani M. & Häfeli U. O. Superparamagnetic Iron Oxide Nanoparticles with Rigid Cross-linked Polyethylene Glycol Fumarate Coating for Application in Imaging and Drug Delivery. The Journal of Physical Chemistry C 113, 8124–8131 (2009). [Google Scholar]
- Unfried K. et al. Cellular responses to nanoparticles: Target structures and mechanisms. Nanotoxicology 1, 52–71 (2007). [Google Scholar]
- Moller P. et al. Role of oxidative damage in toxicity of particulates. Free Radic Res 44, 1–46 (2010). [DOI] [PubMed] [Google Scholar]
- Nel A., Xia T., Madler L. & Li N. Toxic potential of materials at the nanolevel. Science 311, 622–627 (2006). [DOI] [PubMed] [Google Scholar]
- Chrysohoou C. et al. The implication of obesity on total antioxidant capacity in apparently healthy men and women: the ATTICA study. Nutr Metab Cardiovasc Dis 17, 590–597 (2007). [DOI] [PubMed] [Google Scholar]
- Esposito K. et al. Oxidative stress in the metabolic syndrome. J Endocrinol Invest 29, 791–795 (2006). [DOI] [PubMed] [Google Scholar]
- Quelle D. E., Zindy F., Ashmun R. A. & Sherr C. J. Alternative reading frames of the INK4a tumor suppressor gene encode two unrelated proteins capable of inducing cell cycle arrest. Cell 83, 993–1000 (1995). [DOI] [PubMed] [Google Scholar]
- Enerback S., Ohlsson B. G., Samuelsson L. & Bjursell G. Characterization of the human lipoprotein lipase (LPL) promoter: evidence of two cis-regulatory regions, LP-alpha and LP-beta, of importance for the differentiation-linked induction of the LPL gene during adipogenesis. Mol Cell Biol 12, 4622–4633 (1992). [DOI] [PMC free article] [PubMed] [Google Scholar]
- Ristow M., Muller-Wieland D., Pfeiffer A., Krone W. & Kahn C. R. Obesity associated with a mutation in a genetic regulator of adipocyte differentiation. N Engl J Med 339, 953–959 (1998). [DOI] [PubMed] [Google Scholar]
- Mahmoudi M., Sant S., Wang B., Laurent S. & Sen T. Superparamagnetic iron oxide nanoparticles (SPIONs): development, surface modification and applications in chemotherapy. Adv Drug Deliv Rev 63, 24–46 (2011). [DOI] [PubMed] [Google Scholar]
- Mahmoudi M., Simchi A., Imani M., Milani A. S. & Stroeve P. Optimal Design and Characterization of Superparamagnetic Iron Oxide Nanoparticles Coated with Polyvinyl Alcohol for Targeted Delivery and Imaging. J Phys Chem B 112, 14470–14481 (2008). [DOI] [PubMed] [Google Scholar]
- LaConte L. E. et al. Coating thickness of magnetic iron oxide nanoparticles affects R2 relaxivity. J Magn Reson Imaging 26, 1634–1641 (2007). [DOI] [PubMed] [Google Scholar]
- Tsai F.-J. et al. A Genome-Wide Association Study Identifies Susceptibility Variants for Type 2 Diabetes in Han Chinese. PLoS Genet 6, e1000847 (2010). [DOI] [PMC free article] [PubMed] [Google Scholar]
- Yamauchi T. et al. Cloning of adiponectin receptors that mediate antidiabetic metabolic effects. Nature 423, 762–769 (2003). [DOI] [PubMed] [Google Scholar]
- Kotronen A. et al. Genetic variation in the ADIPOR2 gene is associated with liver fat content and its surrogate markers in three independent cohorts. Eur J Endocrinol 160, 593–602 (2009). [DOI] [PubMed] [Google Scholar]
- Benlian P. et al. Premature atherosclerosis in patients with familial chylomicronemia caused by mutations in the lipoprotein lipase gene. New Engl J Med 335, 848–854 (1996). [DOI] [PubMed] [Google Scholar]
- Chan L. Y. et al. Genotype-phenotype studies of six novel LPL mutations in Chinese patients with hypertriglyceridemia. Hum Mutat 20, 232–233 (2002). [DOI] [PubMed] [Google Scholar]
- Yerushalmi G. M., Leibowitz-Amit R., Shaharabany M. & Tsarfaty I. Met-HGF/SF signal transduction induces mimp, a novel mitochondrial carrier homologue, which leads to mitochondrial depolarization. Neoplasia 4, 510–522 (2002). [DOI] [PMC free article] [PubMed] [Google Scholar]
- Smits E., Van Criekinge W., Plaetinck G. & Bogaert T. The human homologue of Caenorhabditis elegans CED-6 specifically promotes phagocytosis of apoptotic cells. Curr Biol 9, 1351–1354 (1999). [DOI] [PubMed] [Google Scholar]
- Singh N., Jenkins G. J., Asadi R. & Doak S. H. Potential toxicity of superparamagnetic iron oxide nanoparticles (SPION). Nano Rev 1 (2010). [DOI] [PMC free article] [PubMed] [Google Scholar]
- Chimienti F. et al. In vivo expression and functional characterization of the zinc transporter ZnT8 in glucose-induced insulin secretion. J Cell Sci 119, 4199–4206 (2006). [DOI] [PubMed] [Google Scholar]
- Ristow M., Muller-Wieland D., Pfeiffer A., Krone W. & Kahn C. R. Obesity associated with a mutation in a genetic regulator of adipocyte differentiation. New Engl J Med 339, 953–959 (1998). [DOI] [PubMed] [Google Scholar]
- Mukherjee R., Jow L., Croston G. E. & Paterniti J. R. Jr Identification, characterization, and tissue distribution of human peroxisome proliferator-activated receptor (PPAR) isoforms PPARgamma2 versus PPARgamma1 and activation with retinoid X receptor agonists and antagonists. J Biol Chem 272, 8071–8076 (1997). [DOI] [PubMed] [Google Scholar]
- Yin Y. Z. et al. 3-Phosphoinositide-dependent protein kinase-1 activates the peroxisome proliferator-activated receptor-gamma and promotes adipocyte differentiation. Mol Endocrinol 20, 268–278 (2006). [DOI] [PubMed] [Google Scholar]
- Forge D. et al. Optimization of the Synthesis of Superparamagnetic Contrast Agents by the Design of Experiments Method. The Journal of Physical Chemistry C 112, 19178–19185 (2008). [Google Scholar]
- Xu Z., Liu Q. & Finch J. A. Silanation and stability of 3-aminopropyl triethoxy silane on nanosized superparamagnetic particles: I. Direct silanation. Applied Surface Science 120, 269–278 (1997). [Google Scholar]
- Dashty M. et al. Characterization of coagulation factor synthesis in nine human primary cell types. Sci Rep 2, 787 (2012). [DOI] [PMC free article] [PubMed] [Google Scholar]
- Queiroz K. C. et al. Human plasma very low density lipoprotein carries Indian hedgehog. J Proteome Res 9, 6052–6059 (2010). [DOI] [PubMed] [Google Scholar]
- Xie C. et al. KOBAS 2.0: a web server for annotation and identification of enriched pathways and diseases. Nucleic Acids Res 39, W316–322 (2011). [DOI] [PMC free article] [PubMed] [Google Scholar]


