

Abstract
Magnetization transfer (MT) imaging provides a unique method of tissue characterization by capitalizing on the interaction between solid-like tissue components and bulk water. We used a continuous-wave MT pulse sequence with low irradiation power to study healthy human brains in vivo at 3 T and quantified the asymmetry of the MT effects with respect to the water proton frequency. This asymmetry was found to be approximately a few percent difference of the water signal intensity, depending on both the RF irradiation power and the frequency offset. The experimental results could be quantitatively described by a modified two-pool MT model extended with a shift contribution for the semi-solid pool with respect to water. For white matter, this shift was fitted to be 2.34 ± 0.17 ppm (n = 5) upfield from the water signal.
Keywords: magnetization transfer, MT, z-spectrum, asymmetry, CEST, amide proton transfer, human brain
The magnetization transfer (MT) phenomenon in biological tissues provides a unique method of tissue characterization reflecting the interaction between the solid-like, macromolecular phase protons, such as those in protein matrices and cell membranes, and the bulk water (1-7). The magnitude of the MT effects is described by the so-called MT ratio (MTR), in which (1-MTR) is equal to the ratio of water signal intensities with and without off-resonance irradiation. The MT spectrum or z-spectrum (3) is a curve, in which (1-MTR) is plotted as a function of the frequency offset of the radiofrequency (RF) irradiation. Determination of the actual center of a z-spectrum is difficult due to the direct saturation of water at the water frequency, and it appears as if the center of the z-spectrum is always assigned to water. However, it has been shown previously (8-12) that the z-spectra associated with solid-like macromolecules in tissue are slightly asymmetric around the water proton resonance frequency, with the center of the z-spectrum shifted slightly upfield (lower frequency) from the water signal. These previous measurements were conducted under a wide range of experimental conditions, including on humans at 1.5 T (9), on cats at 4.7 T (8,10), on rats at 4.7 T (12), and on phantoms at 14 T (11). The intrinsic asymmetry of MT around the chemical shift of the water resonance has been attributed to the chemical shift center mis-match between bulk water and solid-like macromolecules in tissue (10,11).
The asymmetry of the MT effects around the water resonance complicates some MRI experiments. For example, it has substantial influence on the accuracy of perfusion quantification in continuous-wave arterial spin labeling (CASL) techniques (13,14), unless proper compensation schemes are used (8,15). This MT asymmetry is also responsible for the negative background signal detected when asymmetry analysis of z-spectra is used to quantify concurrent amide proton transfer (APT) effects in vivo associated with endogenous mobile proteins and peptides in tissue (12,16-18). The effect of APT is a type of MT phenomena in tissue and ignored in most of the previous MT studies. For the sake of clarity, we call the MT effects between bulk water and semi-solid macromolecules “conventional MT”. In this paper, we measure the MT asymmetry in healthy human brains in vivo at 3 T and study its pulse sequence dependence, especially the power and frequency offset dependence. The experimental results are analyzed using a two-pool MT model extended with a chemical shift difference between the semi-solid and bulk water pool. Finally, we discuss the necessity of minimizing the MTR asymmetry for some quantitative MRI experiments and the possibility of exploiting the MTR asymmetry as a new measure for tissue characterization.
Materials and Methods
Theory
The asymmetry of conventional MT about the water resonance could arise from a shift difference between the solid-like macromolecular chemical shift center and the bulk water resonance (10,11), which can be described by a modification to Henkelman's two-pool MT theory (19). In addition to the original five parameters , we add a new parameter, Δmw, to depict the difference between the chemical shifts of the solid-like macromolecule pool (m) and the bulk water pool (w). Table 1 summarizes the physical meaning of each variable in this model. Similar to Henkelman's original model, R is a fundamental rate constant. To get the pseudo-first-order rate constants, it should be multiplied by the relative pool sizes, i.e., RM0m for exchange from the water pool to macromolecule pool and RM0w for the reverse direction. M0w is assumed to be 1 as a result of normalization. As done by Henkelman et al. (19-21), we derive a six-parameter model to calculate the steady-state longitudinal magnetization of the free water pool. The results are:
Table 1.
Physical meaning and units of variables in the six-parameter MT model.
| R1w | Spin-lattice relaxation rate of bulk water pool, s-1 |
| R1m | Spin-lattice relaxation rate of solid-like macromolecule pool, s-1 |
| T2w | Spin-spin relaxation time of bulk water pool, ms |
| T2m | Spin-spin relaxation time of solid-like macromolecule pool, μs |
| Δw | Frequency offset for bulk water pool, ppm |
| Δm | Frequency offset for solid-like macromolecule pool, ppm |
| Δmw | Frequency difference between solid-like macromolecule pool and bulk water pool, ppm |
| R | Exchange rate between bulk water pool and solid-like macromolecule pool, s-1 |
| M0w | Equilibrium magnetization of bulk water pool |
| M0m | Equilibrium magnetization of solid-like macromolecule pool |
| ω1 | RF irradiation power level, μT |
| [1] |
where Rrfm is the rate of loss of longitudinal magnetization of the solid-like, macromolecular pool due to off-resonance irradiation, and is related to gm(2πΔm), the absorption lineshape of the macromolecular spins:
| [2] |
| [3] |
| [4] |
where θ is the angle between the external magnetic field and the axis of molecular orientation. Instead of the Lorentzian lineshape that directly results from the Bloch formalism, it is reported that the super-Lorentzian lineshape in Eq. [4] best fits biological tissues (6,20,21). The six model parameters can be fitted from experimental data with sufficient data points and a global fitting procedure (19). As suggested by previous studies (6,19,20,22,23), the parameter R1m (spin-lattice relaxation rate of solid-like macromolecule pool), which is not sensitive to the fitting, is fixed to be 1 s-1.
We define the MT asymmetry as the difference between the MTR values at the positive offsets and the corresponding negative offsets with respect to water:
| [5] |
In the extreme cases, i) if RF saturation power is 0, no MT asymmetry exists, and ii) if RF saturation power were infinite, no MRI signal could be detected and the amplitude of the MT asymmetry would also be zero. Thus, there exists a characteristic RF saturation power (ω1c) that maximizes the MT asymmetry. Using the modified Henkelman's model, the analytical expression of ω1c as a function of RF irradiation offset can be derived to be (see Appendix 1):
| [6] |
where
| [7] |
| [8] |
| [9] |
Once the characteristic RF irradiation power ω1c is calculated by Eq. [6] using the in vivo fitted model parameters, it can be put back into Eqs. [1-5] to estimate the maximal amplitude of the conventional MT asymmetry at each frequency offset.
MRI Experiments
MRI experiments were performed on a whole body Philips 3 T Intera scanner (Philips Medical Systems, Best, The Netherlands) using a quadrature head coil for RF transmission and reception. The experimental protocol was approved by the Johns Hopkins University Institutional Review Board (IRB). Five healthy volunteers were scanned after giving written, informed consent. A single slice turbo spin echo (TSE) pulse sequence (TSE factor = 40) was used. Imaging parameters were: TR = 6 s, TE = 30 ms, matrix = 128×128, imaging slice = 5 mm, and FOV = 230×230 mm2. A low-power, continuous-wave (CW) RF saturation (duration = 3 s, block shape) was used for saturation. The power levels of irradiation were chosen to be 0.5, 1, 2, and 3 μT. Extra power levels from 1.5 to 3.5 μT with a step of 0.2 μT were used in two of the volunteers. In this work, the z-spectra were calculated from a set of images with frequency offsets from -80 to 80 ppm in 5 ppm increments. An unsaturated image of intensity M0w was acquired as control and for normalization. The overall scan time for one subject was approximately 40 min (n = 3) or 2 hrs (n = 2). The specific absorption rate (SAR) of the pulse sequence for the highest CW RF irradiation power used was 2.8 W/kg, which is well below the FDA limit for the human brain.
To study the sequence dependence of MT asymmetry, we performed several extra experiments on two of the volunteers. This includes the CW MT sequences with different saturation times (power = 2.3 μT; duration = 3, 1.5, and 0.5 s; other parameters as described above) and two pulsed MT sequences. In the first pulsed experiment (Pulsed 1), instead of CW RF irradiation, a pulse train of 15 Gaussian pulses (length = 115 ms, interval = 85 ms, flip angle = 4135°, total duration = 3 s) was used for pre-saturation. The equivalent power (compared to the block shape) was calculated to be approximately 2.3 μT. All other sequence parameters were kept the same as the CW case. The scan time was 10 min for each subject. The SAR was 1.5 W/kg. In the second pulsed experiment (Pulsed 2), a novel pulsed MT sequence from a recent report (24) was used. This was a 3D-spoiled gradient echo sequence with multi-shot EPI readout (EPI factor = 7). TR/TE/flip angle were 65 ms/15 ms/9°, with a 24.5-ms nonselective five-lobed sinc-gauss MT pulse with peak amplitude of 10.5 μT. In this extra experiment, the quadrature body coil was used for transmission and a 6-channel SENSE head coil was used for reception. The offset frequencies were kept to be the same as all previous experiments. The scan time was 20 min for each subject (70 slices). The SAR was 3.0 W/kg.
Data Processing
MT-weighted images for all of the offsets from each subject were co-registered to the unsaturated image from the same subject using the AIR 5 software package (http://bishopw.loni.ucla.edu/AIR5/). The z-spectrum was defined as the normalized water signal intensity, Mzw/M0w, as a function of RF saturation frequency (3). It is possible that B0 field inhomogeneity may cause spurious frequency shifts in z-spectra and thus affect the measured MT asymmetry. In order to mitigate the field inhomogeneity problems, the z-spectra were interpolated to 1 Hz resolution using a piecewise cubic spline (pixel-by-pixel basis). The minimum of the interpolated z-spectra was assumed to be the water frequency and was shifted to the offset of 0 Hz. The whole curve was then shifted accordingly and the interpolated values were assigned to corresponding frequency offsets after shifting. Because of this shifting, we excluded the two outermost points in z-spectra (corresponding to the highest frequency offsets) from data fitting and the display.
Regions of interest (ROIs) were selected on the unsaturated images covering most of the white matter regions in both the left and right hemispheres (see Fig. 1a). The average signal intensity was then computed for each image within the ROI, which was used later in fitting of the six-parameter model. In all figures the error bars indicate the standard error of the average signal intensities from all subjects. On the other hand, to demonstrate the MT asymmetry effect, z-spectral intensities at corresponding positive and negative offsets (around the water proton resonant frequency) were compared on a pixel-by-pixel basis in the ROIs within participants using a paired two-tail t-test. Each ROI contained more than 500 pixels to ensure an adequate sample size. Bonferoni's correction was employed to mitigate the impact of multiple comparisons, controlling the familywise error rate of 0.05.
Fig. 1.

MT results of white matter in healthy human brains at 3 T (n = 5) after B0 field inhomogeneity correction. a: ROI example. b: z-spectra. The z-spectra are asymmetric with the negative offset side having statistically significant lower intensities (p < 0.001). Data sets with power levels of 0.5, 1, 2 and 3 μT are displayed. c: MTRasym spectra. The magnitude of MTRasym depends on both RF saturation power and offset. The MT asymmetry for 3 μT is initially positive due to the APT effect seen at low ppm offset. d: MT asymmetry curves normalized with MTR showing reduced offset dependence. Data points with MTR values less than two times the noise levels are not shown in the normalized MT asymmetry. e: Representative fitted MT asymmetry curve from one subject at 2 μT demonstrating a good fit based on the modified Henkelman's model.
Results
Fig. 1 shows the experimental results averaged from white matter regions in healthy human brain at 3 T (n = 5). The measured z-spectra (after B0 field inhomogeneity correction) are asymmetric around the water resonant frequency, with lower intensities on the negative offset side (Fig. 1b). For the 15 pairs of offsets ranging from +75 to –75 ppm (in increments of 5 ppm, ±80 ppm excluded) all p-values for the paired two-tail t-test are less than 0.001 (after correction for multiple comparisons). Note that these z-spectra reflect the combined effects of i) MT based on solid-like tissue structures (1-7), ii) direct water saturation, and iii) proton transfer related to mobile molecules in tissue (12,16-18). The MT asymmetry (Fig. 1c) is between 0 and -2% for the offset region far from water (20 ppm and beyond) and between 0.5% and -5% for the region close to water (0-10 ppm). For the frequency offsets below 45 ppm, we can see that as the applied RF saturation power increases, the amplitude of the MT asymmetry curve increases first and then decreases back towards zero, which confirms the existence of the characteristic RF saturation power (ω1c) for maximal conventional MT asymmetry. The magnitude of the MTR asymmetry is dependent on both RF saturation power and frequency offset. However, when normalized with the average intensity of the z-spectrum (1-MTR) at corresponding positive and negative offsets in an attempt to correct for saturation power, as expected, the dependency on offset is less pronounced (Fig. 1d).
We fitted the MT asymmetry data over the same range of frequency offsets for the four RF irradiation power levels (0.5, 1, 2, and 3 μT. See Fig. 1e for an example with one subject at 2 μT). The fitting error, which is defined as the mean residual deviation per point (20), averaged over all subjects is 0.016 ± 0.003 for the z-spectra and 0.004 ± 0.001 for the MT asymmetry spectra. Table 2 shows the fitted Δmw values in normal white matter for the five volunteers. The results show that the solid-like macromolecule pool has a chemical shift center about 2.34 ± 0.17 ppm upfield from the water signal. Using 4.75 ppm for the water resonance, this center corresponds to a resonance frequency of about 2.41 ppm in the proton NMR spectrum, which is located in the chemical shift range of aliphatic protons. The maximal MT effect of the semi-solid macromolecular pool should occur at this frequency. The reason that the z-spectrum has an apparent center at the water frequency is due to direct saturation effects on water. If these direct water effects could be removed, the true MT spectrum of the semi-solid would appear with a center around 2.41 ppm.
Table 2.
Fitted model parameters for normal white matter in healthy human brains (n = 5) with comparison to values from literature.
| Volunteer | RM0m/R1w | 1/(R1wT2w) | R (s-1) | T2m (μs) | Δmw (ppm) |
|---|---|---|---|---|---|
| 1 | 2.75 | 61.99 | 26.12 | 11.39 | 2.11 |
| 2 | 3.35 | 62.60 | 41.87 | 10.40 | 2.52 |
| 3 | 4.82 | 46.34 | 61.83 | 10.19 | 2.19 |
| 4 | 3.68 | 62.52 | 47.84 | 10.51 | 2.46 |
| 5 | 4.29 | 63.03 | 69.34 | 10.52 | 2.41 |
| Average ± SE | 3.78±0.81 | 59.29±7.25 | 49.39±16.97 | 10.60±0.45 | 2.34 ± 0.17 |
| Ref. (25) at 1 T | 13.42* | 5.78* | 58.62* | 10.00±3.50 | N/A |
| Ref. (26 )at 1.5 T | 2.47* | 16.34* | 28.43* | 12.30±1.60 | N/A |
SE cannot be obtained from the parameter values given in literature.
Table 2 also lists the other four fitted parameters for each volunteer and compares them to those in literature. The work presented by Chai et al. (25) and Sled et al. (26) reported their model parameters fitted from data acquired in human brains in vivo at 1 and 1.5 T, respectively. At a higher B0 field (3 T), T1 is expected to increase while T2 decreases slightly. It is reasonable to find out the parameter to be greater in our results as compared to those published. The exchange rate R, which should intuitively be B0 independent, is compatible to the values in literature. Considering the relatively big standard error of the values of T2m in Ref. (25), we can see that T2m is dropping gradually with the rising of B0 field strength. The value of we observed is different from that found in Ref. (25) but consistent with the results presented in Ref. (26). It should be noted that this parameter is hypothesized to be higher at 3 T assuming a field independent RM0m.
The data in Fig. 1b-e also shows that the maximal MT asymmetry and its corresponding characteristic RF saturation power (ω1c) are dependent on offset. To investigate the power dependence at each offset, we acquired the data of the two volunteers with extra power levels of 1.5 to 3.5 μT with a step of 0.2 μT. The estimated characteristic RF saturation power (ω1c) and maximal MTR asymmetry (from all volunteers and all power levels) were evaluated using Eqs. [6-9] and Eqs. [1-5], respectively, using the averaged values of the fitted parameters from each subject as input. As shown in Fig. 2a, the experimental results for maximal saturation power fit well with the theoretical offset dependence for this parameter. Furthermore, the predicted and experimental results (Fig. 2b) of the maximal MTR asymmetry are consistent for each frequency offset. This is particularly true for the frequency region of 10-60 ppm from the water resonance. For frequency offsets beyond 60 ppm, due to SAR limitation, the power level we could apply was not big enough to generate the maximal MT asymmetry.
Fig. 2.
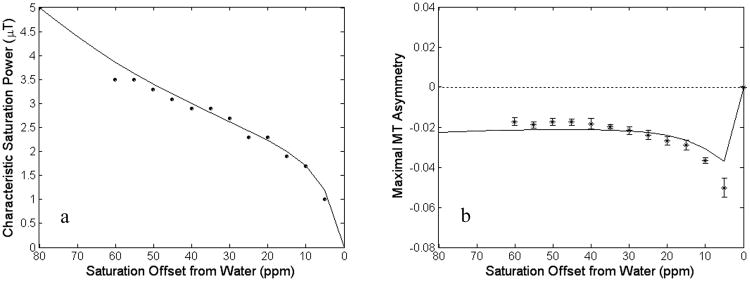
Experimental and theoretical characteristic saturation power to maximize MT asymmetry (a) and maximal MT asymmetry (b) of white matter in healthy human brains at 3 T (n = 5). The average fitted model parameters (see Table 2) were used for theoretical calculation. All power levels (including eleven extra levels for the two volunteers) were used. The MT asymmetry did not approach maximal for higher offsets in the range of powers used (0.5-3.5 μT), and the data points of 65 ppm and beyond were not obtained. The measured offset dependence of the characteristic power and the magnitude of maximal MT asymmetry agree reasonably with the theoretical prediction (solid lines) according to the modified Henkelman's model.
Like MTR, the amplitude of the MT asymmetry depends on imaging sequence parameters, including but not limited to, RF power level and frequency offset (Fig. 1c). To further study this imaging sequence dependence, several extra experiments were carried out using the CW MT sequences with different saturation times and the pulsed MT sequences as described in the MRI experiments subsection. Table 3 compares the magnitudes of the MTR asymmetry measured at the offsets of 30 and 60 ppm. The results show that both MTR and MTRasym changed as the CW RF irradiation time (MTR increased with increasing RF irradiation time, and MTRasym increased from 0.5 to 1.5 s and was almost unchanged between 1.5 and 3 s). The equivalent RF power level of the pulse train MT sequence was approximately the same as that of the CW MT sequence. As expected, these two sequences (CW (3 s) and Pulsed 1) had very similar Mzw/M0w and MT asymmetry values, and the difference was within the range of error.
Table 3.
The magnitude of the MT asymmetry (n = 2) at the frequency offsets of 30 and 60 ppm from the three different pulse sequences as described in the MRI experiments subsection: CW, power level 2.3 μT, different saturation time; Pulsed 1, equivalent power 2.3 μT (compared to CW); and Pulsed 2. The two subjects are the same in the three experiments.
| Pulse Sequence | 30 ppm | 60 ppm | ||
|---|---|---|---|---|
| Mzw/M0w | MTR Asymmetry | Mzw/M0w | MTR Asymmetry | |
| CW (3 s) | 0.656±0.019 | -0.021±0.006 | 0.786±0.015 | -0.012±0.006 |
| CW (1.5 s) | 0.701±0.024 | -0.022±0.014 | 0.818±0.021 | -0.013±0.022 |
| CW (0.5 s) | 0.841±0.016 | -0.009±0.006 | 0.935±0.024 | -0.003±0.006 |
| Pulsed 1 | 0.644 ± 0.017 | -0.017 ± 0.006 | 0.769 ± 0.015 | -0.014 ± 0.007 |
| Pulsed 2 | 0.759 ± 0.033 | -0.013 ± 0.019 | 0.848 ± 0.035 | -0.005 ± 0.028 |
Discussion
Conventional MT Asymmetry and APT
First, it is important to distinguish two kinds of MT asymmetry in tissue. One is related to solid-like macromolecules in tissue as seen in the conventional MT effect, and the other is related to mobile molecules (proteins, peptides, sugars, glycogen, etc.) resonating in the small offset range with respect to water. The asymmetry of conventional MT in tissue and a qualitative explanation in terms of shifted frequency offset for the macromolecular spins were first reported more than ten years ago (8-10), but a quantitative description for this effect was not provided. This is in part due to the complexity of nuclear spin interactions in tissue and the fact that the effect is very small and dependent on many factors, including experimental parameters. In this study, the MT asymmetry in the brains of healthy human volunteers was quantified, and its saturation power and frequency offset dependence evaluated.
We demonstrated previously (12,16-18) that the effect of APT at the offset of ∼3.5 ppm associated with mobile proteins and peptides is a significant contributor to the MT asymmetry in the small offset range (0-5ppm from water). In the brain, asymmetry curves may show varying MT differences that are initially positive and then become negative. This can be described by:
| [9] |
where is a background caused by the asymmetric solid-like MT effect with respect to water, as quantified in this study, and PTR is the proton transfer ratio for the exchangeable protons in mobile tissue constituents. If conventional MT effects were symmetric with respect to the water resonance , any contribution due to proton exchange in the downfield spectral range should result in a positive MT difference. In Fig. 1c, the initially positive MT asymmetry for 3 μT is due to the APT effect. Note that in the frequency offset range that is close to water resonance (less than 5 ppm), the current two-pool model is insufficient because of the additional MT effects (12,16-18,27-29) caused by exchangeable protons in various mobile molecules in tissue. Future studies are required to develop and test a more complex multi-pool model (namely, solid-like macromolecules, mobile proteins and peptides, and bulk water) for accurate description in this offset range.
Pulse Sequence Dependence of the MTR Asymmetry
Table 3 clearly shows both the MTR and MTRasym values depend on the used imaging sequence parameters. When the data from these extra experiments were further fitted to the six-parameter model, the Δmw values for CW (1.5 s), CW (0.5 s) and Pulsed 1 were found to be 2.44 ± 0.33, 1.71 ± 0.71, and 2.32 ± 0.41 ppm, respectively. For Pulsed 1, we assumed that the model is valid on an equivalent-power basis and used the equivalent-power magnitude for the fitting. The large Δmw standard errors may be attributed to several factors. For CW (0.5 s), the RF irradiation time is not long enough for the system to reach the steady state that is required by the model. Therefore, the fitted value may not be accurate. Besides, the fittings were all to a single power (not global fitting), and only two subjects were involved. In spite of these, it is important to note that the fitted Δmw values for CW (3 s), CW (1.5 s), and Pulsed 1 are very close, which indicates that Δmw is an intrinsic tissue parameter (not sequence dependent).
The conventional MT asymmetry has been reported previously on humans at 1.5 T (9), cats at 4.7 T (8,10), rats at 4.7 T (12), and phantoms at 11.7 T (11), as well as in this study on humans at 3 T. These previous studies were mainly carried out using the CW MT sequences (or equivalently, such as the pulse train MT sequences). The results from the 3D-spoiled gradient-echo pulsed MT sequence (Pulsed 2) clearly show the presence of the conventional MT asymmetry under very different experimental conditions (parallel imaging, pulsed MT, 3D, gradient-echo). It is hard to compare the experimental results obtained from the pulsed MT sequences (Pulsed 2) and those obtained from the CW MT sequences, mainly because of the difficulty to calculate equivalent-irradiation power levels; nevertheless, the magnitude of the MTRasym was remarkably comparable.
Minimization and Maximization of the MTR Asymmetry
Even though the asymmetry of conventional MT is only on the order of a change of 1-2% in the water signal intensity, the effect may be problematic for some MRI measurements. For example, in the CASL perfusion MRI experiments (13,14), the longitudinal magnetization of inflowing arterial water is labeled using off-resonance RF irradiation, and a control scan with the frequency of the off-resonance irradiation inverted around the water resonance is acquired subsequently. Under normal physiological conditions (cerebral blood flow (CBF) 50-150 ml/100g/min), tissue perfusion in the brain could cause a few percent change in the water signal intensity, which is on the order of the magnitude of the MT asymmetry. Therefore, the conventional MT asymmetry has substantial influence on the accuracy of perfusion quantification, unless proper compensation schemes are used (8,15).
Chemical exchange saturation transfer (CEST) imaging (18,30-32) is a variant of MT imaging, in which the selective saturation of the magnetization of endogenous or exogenous exchangeable solute protons is detected indirectly through chemical exchange with bulk water protons. This includes APT at the offset of about 3.5 ppm (a change of 2-4% in the water signal) associated with endogenous mobile protein and peptide amide protons in tissue (12,16-18), paramagnetic CEST (PARACEST) with significantly enlarged chemical shifts of exchanging sites due to the use of lanthanide complexes (33,34), etc. The conventional MT asymmetry may confound quantification of CEST effects in vivo or in cells (not in vitro due to the absence of conventional MT). If the definition of Eq. [5] is used for asymmetry analysis of z-spectra, it will cause the negative background signal for the resulting CEST effect. In these two cases, the conventional MT asymmetry is destructive and should be minimized. According to the theoretical derivation in this paper, proper irradiation power levels and frequency offsets need to be determined when designing imaging protocols.
On the other hand, the asymmetry of conventional MT may also be exploited as a new method for tissue characterization, in which the MTR asymmetry should be maximized. In a recent conference abstract (35), we found that the MT asymmetry in 9L rat brain tumors was different from that in contralateral normal-appearing brain tissue. This implies that the conventional MT asymmetry and perhaps the model parameter Δmw may be different in various tissues and tissues in pathological conditions, thus providing a potential new measure (RF power independent) for tumor detection in vivo.
Conclusions
The asymmetry in the conventional MT effect with respect to the water resonance was studied in healthy human brain at 3 T. The magnitude of asymmetry depended on the RF saturation power applied and the frequency offset with respect to water. At each frequency offset, the MT asymmetry was maximized at a different saturation power. The MT asymmetry could be described quantitatively by adding a correcting frequency shift for the solid component in the Bloch equations. The MT asymmetry may be used to have a more pure insight into the interaction between semi-solid tissue components and bulk water, which may be beneficial for yet unknown applications.
Acknowledgments
This study was supported in part by grants from NIH/NIBIB (EB002634, EB002666), NIH/NCRR RR15241, and the Whitaker Foundation. Dr. Craig Jones was supported by a grant from Philips Medical Systems to Kennedy Krieger Research Institute. Dr. Peter van Zijl is a paid lecturer for Philips Medical Systems. This arrangement has been approved by Johns Hopkins University in accordance with its Conflict of Interest policies.
Appendix 1.
The characteristic RF saturation power (ω1c) is offset dependent. To derive ω1c for a particular frequency offset (Δw), it is necessary to differentiate Eq. [5] (after insertion of Eqs. [1-4]) with respect to ω1 and calculate the zero crossing points of the derivative. For the sake of clarity, Eq. [5] is rewritten as:
| [A1] |
where
| [A2] |
| [A3] |
| [A4] |
| [A5] |
Obviously, this direct procedure would result in a high order polynomial equation that cannot be solved analytically.
Comparing the values of items A, , , and in Eq. [A1] with typical fitted model parameters in human brain, we found that is one order smaller than A and and two orders smaller than , when the RF saturation power (ω1) is in the range of 0-5 μT, which is the maximal saturation power allowed in this study, and the frequency offset (Δw) is larger than 10 ppm, which is of interest for this study. We performed simulations for Eq. [A1] with and without the items as a function of frequency offset (0-80 ppm) using typical fitted model parameters and a variety of power levels from 0 to 5 μT. Notice that as ω1 grows larger, the difference between the equations with and without increases. For frequency offsets greater than 10 ppm, the difference in the MTR asymmetry from the full equation is less than 2% (of the MTR asymmetry). Therefore, we can differentiate the simplified Eq. [A1] without and find the zero crossing points of the derivative.
Obviously, the only real positive root is the characteristic power. As a proof of principle, we also carried through the second-order derivative of the simplified Eq. [A1] to assure that the real positive root corresponds to a maximum (not minimum) MT asymmetry. The proof is straightforward but fairly lengthy, therefore not shown here. Thus, we derived a reasonably approximated analytical expression for the estimation of the characteristic RF irradiation power level:
| [A6] |
Note that Δmw > 0 corresponds to the MT spectrum center shifted upfield from the water signal while Δmw < 0 corresponds to downfield. In human brains in vivo, the shift is always expected and observed to be upfield. Therefore, we have:
| [A7] |
which is given as Eq. [6] in the Theory subsection.
Finally, we found that for the frequency offset greater than 10 ppm, the difference in the MTR asymmetry between the full equation and the simplified Eq. [A1] without and is less than 10% (of the MTR asymmetry). If such an error is acceptable, Eq. [A6] can be further simplified as (the quarter power):
| [A8] |
References
- 1.Wolff SD, Balaban RS. Magnetization transfer contrast (MTC) and tissue water proton relaxation in vivo. Magn Reson Med. 1989;10:135–144. doi: 10.1002/mrm.1910100113. [DOI] [PubMed] [Google Scholar]
- 2.Balaban RS, Ceckler TL. Magnetization transfer contrast in magnetic resonance imaging. Magn Reson Q. 1992;8:116–137. [PubMed] [Google Scholar]
- 3.Bryant RG. The dynamics of water-protein interactions. Annu Rev Biophys Biomol Struct. 1996;25:29–53. doi: 10.1146/annurev.bb.25.060196.000333. [DOI] [PubMed] [Google Scholar]
- 4.Henkelman RM, Stanisz GJ, Graham SJ. Magnetization transfer in MRI: a review. NMR Biomed. 2001;14:57–64. doi: 10.1002/nbm.683. [DOI] [PubMed] [Google Scholar]
- 5.Sled JG, Pike GB. Quantitative interpretation of magnetization transfer in spoiled gradient echo MRI sequences. J Magn Reson. 2000;145:24–36. doi: 10.1006/jmre.2000.2059. [DOI] [PubMed] [Google Scholar]
- 6.Tozer D, Ramani A, Barker GJ, Davies GR, Miller DH, Tofts PS. Quantitative magnetization transfer mapping of bound protons in multiple sclerosis. Magn Reson Med. 2003;50(1):83–91. doi: 10.1002/mrm.10514. [DOI] [PubMed] [Google Scholar]
- 7.Stanisz GJ, Odrobina EE, Pun J, Escaravage M, Graham SJ, Bronskill MJ, Henkelman RM. T-1, T-2 relaxation and magnetization transfer in tissue at 3T. Magn Reson Med. 2005;54:507–512. doi: 10.1002/mrm.20605. [DOI] [PubMed] [Google Scholar]
- 8.Pekar J, Jezzard P, Roberts DA, Detre JA, Leigh JS, Frank JA, McLaughlin AC. Perfusion imaging with MTC offset compensation; Proc SMR, 2nd Annual Meeting; San Francisco. 1994; p. 281. [Google Scholar]
- 9.Stein AD, Roberts DA, McGowan J, Reddy R, Leigh JS. Asymmetric cancellation of magnetization transfer effects; Proc SMR, 2nd Annual Meeting; San Francisco. 1994; p. 880. [Google Scholar]
- 10.Pekar J, Jezzard P, Roberts DA, Leigh JS, Frank JA, McLaughlin AC. Perfusion imaging with compensation for asymmetric magnetization transfer effects. Magn Reson Med. 1996;35:70–79. doi: 10.1002/mrm.1910350110. [DOI] [PubMed] [Google Scholar]
- 11.Swanson SD, Pang Y. MT is symmetric but shifted with respect to water; Proc 11th Annual Meeting ISMRM; Toronto. 2003; p. 660. [Google Scholar]
- 12.Zhou J, Payen J, Wilson DA, Traystman RJ, van Zijl PCM. Using the amide proton signals of intracellular proteins and peptides to detect pH effects in MRI. Nature Med. 2003;9:1085–1090. doi: 10.1038/nm907. [DOI] [PubMed] [Google Scholar]
- 13.Detre JA, Leigh JS, Williams DS, Koretsky AP. Perfusion imaging. Magn Reson Med. 1992;23:37–45. doi: 10.1002/mrm.1910230106. [DOI] [PubMed] [Google Scholar]
- 14.Williams DS, Detre JA, Leigh JS, Koretsky AP. Magnetic resonance imaging of perfusion using spin inversion of arterial water. Proc Natl Acad Sci (USA) 1992;89:212–216. doi: 10.1073/pnas.89.1.212. [DOI] [PMC free article] [PubMed] [Google Scholar]
- 15.Detre JA, Zhang W, Roberts DA, Silva AC, Williams DS, Grandis DJ, Koretsky AP, Leigh JS. Tissue specific perfusion imaging using arterial spin labeling. NMR Biomed. 1994;10:135–144. doi: 10.1002/nbm.1940070112. [DOI] [PubMed] [Google Scholar]
- 16.Zhou J, Lal B, Wilson DA, Laterra J, van Zijl PCM. Amide proton transfer (APT) contrast for imaging of brain tumors. Magn Reson Med. 2003;50:1120–1126. doi: 10.1002/mrm.10651. [DOI] [PubMed] [Google Scholar]
- 17.Jones CK, Schlosser MJ, van Zijl PC, Pomper MG, Golay X, Zhou J. Amide proton transfer imaging of human brain tumors at 3T. Magn Reson Med. 2006:585–592. doi: 10.1002/mrm.20989. [DOI] [PubMed] [Google Scholar]
- 18.Zhou J, van Zijl PC. Chemical exchange saturation transfer imaging and spectroscopy. Progr NMR Spectr. 2006;48:109–136. [Google Scholar]
- 19.Henkelman RM, Huang X, Xiang QS, Stanisz GJ, Swanson SD, Bronskill MJ. Quantitative interpretation of magnetization transfer. Magn Reson Med. 1993;29(6):759–766. doi: 10.1002/mrm.1910290607. [DOI] [PubMed] [Google Scholar]
- 20.Morrison C, Henkelman RM. A model for magnetization transfer in tissues. Magn Reson Med. 1995;33(4):475–482. doi: 10.1002/mrm.1910330404. [DOI] [PubMed] [Google Scholar]
- 21.Morrison C, Stanisz G, Henkelman RM. Modeling magnetization transfer for biological-like systems using a semi-solid pool with a super-Lorentzian lineshape and dipolar reservoir. J Magn Reson B. 1995;108(2):103–113. doi: 10.1006/jmrb.1995.1111. [DOI] [PubMed] [Google Scholar]
- 22.Quesson B, Thiaudiere E, Delalande C, Dousset V, Chateil JF, Canioni P. Magnetization transfer imaging in vivo of the rat brain at 4.7 T: interpretation using a binary spin-bath model with a superLorentzian lineshape. Magn Reson Med. 1997;38(6):974–980. doi: 10.1002/mrm.1910380617. [DOI] [PubMed] [Google Scholar]
- 23.Ramani A, Dalton C, Miller DH, Tofts PS, Barker GJ. Precise estimate of fundamental in-vivo MT parameters in human brain in clinically feasible times. Magn Reson Imaging. 2002;20(10):721–731. doi: 10.1016/s0730-725x(02)00598-2. [DOI] [PubMed] [Google Scholar]
- 24.Smith SA, Farrell JA, Jones CK, Reich DS, Calabresi PA, van Zijl PC. Pulsed magnetization transfer imaging with body coil transmission at 3 Tesla: feasibility and application. Magn Reson Med. 2006;56:866–875. doi: 10.1002/mrm.21035. [DOI] [PubMed] [Google Scholar]
- 25.Chai JW, Chen C, Chen JH, Lee SK, Yeung HN. Estimation of in vivo proton intrinsic and cross-relaxation rate in human brain. Magn Reson Med. 1996;36(1):147–152. doi: 10.1002/mrm.1910360123. [DOI] [PubMed] [Google Scholar]
- 26.Sled JG, Pike GB. Quantitative imaging of magnetization transfer exchange and relaxation properties in vivo using MRI. Magn Reson Med. 2001;46(5):923–931. doi: 10.1002/mrm.1278. [DOI] [PubMed] [Google Scholar]
- 27.de Graaf RA, van Kranenburg A, Nicolay K. Off-resonance metabolite magnetization transfer measurements on rat brain in situ. Magn Reson Med. 1999;41:1136–1144. doi: 10.1002/(sici)1522-2594(199906)41:6<1136::aid-mrm9>3.0.co;2-g. [DOI] [PubMed] [Google Scholar]
- 28.van Zijl PCM, Zhou J, Mori N, Payen J, Mori S. Mechanism of magnetization transfer during on-resonance water saturation. a new approach to detect mobile proteins, peptides, and lipids. Magn Reson Med. 2003;49:440–449. doi: 10.1002/mrm.10398. [DOI] [PubMed] [Google Scholar]
- 29.Chen JH, Sambol EB, DeCarolis P, O'Connor R, Geha RC, Wu YV, Singer S. High-resolution MAS NMR spectroscopy detection of the spin magnetization exchange by cross-relaxation and chemical exchange in intact cell lines and human tissue specimens. Magn Reson Med. 2006;55:1246–1256. doi: 10.1002/mrm.20889. [DOI] [PubMed] [Google Scholar]
- 30.Wolff SD, Balaban RS. NMR imaging of labile proton exchange. J Magn Reson. 1990;86:164–169. [Google Scholar]
- 31.Guivel-Scharen V, Sinnwell T, Wolff SD, Balaban RS. Detection of proton chemical exchange between metabolites and water in biological tissues. J Magn Reson. 1998;133:36–45. doi: 10.1006/jmre.1998.1440. [DOI] [PubMed] [Google Scholar]
- 32.Ward KM, Aletras AH, Balaban RS. A new class of contrast agents for MRI based on proton chemical exchange dependent saturation transfer (CEST) J Magn Reson. 2000;143:79–87. doi: 10.1006/jmre.1999.1956. [DOI] [PubMed] [Google Scholar]
- 33.Zhang S, Winter P, Wu K, Sherry AD. A novel europium(III)-based MRI contrast agent. J Am Chem Soc. 2001;123(7):1517–1578. doi: 10.1021/ja005820q. [DOI] [PubMed] [Google Scholar]
- 34.Aime S, Barge A, Delli Castelli D, Fedeli F, Mortillaro A, Nielsen FU, Terreno E. Paramagnetic Lanthanide(III) complexes as pH-sensitive chemical exchange saturation transfer (CEST) contrast agents for MRI applications. Magn Reson Med. 2002;47:639–648. doi: 10.1002/mrm.10106. [DOI] [PubMed] [Google Scholar]
- 35.Hua J, van Zijl P, Sun P, Zhou J. Quantitative description of magnetization transfer (MT) asymmetry in experimental brain tumors; Proc 15th Annual Meeting ISMRM; Berlin, Germany. 2007; p. 882. [Google Scholar]