Abstract
Endoplasmic Reticulum (ER) stress has been linked to insulin resistance in multiple tissues but the role of ER stress in skeletal muscle has not been explored. ER stress has also been reported to increase tribbles 3 (TRB3) expression in multiple cell lines. Here, we report that high fat feeding in mice, and obesity and type 2 diabetes in humans significantly increases TRB3 and ER stress markers in skeletal muscle. Overexpression of TRB3 in C2C12 myotubes and mouse tibialis anterior muscles significantly impairs insulin signaling. Incubation of C2C12 cells and mouse skeletal muscle with ER stressors thapsigargin and tunicamycin increases TRB3 and impairs insulin signaling and glucose uptake, effects reversed in cells overexpressing RNAi for TRB3 and in muscles from TRB3 knockout mice. Furthermore, TRB3 knockout mice are protected from high fat diet-induced insulin resistance in skeletal muscle. These data demonstrate that TRB3 mediates ER stress-induced insulin resistance in skeletal muscle.
While modern medicine has succeeded in reducing or eliminating many diseases, the incidence of type 2 diabetes continues to rise. Skeletal muscle is one of the major sites of glucose disposal in the body1. A major characteristic of patients with type 2 diabetes is reduced insulin sensitivity in skeletal muscle. Although considerable progress has been made in understanding skeletal muscle insulin resistance, the underlying mechanisms have not been fully elucidated.
TRB3, a mammalian homolog of Drosophila tribbles, is a pseudokinase and therefore contains a kinase domain without enzymatic activity2. TRB3 is expressed in various tissues, including liver, adipose tissue, heart, and skeletal muscle3-6. Emerging data suggest that TRB3 has strikingly different metabolic functions depending on the tissue studied. In the liver, TRB3 binds and inhibits Akt activity, leading to impaired insulin signaling3. Overexpression of TRB3 in mouse liver results in decreased glycogen content, increased hepatic glucose output and blood glucose concentrations, and impaired glucose tolerance3, whereas disruption of TRB3 in mouse liver by RNAi improves glucose tolerance7. In pancreatic β cells, TRB3 expression increases with type 2 diabetes in mice and humans and the overexpression of TRB3 in mice inhibits glucose-stimulated insulin secretion and impairs glucose homeostasis8. However, studies performed in adipose tissue suggest TRB3 has a very different role, functioning in the regulation of fatty acid oxidation through ubiquitination of Acetyl-CoA Carboxylase4. Mice overexpressing TRB3 in adipose tissue are protected from diet-induced obesity due to enhanced fatty acid oxidation4. There has been limited investigation on the role of TRB3 in skeletal muscle. Our study has shown that overexpression of TRB3 in C2C12 muscle cells inhibits insulin-stimulated Akt phosphorylation and decreases insulin-stimulated glucose uptake6. More recently, TRB3 expression has been shown to be elevated in skeletal muscle from patient with type 2 diabetes9. In another study TRB3 expression was reported to be decreased in the skeletal muscle of ob/ob mice after a single bout of exercise, which has been implicated in post-exercise insulin sensitivity10.
The endoplasmic reticulum (ER) is the major site in the cell for lipid and protein synthesis, folding, assembly, and trafficking, as well as cellular Ca2+ storage11, 12. Interference with ER function by conditions such as high fat feeding, virus infection, and glucose deprivation are referred to as ER stress12-14. ER stress is characterized by increases in a number of transcription factors such as activating transcription factor 6 (ATF6), CCAAT/enhancer-binding protein homologous protein (CHOP), and X-box binding protein 1 (XBP1) and phosphorylation of protein kinase like ER kinase (PERK), leading to translation attenuation and cell cycle arrest12-14. In the liver, ER stress has also been shown to cause c-Jun N-terminal kinase (JNK) activation, which results in increased IRS1 serine phosphorylation and subsequent insulin resistance15, whereas inhibition of ER stress by chemical chaperones protects high fat fed mice from insulin resistance16. In pancreatic β-cells, high glucose17, 18, free fatty acids19, 20, and inflammatory cytokines21 cause ER stress, which has emerged as a key player for β-cell dysfunction and death during the progression of type 1, type 2, and genetic forms of diabetes. In the kidney, mice with a heterozygous constitutive knockin mutation of a mutant binding immunoglobulin protein (BiP) have evidence of ER stress, associated with age-related renal tubular atrophy, interstitial fibrosis, and glomerulosclerosis22. ER stress also occurs in cardiac myocytes and cardiac tissue in response to various stressors, including ischemia, inflammation, and exposure to alcohol, which has been associated with cardiomyopathy and apoptosis23-25. While the effects of ER stress in multiple tissues have been established, the role of ER stress in skeletal muscle is poorly understood. However, several conditions have recently been suggested to cause ER stress in skeletal muscle, including type 1 diabetes26, high-fat feeding27, overexpression of stearoyl-CoA desaturase 128, and exercise29.
In the current study we tested the hypothesis that TRB3 mediates ER stress-induced insulin resistance in skeletal muscle. We find that ER stress in both C2C12 muscle cells in culture and adult mouse skeletal muscle increases TRB3 expression. Overexpression of TRB3 in C2C12 myotubes and adult mouse skeletal muscle in vivo inhibits insulin signaling and glucose uptake. ER stress-induced insulin resistance is reversed with knockdown of TRB3 in C2C12 myotubes and in skeletal muscle of TRB3 knockout mice. In addition, TRB3 knockout mice are protected from high fat diet-induced insulin resistance. These data demonstrate that TRB3 mediates ER stress-induced insulin resistance in skeletal muscle.
RESULTS
Obesity and diabetes increase TRB3 in skeletal muscles
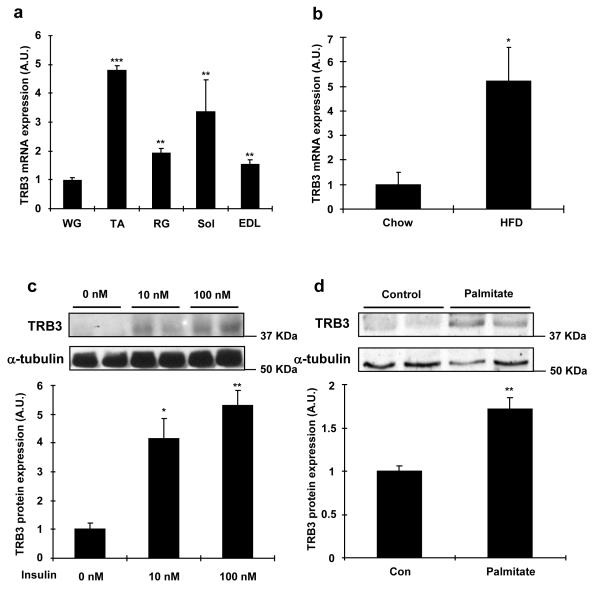
TRB3 is expressed in multiple tissues, including liver, adipose tissue, and pancreatic β cells3, 4, 8, and here we first determined the mRNA expression profile of TRB3 in multiple mouse skeletal muscles. TRB3 mRNA expression was lower in the white gastrocnemius muscle (WG) and higher in other muscles, including tibialis anterior (TA), red gastrocnemius (RG), soleus (Sol), and extensor digitorum longus (EDL) muscles (Fig. 1a). To determine if altered metabolic states affects TRB3 expression in mouse skeletal muscle and C2C12 cells, mice were fed a high fat diet for six weeks. This treatment increased body weight, blood glucose, and serum insulin concentrations (Supplementary Fig. S1), and significantly increased TRB3 mRNA expression in tibialis anterior muscles by 5.2-fold (Fig. 1b). To determine the effects of insulin and fatty acids on the regulation of TRB3, C2C12 myotubes were studied. Insulin incubation at 10 nM and 100 nM for 16 hrs increased TRB3 expression by 4.2- and 5.3-fold, respectively (Fig. 1c), whereas palmitate incubation at 0.75 mM, a physiological dosage30, increased TRB3 expression by 1.7-fold (Fig. 1d). Incubation of C2C12 myotubes with insulin and palmitate increased mRNA expression of the ER stress markers GRP78 and Chop, and the increase was abrogated by chemical inhibitors for insulin signaling molecules and chemical chaperones (4-Phenyl butyric acid and Dimethyl sulfoxide)(Fig. 1e,f).
Fig. 1. Regulation of TRB3 expression in C2C12 cells and mouse skeletal muscle.
(a) Female ICR mice (12 weeks old) were sacrificed by cervical dislocation and white gastrocnemius (WG), tibialis anterior (TA), red gastrocnemius (RG), soleus (Sol), and extensor digitorum longus (EDL) muscles were dissected and frozen. Real-time PCR was performed to determine mRNA expression of TRB3 in multiple muscles (n=3). (b) Male C57BL/6 mice (8 weeks old) were fed a high fat diet for 6 weeks. TA muscle was dissected to determine mRNA expression of TRB3 (n=6). (c-f) C2C12 cells were differentiated for 6 days and incubated with 0, 10, or 100 nM of insulin (c); 0 or 0.75 mM palmitate (d) with 2% BSA for 16 hrs, and protein extracts were used for Western blot analysis to determine TRB3 expression as described in the Experimental Procedures (n=4). Additional myotubes were preincubated with DMSO (0.1% v/v), PI3 kinase inhibitor (100 nM; Wortmannin from Sigma), or Akt inhibitor (10 μM; Akt inhibitor VIII from EMD) 30 min prior to incubation with 0 or 100 nM of insulin (e); with chemical chaperones (5 mM; 4-phenyl butyric acid, PBA from Sigma or 0.5% v/v: DMSO) 30 min prior to incubation with 0 or 0.75 mM palmitate (f) for 16 hrs to determine mRNA expression of TRB3, GRP78, and Chop (n=3). (g) TRB3 Western blot analysis of vastus lateralis muscle from lean, obese, or diabetic subjects (n=6-13). Data are the means ± S.E.M. * indicates p<0.05, ** indicates p<0.01, and *** indicates p<0.001 vs. WG muscle or control. # indicates p<0.05, ## indicates p<0.01, and ### indicates p<0.001 vs. corresponding control, using One way ANOVA (a,c,g), Student’s t-test (b,d), and Two way ANOVA with Bonferroni correction (e,f).
Given that obesity and type 2 diabetes are characterized by impaired metabolic states, we hypothesized that skeletal muscle from human patients with these diseases would have increased TRB3 expression. Compared to age- and sex-matched controls, TRB3 expression was significantly higher in the vastus lateralis muscle of subjects with obesity and type 2 diabetes (Fig. 1g). Taken together, all of these studies demonstrate that multiple metabolic perturbations regulate TRB3 expression in both mouse and human skeletal muscle.
TRB3 inhibits insulin signaling in vitro and in vivo
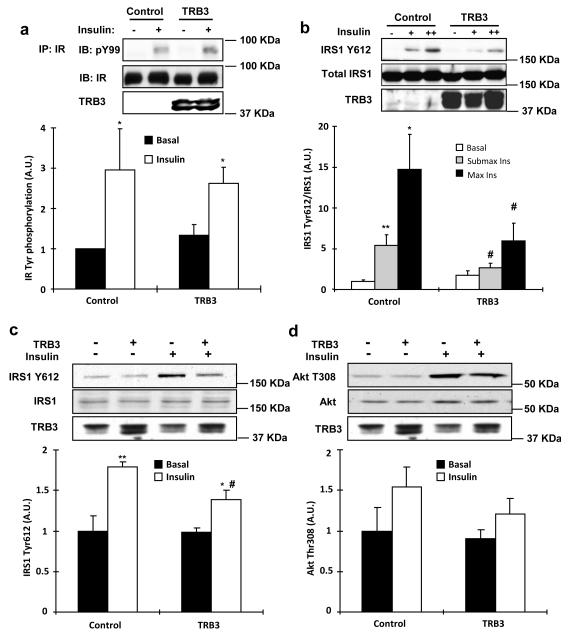
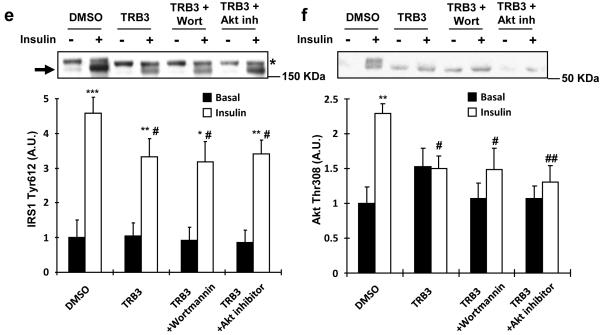
Given that TRB3 was increased with altered metabolic states, we next determined if overexpression of TRB3 would impair insulin signaling. We have previously shown that overexpression of TRB3 in C2C12 cells decreases insulin-stimulated Akt activity via direct binding to Akt6. To determine if this effect was specific for Akt or has a more generalized effect on insulin signaling, we infected C2C12 myotubes with adenovirus containing either GFP control or TRB3. Overexpression of TRB3 did not affect tyrosine phosphorylation of the insulin receptor and IRS2 (Fig. 2a and Supplementary Fig. S2). In contrast, compared to control cells expressing GFP, overexpression of TRB3 resulted in a significant decrease in both submaximal and maximal insulin-stimulated IRS1 Tyr612 phosphorylation (Fig. 2b), an upstream regulator of PI3 kinase activity31.
Fig. 2. Effects of TRB3 on insulin signaling in C2C12 cells and mouse skeletal muscle.
(a) Coimmunoprecipitation experiments were performed on C2C12 cells overexpressed with TRB3. Insulin receptor (IR) immunoprecipitates (IP) were immunoblotted with phospho-tyrosine specific antibody (pY99). Immunoblotting (IB) with IR specific antibody confirmed equal protein (n=3). (b) IRS1 Tyr612 phosphorylation with TRB3 overexpression was determined in the C2C12 cells incubated with submaximal insulin (2.7 nM) or maximal insulin (100 nM) (n=5). (c,d) TRB3 was overexpressed in female ICR mouse (10 weeks old) tibialis anterior muscle by a direct DNA injection followed by electroporation. Two weeks after electroporation, mice were killed 10 min after injection of either saline (basal) or 1 U/kg body weight of ip insulin. Tibialis anterior muscles were collected, frozen, and processed for Western blot analysis to determine phosphorylation of IRS1 Tyr612 (c) and Akt T308 (d) (n=6). (e,f) C2C12 myotubes were preincubated with DMSO, PI3 kinase inhibitor (100 nM; Wortmannin from Sigma), or Akt inhibitor (10 μM; Akt inhibitor VIII from EMD) 30 min prior to infection with TRB3. Lysates were subjected to gel electrophoresis to determine the IRS1 tyrosine phosphorylation at 612 (e; arrow indicates the IRS1Y612 and asterisk indicates non-specific band) and Akt threonine phosphorylation at 308 (n=3). Data are the means ± S.E.M. * indicates p<0.05, ** indicates p<0.01, and *** indicates p<0.001 vs. basal in the same group. # indicates p<0.05 vs. corresponding control, using Two way ANOVA with Bonferroni correction.
We next tested if TRB3 inhibits insulin signaling in adult mouse skeletal muscle. Overexpression of TRB3 (4-fold) in tibialis anterior muscles by direct DNA injection significantly inhibited insulin-stimulated IRS1 Tyr612 phosphorylation compared to empty vector injected muscles (Fig. 2c), whereas insulin-stimulated Akt Thr308 and Akt Ser473 phosphorylation tended to decrease with TRB3 overexpression (Fig. 2d and Supplementary Fig. S3). There was no effect of TRB3 overexpression on total expression of IRS1 and Akt (Fig. 2c,d). These data suggest that overexpression of TRB3 impairs proximal insulin signaling in skeletal muscle.
To determine the mechanism by which TRB3 regulates IRS1 signaling, we overexpressed Flag-TRB3 in 293 cells and found an association of TRB3 with IRS1 by both immunoprecipitation-Flag/immunoblotting-IRS1 and immunoprecipitation-IRS1/immunoblotting-Flag (Supplementary Fig. S4a,b). To examine if TRB3-IRS1 binding is present in skeletal muscle, we used tibialis anterior muscle lysates overexpressing Flag-tagged TRB3. Lysates were immunoprecipitated with either IgG or IRS1 antibodies and immunoblotted with Flag to detect TRB3. The association was only present in the muscle lysates immunoprecipitated with IRS1 antibody but not in lysates immunoprecipitated with IgG (Supplementary Fig. S4c), suggesting that TRB3 binds to IRS1 in mouse skeletal muscle. Taken together with our previous study showing Akt binding to TRB3 in muscle6, these data suggest that TRB3 inhibits IRS1 and Akt signaling presumably by direct or indirect association with these proteins.
We next overexpressed TRB3 and inhibited IRS1 downstream signaling proteins, PI3K and Akt using chemical inhibitors, wortmannin and Akt inhibitor VIII to test the hypothesis if the effect of TRB3 on IRS1 and Akt phosphorylation is due to decreased Akt and downstream signaling molecules, which in turn feedback to inhibit IRS1, and found that the effect of TRB3 to impair IRS1 and Akt phosphorylation was not altered by the inhibitors (Fig. 2e,f), suggesting that the effect was not due to feedback inhibition of IRS1 and Akt.
Obesity and diabetes increase ER stress in skeletal muscle
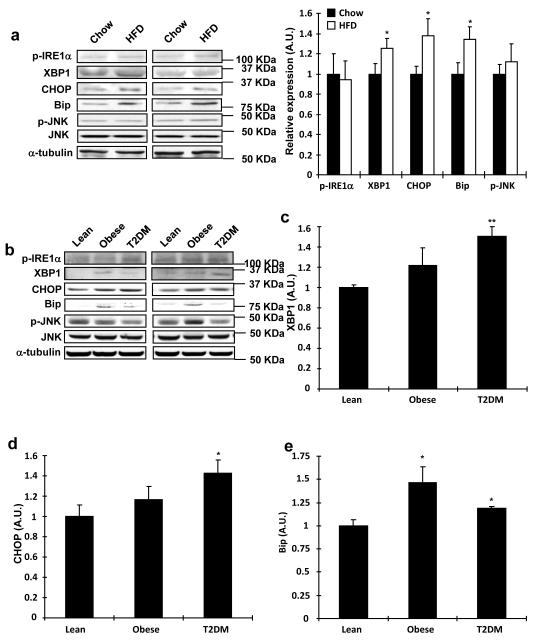
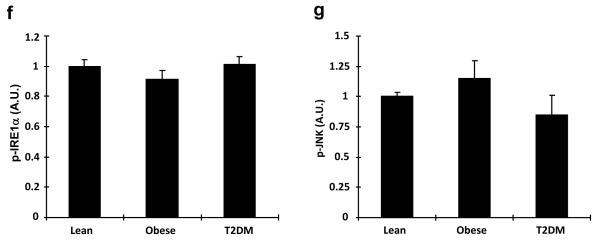
Based on our current data showing that overexpression of TRB3 impaired insulin signaling and a previous study showing the induction of TRB3 by ER stress through ATF4-Chop pathway in multiple cell lines32, we hypothesized that TRB3 may mediate ER stress-induced insulin resistance in skeletal muscle. Therefore, we determined if high fat feeding increased ER stress markers. Indeed, high fat diet for 6 weeks increased expression of ER stress marker proteins including XBP1, CHOP and Bip (Fig. 3a), consistent with a previous study showing high fat feeding of mice increasing mRNA expression of ER stress markers in skeletal muscle27. Phosphorylation of Inositol-requiring enzyme 1 alpha (IRE1α) at Ser724 and JNK was not altered by high fat feeding (Fig. 3a). Next, we measured markers of ER stress in muscle biopsies of the human patients, and found that the obesity- and diabetes-induced increases in TRB3 were accompanied by a significant elevation of several ER stress markers (Fig. 3b). The expression of XBP1 and CHOP were significantly elevated in the patients with diabetes, while there was a tendency toward an increase in these markers in obese patients (Fig. 3c,d). Expression of BiP was significantly elevated in patients with both obesity and diabetes (Fig. 3e). The phosphorylation IRE1α of was not altered (Fig. 3f). In addition, JNK expression and phosphorylation were also not altered in the obese or diabetic patients (Fig. 3g). The expression of TRB3 and XBP1 was significantly correlated with body mass index and TRB3 expression was also correlated with XBP1 (Supplementary Fig. S5). Thus, obesity and type 2 diabetes increase several, but not all ER stress markers in human skeletal muscle, and expression of several ER stress markers is correlated with BMI.
Fig. 3. Expression of ER stress markers in mouse and human skeletal muscle.
(a) TA muscle lysates from high fat fed mice were used to determine the expression of ER stress markers by Western blot analysis (n=6). (b-g) Western blot analysis was done to measure proteins involved in ER stress in vastus lateralis muscle from lean, obese, or diabetic subjects (n=6-13). Data are the means ± S.E.M. * indicates p<0.05 and ** indicates p<0.01 vs. chow or lean controls, using Student’s t-test (a) and One way ANOVA.
ER stress induces TRB3 and inhibits insulin signaling
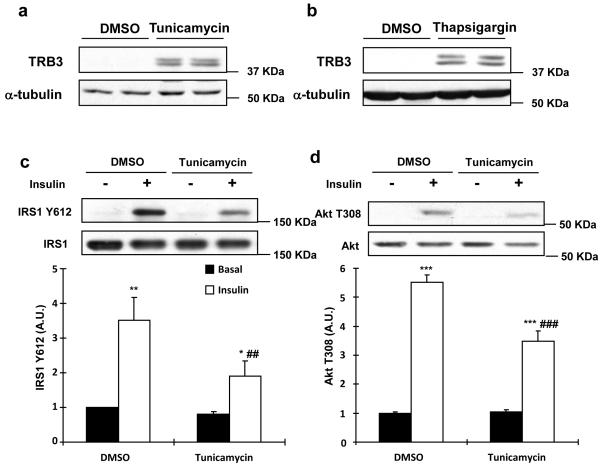
Based on our current data showing that overexpression of TRB3 impaired insulin signaling and that elevations of TRB3 were associated with increased ER stress markers, we next used C2C12 cells to test the hypothesis that TRB3 mediates ER stress-induced insulin resistance in skeletal muscle. TRB3 protein was barely detected in C2C12 cells under basal conditions and after 1 hr of thapsigargin treatment, an ER stressor. However, 2-4 hours of thapsigargin treatment significantly increased TRB3 expression (Supplementary Fig. S6). Incubation of C2C12 cells with an additional ER stressor, tunicamycin, also resulted in a robust increase in TRB3 expression, similar to thapsigargin (Fig. 4a,b). To investigate the effects of these ER stressors on insulin signaling, C2C12 cells were incubated with tunicamycin and thapsigargin for 4 hrs followed by maximal insulin stimulation for 15 min. Tunicamycin significantly impaired insulin-stimulated IRS1 Tyr612 and Akt Thr308 phosphorylation by 67% and 27%, respectively (Fig. 4c,d). Thapsigargin also inhibited insulin-stimulated phosphorylation of IRS1 and Akt (Supplementary Fig. S7). These data demonstrate that ER stressors induce TRB3 expression and impair insulin signaling in C2C12 cells.
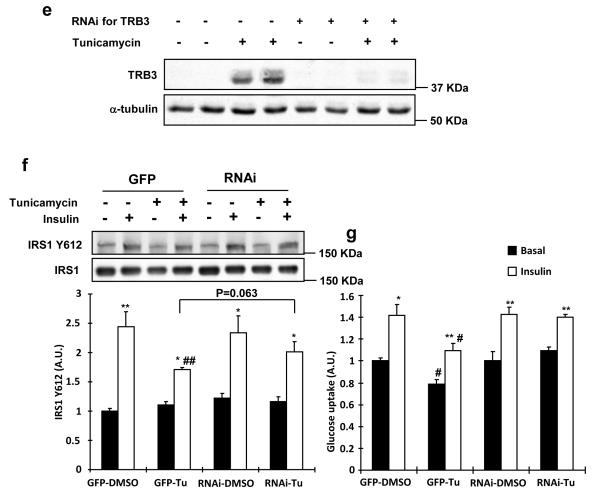
Fig. 4. Effects of ER stress and TRB3 in insulin signaling and glucose uptake in C2C12 cells.
(a,b) C2C12 myotubes were incubated with ER stressors, tunicamycin (1 μg/ml; A) or thapsigargin (1.3 μg/ml; B), for 4 hrs. Lysates were subjected to Western blot analysis to determine TRB3 expression. (c,d) C2C12 myotubes were incubated with tunicamycin for 4 hrs followed by 100 nM of insulin for 10 min. Insulin-stimulated IRS1 tyrosine phosphorylation at 612 (c) and Akt phosphorylation at threonine 308 (d) were determined by Western blot analysis (n=4). (e-g) C2C12 myotubes were infected with adenovirus containing RNAi for TRB3. (e) ER stress-induced TRB3 expression was determined by Western blot analysis. Cells were incubated in the presence or absence of tunicamycin to determine IRS1 Tyr612 phosphorylation (f) and glucose uptake (g) upon insulin stimulation (100 nM) (n=6). Data are the means ± S.E.M. * indicates p<0.05, ** indicates p<0.01, and *** indicates p<0.001 vs. basal in the same group. # indicates p<0.05, ## indicates p<0.01, and ### indicates p<0.001 vs. corresponding control, using Two way ANOVA with Bonferroni correction.
To test the hypothesis that TRB3 mediates ER stress-induced alterations in insulin signaling and glucose uptake, we performed knockdown (80%) studies of TRB3 in C2C12 cells and incubated the cells with tunicamycin for 4 hrs. Tunicamycin treatment increased TRB3 and this effect was significantly blunted by RNAi (Fig. 4e). Tunicamycin treatment impaired insulin-stimulated IRS1 Tyr612 phosphorylation, and this impairment was partially rescued by knockdown of TRB3 (Fig. 4f). In parallel, tunicamycin impaired basal and insulin-stimulated glucose uptake, an effect that was completely rescued by TRB3 knockdown (Fig. 4g). GLUT4 expression was not changed in all groups (Supplementary Fig. S8). These data demonstrate that TRB3 plays an important role in ER stress-induced impairment in insulin signaling and glucose uptake in C2C12 cells.
ER stress decreases glucose uptake via TRB3 in vivo
Isolated extensor digitorum longus (EDL) muscles were incubated with vehicle, tunicamycin, or thapsigargin for 4 hours, which resulted in a 4.0- and 3.3-fold increase in TRB3 mRNA expression, respectively (Fig. 5a). Tunicamycin and thapsigargin incubation also caused an increase in gene expression of ER stress markers Bip and CHOP (Supplementary Fig. S9a,b). Moreover, tunicamycin and thapsigargin treatment in EDL muscles significantly impaired insulin-stimulated glucose uptake (Fig. 5b,c) without changes in GLUT1 and GLUT4 expression (Supplementary Fig. S9c,d). These data suggest that ER stress induces expression of TRB3 and impairs insulin-stimulated glucose uptake in mouse skeletal muscle.
Fig. 5. ER stress and TRB3 inhibit glucose uptake in mouse skeletal muscle.
(a-c) Extensor digitorum longus (EDL) muscles were dissected and incubated in the presence or absence of ER stressors, tunicamycin (1 μg/ml) and thapsigargin (1.3 μg/ml), for 4 hrs. After the incubation, EDL muscles were collected and used for mRNA measurement for TRB3 (a) (n=5). Insulin-stimulated glucose uptake from EDL with tunicamycin (b) and thapsigargin (c) was determined as described in Experimental procedure (n=5). (d,e) EDL (d) and soleus (e) muscles from wild type and TRB3KO mice were dissected and incubated with tunicamycin (1 μg/ml) for 4 hrs (n=6-8). Data are the means ± S.E.M. * indicates p<0.05, ** indicates p<0.01, and *** indicates p<0.001 vs. basal in the same group. # indicates p<0.05, ## indicates p<0.01, and ### indicates p<0.001 vs. corresponding control, using One way ANOVA (a) and Two way ANOVA with Bonferroni correction.
We next used whole body TRB3 knockout mice to determine if deletion of TRB3 rescued skeletal muscle from ER stress-induced insulin resistance. EDL and soleus muscles were isolated and incubated with vehicle or tunicamycin for 4 hours. Tunicamycin impaired insulin-stimulated glucose uptake in control mice, and this effect was fully reversed in the TRB3KO mice (Fig. 5d,e). The TRB3KO mice also displayed elevated insulin-stimulated glucose uptake in the absence of tunicamycin (Fig. 5d,e). Taken together, these data demonstrate that ER stress impairs glucose uptake in mouse skeletal muscle and TRB3 mediates the development of insulin resistance by ER stressors.
TRB3KO mice show no high fat diet-induced insulin resistance
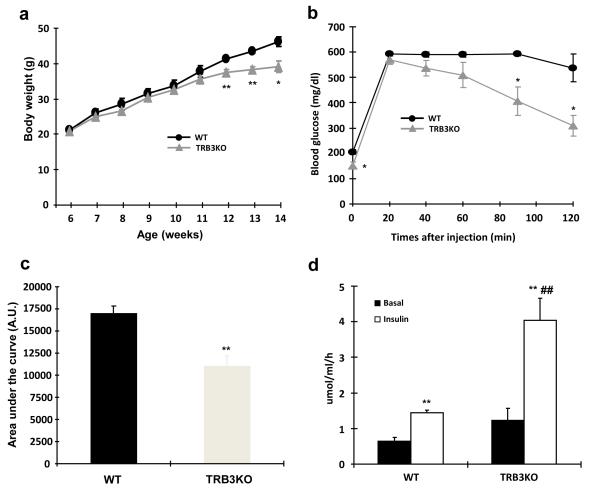
Previous work has shown that 8 week old whole body TRB3 knockout mice have normal glucose homeostasis as evidenced by normal glucose and insulin tolerance, serum glucose, insulin, and lipid levels, and energy metabolism33. Consistent with these results, we also found that TRB3 knockout mice had normal body weights, fasting blood glucose concentrations and glucose tolerance at 26 weeks of age (Supplementary Fig. S10). However, given that ER stress-induced insulin-stimulated glucose uptake was blunted in TRB3 knockout mice (Fig. 5d,e) and that high fat feeding causes an increase in ER stress markers (Fig. 3)27, we hypothesized that TRB3 knockout mice would be protected from high fat diet-induced insulin resistance. To test this hypothesis wild type and TRB3 knockout mice were fed a high fat diet (HFD; 60% fat by kcal) for eight weeks beginning at six weeks of age (Supplementary Fig. S11a,b). Food intake was not different between the groups (WT; 3.2 ± 0.8 g/day vs. TRB3KO; 2.9 ± 0.9 g/day, means ± S.E.M). Eight weeks of high fat feeding increased body weights in both groups, but TRB3 knockout mice exhibited an 11% lower body weight compared to wild type mice (Fig. 6a). TRB3 knockout mice had significantly better glucose tolerance than their control littermates (Fig. 6b) with a 35% decrease in glucose area under the curve (AUC)(Fig. 6c). In the fasted state, serum concentrations of glucose, insulin, and cholesterol were significantly lower in TRB3 knockout mice compared to wild type mice, whereas free fatty acids and triglycerides concentrations were not different (Supplementary Table S1). Serum adiponectin was significantly higher in the TRB3 knockout mice compared to wild type and leptin concentrations were lower (Supplementary Table S1).
Fig. 6. Metabolic consequences of a high-fat diet inTRB3 knockout mice.
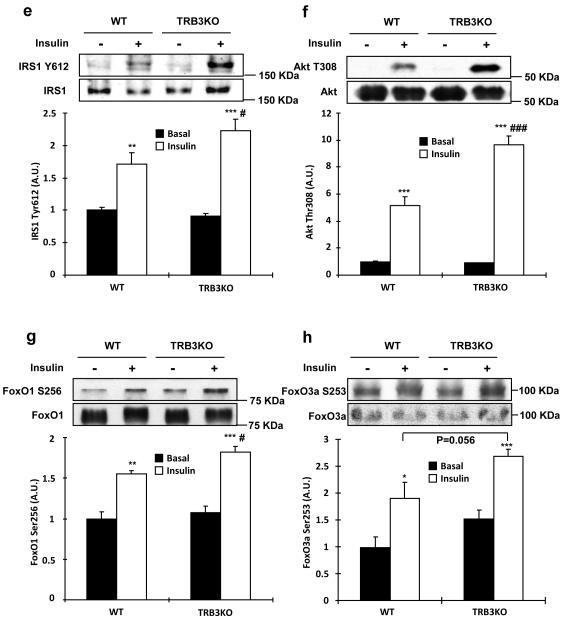
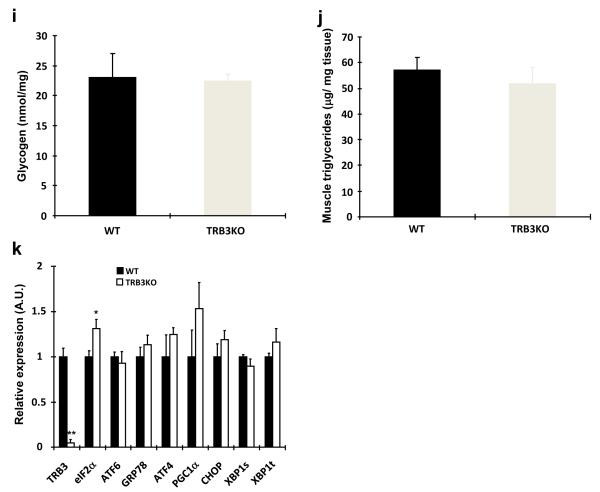
(a-k) Wild type and TRB3 knockout mice at 6 weeks of age were placed on a high fat diet for 8 weeks. (a) Body weights of male mice were tracked every week for 8 weeks during the high fat diet. The TRB3 knockout mice showed lower body weight compared to wild type mice. (b,c) Mice were fasted for 14 hours to perform glucose tolerance test. The TRB3 knockout mice had lower fasting blood glucose concentration (b), improved glucose tolerance (b), and lower area under the curve during the glucose tolerance test (c). (d-k) Mice were fasted for 14 hours and killed to determine insulin-stimulated glucose uptake from soleus muscles (d), insulin-stimulated phosphorylation of IRS1 (e), Akt (f), FoxO1 (g), and FoxO3a (h) in EDL muscles, and glycogen in TA muscles (i), triglycerides from gastrocnemius muscles (j), and mRNA expression of ER stress markers from TA muscles (k). Data are the means ± S.E.M., n=3-6/group. * indicates p<0.05, ** indicates p<0.01, and *** indicates p<0.001 vs. wild type or basal in the same group. # indicates p<0.05, ## indicates p<0.01, and ### indicates p<0.001 vs. corresponding control in the wild type, using Student’s t-test (a,b,c,k) and Two way ANOVA with Bonferroni correction (d,e,f,g,h).
To determine if the improved glucose tolerance is due to increased glucose uptake in skeletal muscle, we isolated soleus muscles from wild type and TRB3KO mice. Consistent with the improved glucose tolerance, insulin-stimulated glucose uptake was 2.8-fold higher in the muscles from TRB3KO mice (Fig. 6d). The increased glucose uptake was associated with increased insulin-stimulated IRS1 Tyr612, Akt Thr308, and FoxO phosphorylation in TRB3KO mice (Fig. 6e-h). There was no difference in GLUT1 and GLUT4 expression (Supplementary Fig. S11c-d). The increases in insulin signaling and glucose uptake were not due to differences in muscle glycogen or triglycerides concentrations in the TRB3 knockout mice (Fig. 6i,j and Supplementary Fig. S11e). TRB3 knockout mice did not have altered expression of ER stress markers in the muscle (Fig. 6k), consistent with ER stress regulation of TRB3 expression, and not TRB3 regulating ER stress markers.
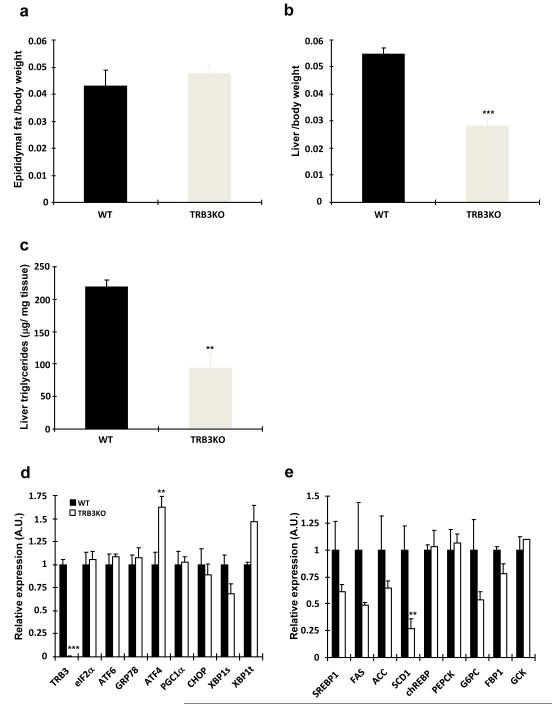
To further understand the mechanism for the improved glucose tolerance in the TRB3 knockout mice, we studied epididymal adipose tissue and liver. There was no difference in epididymal fat pad weight between wild type and TRB3 knockout mice (Fig. 7a). In contrast, tissue weights and triglyceride concentrations were significantly lower in the livers from TRB3 knockout mice (Fig. 7b,c), indicating that the TRB3 knockout mice were protected from high fat diet-induced liver steatosis. Consistent with results in skeletal muscle, mRNA expression of ER stress markers in the liver were not different in TRB3 knockout mice compared with wild type (Fig. 7d). Analysis of mRNA expression of genes involved in glucose production (chREBP, PEPCK, G6PC, FBP1, and GCK) revealed similar levels of expression, whereas the genes involved in lipid synthesis (SREBP1, FAS, ACC, and SCD1) were significantly lower in TRB3 knockout mice (Fig. 7e). This reduction in expression of lipogenic enzymes is a likely mechanism for the decreased hepatosteatosis in high fat-fed TRB3 knockout mice. Thus, the improved whole body glucose homeostasis in TRB3 knockout mice is likely due to changes in both skeletal muscle and liver.
Fig. 7. The effects of TRB3 knockout on Liver and adipose tissue in response to high fat diet.
Eight weeks after high fat diet, wild type and TRB3 knockout mice were killed and epididymal fat (a) and liver (b) weights were determined. (c) Hepatic triglycerides were measured to determine liver steatosis. RNA was isolated from liver tissue to determine gene expression involved in ER stress (d) and lipogenesis and gluconeogenesis (e). Data are the means ± S.E.M., n=3-6/group. ** indicates p<0.01 and *** indicates p<0.001 vs. wild type, using Student’s t-test.
DISCUSSION
Patients with type 2 diabetes are typically characterized by insulin resistance in skeletal muscle, the tissue responsible for the majority of insulin-stimulated glucose disposal1. Therefore, it is important to understand the molecular mechanisms leading to the development of skeletal muscle insulin resistance. In the current study we tested the hypothesis that TRB3 plays a role in ER stress-induced insulin resistance in skeletal muscle. The current results support this hypothesis as indicated by: 1) expression of TRB3 and ER stress markers was increased in multiple models of insulin resistance in muscle cells, mouse skeletal muscle, and human skeletal muscle; 2) overexpression of TRB3 in C2C12 cells and skeletal muscle impaired insulin signaling and glucose uptake; 3) knockdown of TRB3 in C2C12 myotube and mouse models significantly blunted the effects of ER stressors to impair insulin signaling and glucose uptake; and 4) TRB3 knockout mice were protected from high fat diet-induced insulin resistance.
Our findings that TRB3 mediates ER stress-induced decreases in insulin signaling and glucose uptake suggest a critical role for this protein in muscle metabolism. Earlier studies have suggested that TRB3 may be important for glucose metabolism in skeletal muscle, although this hypothesis has not been tested directly. For example, overexpression of TRB3 in L6 cells resulted in impaired insulin signaling 9, consistent with our data showing that TRB3 overexpression decreased insulin signaling in C2C12 cells. In another study an acute bout of exercise decreased TRB3 expression in ob/ob mice, which the authors proposed may have contributed to the exercise-induced improvement in glucose tolerance in these animals10. Furthermore, muscle-specific overexpression of PGC1α in mice, which resulted in exacerbation of high fat diet-induced insulin resistance, was associated with elevated TRB3 expression34. While all of these studies are consistent with TRB3 regulating glucose metabolism, our data directly tested this hypothesis through the use of multiple overexpression and knockdown models of TRB3. All of the current data demonstrate that TRB3 has an inhibitory role to decrease insulin-stimulated glucose uptake in skeletal muscle.
In the current study we detected TRB3 expression in mouse and human skeletal muscle, consistent with previous findings6, 10, 34, 35. In contrast, in a study focused on mouse gastrocnemius muscle33, TRB3 protein was only shown to be expressed when the muscle underwent denervation. This is consistent with our findings as we detected low mRNA expression of TRB3 in white gastrocnemius muscle (Fig. 1a), but observed higher expression in muscles that express oxidative red fibers including tibialis anterior, red gastrocnemius and soleus, suggesting that TRB3 expression may be fiber-type specific. It is interesting that denervation resulted in an increase in TRB3 expression in white gastrocnemius muscle33. Since skeletal muscle denervation results in insulin resistance in this tissue36-38, it is possible that TRB3 plays a role in denervation-induced insulin resistance in skeletal muscle. In addition, expression of ER stress markers has been shown to be increased in the muscle from patients with myotonic dystrophy type 126, raising the possibility that ER stress is involved in muscle wasting-associated insulin resistance in this disease. Thus, TRB3 increases under some conditions of muscle dysfunction, and could contribute to the metabolic impairment associated with these diseases.
We found that a high fat diet in mice, and both obesity and type 2 diabetes in humans increased TRB3 expression in skeletal muscle. The mechanism by which these conditions increase TRB3 expression is not known but one possibility is that the elevated circulating insulin concentrations that are present in high fat-fed mice and subjects with obesity and type 2 diabetes mediate the induction of TRB3 in the muscle. In support of this hypothesis we found that insulin incubation of C2C12 myotubes for 16hrs increased TRB3 expression along with increased expression of ER stress markers, which was abolished by inhibitors for PI3K and Akt. Studies in FAO hepatoma and 3T3-L1 adipocyte cells have also demonstrated that insulin induces the expression of TRB3 through C/EBPβ binding in the TRB3 promoter39. Taken together, these data support the hypothesis that elevated insulin concentrations could mediate the effects of high fat feeding, obesity, and type 2 diabetes to increase TRB3 expression in mouse and human skeletal muscle.
Given the function of TRB3 in insulin signaling and glucose metabolism in liver3 and β-cells8 and the increased insulin-stimulated glucose uptake in the skeletal muscle from TRB3KO mice (Fig. 5d,e), it was somewhat surprising that whole body TRB3KO mice on a chow diet showed no alteration in glucose homeostasis33. The lack of effect may be due to the different functions of TRB3 in various tissues, thereby offsetting any beneficial effects of ablation of TRB3. For example, overexpression of TRB3 in adipocytes promoted fatty acid oxidation and protected mice from high fat induced obesity4, whereas overexpression of TRB3 impaired glucose metabolism in liver and skeletal muscle and inhibited insulin secretion in β-cells8. Thus, in global TRB3 knockout mice, the beneficial effects of reduced TRB3 in liver, skeletal muscle, and pancreas on glucose homeostasis may be masked by the detrimental effects of a reduction in adipocyte TRB3 expression.
Although there was no change in whole body glucose homeostasis in TRB3 knockout mice fed a chow diet33, we found that TRB3 knockout mice were protected from high fat diet-induced insulin resistance. The TRB3 knockout mice showed improved glucose tolerance, increased skeletal muscle insulin-stimulated glucose uptake, and less triglyceride accumulation in the liver after eight weeks on a high fat diet. These data indicate that the beneficial effects of deletion of TRB3 are more pronounced under stress conditions such as high fat feeding. It is interesting that high fat feeding resulted in 56% lower liver triglyceride concentrations in the knockout mice, which contributed to the lower liver weights in the knockout mice. This is consistent with previous studies showing that improved insulin signaling in the liver protected mice from high fat diet-induced hepatic steatosis, whereas impaired insulin signaling in the liver increased high fat diet-induced lipid accumulation40-45. Thus, the lower lipid accumulation in liver of TRB3 knockout mice is presumably due to improved insulin signaling.
In summary, ER stress induces expression of TRB3 in skeletal muscle, which results in impairment of insulin signaling and glucose uptake. Knockdown of TRB3 significantly blunts the effects of ER stress on glucose uptake and TRB3 knockout mice are protected from high fat diet-induced insulin resistance. We conclude TRB3 plays an important role in ER stress-induced insulin resistance in skeletal muscle. Our data also suggest that inhibition of TRB3 expression in skeletal muscle may be a new therapeutic target for effectively managing insulin resistance.
MATERIALS AND METHODS
Animals
Protocols for animal use and experimental procedures were conducted in accordance with NIH guidelines and approved by the Institutional Animal Care and Use Committee of the Joslin Diabetes Center. Mice were from Taconic (ICR), Charles River (C57BL/6), or were whole body TRB3 knockout mice33, and were studied at 8-12 weeks of age, as specified in figure legends. Mice were maintained in a pathogen-free animal facility under standard 12-hour light/12-hour dark cycle, and unless indicated, were maintained on a chow diet (20% of calorie from fat; Lab Diet 5020). To study the effects of high fat feeding, mice were fed a high fat diet (60% of calorie from fat; Research Diets Inc D12492) beginning at the age of 6 weeks for 8 weeks.
Human studies
Biopsies of vastus lateralis muscle were obtained from lean (BMI = 25.1 ± 0.7 kg/m2), obese nondiabetic (BMI = 32.6 ± 1.5 kg/m2), and obese diabetic (BMI = 32.8 ± 1.1 kg/m2). These patients have been previously characterized46, and subject characteristics are presented in Supplementary Table S2. The human studies were approved by the Institutional Review Board of the University of Texas Health Science Center at San Antonio (UTHSCSA) and the committee on human studies at the Joslin Diabetes Center (no. CHS08-22).
Cell culture
C2C12 myoblasts were maintained in DMEM supplemented with 10% FBS in a humidified atmosphere containing 5% CO2 at 37°C. When cells reached confluence in 6-well plates, differentiation was induced in media containing 2% horse serum for 4 days. Adenoviruses containing TRB3 or RNAi for TRB3 were infected into the myotubes3, 6, 7. For the immunoprecipitation, 293T cells were transfected with Flag-tagged empty vector or Flag-TRB3 plasmid. Lysates were used for immunoprecipitation two days after the transfection.
In Vivo Gene Transfer in Mouse Skeletal Muscle
Plasmids containing Flag-tag empty vector or Flag-TRB3 were directly injected into mouse tibialis anterior muscles47-49. The mice were anesthetized with an intraperitoneal injection of pentobarbital sodium (90 mg/kg), and 100 μg of each DNA construct was injected longitudinally into the tibialis anterior muscle with a 29-guage needle. Stainless steel electrode needles fixed 4 mm apart were then inserted into the transverse muscle belly and square wave electrical pulses (200 V/cm) were applied eight times at a rate of one pulse/s (duration, 20 ms) using a Grass S88 pulse generator (Grass Instruments, Quincy, MA). Our lab has demonstrated that transfection efficiency with the LacZ gene under this protocol is ~85%47.
Measurement of glucose uptake
Muscle glucose uptake in vitro was measured50, 51. Soleus and extensor digitorum longus (EDL) muscles were dissected and incubated in Krebs-Ringer bicarbonate buffer (KRB), pH 7.4, containing 2 mM pyruvate for 4 hrs in the presence or absence of ER stressors tunicamycin or thapsigargin. Muscles were then incubated in KRB buffer in the presence or absence of 100 nM insulin for 30 min, and glucose uptake was measured using [3H]-2-deoxyglucose. Differentiated C2C12 myotubes were serum starved for 3 h in DMEM before any treatment. Cells were incubated with 100 nM insulin for 20 min. After stimulation, cells were washed with buffer containing 140 mM NaCl, 20 mM Hepes-Na (pH 7.4), 5 mM KCl, 2.5 mM MgSO4, and 1.0 mM CaCl2. Glucose transport was determined by the addition of [3H]-2-deoxyglucose for 10 min on ice. Cells were washed with ice-cold saline solution and harvested in 0.05 N NaOH to determine net accumulation of [3H]-2-deoxyglucose52.
RNA isolation and Real-time PCR analysis
Total RNA was extracted from incubated muscles or C2C12 cells using RNeasy Mini Kit (Qiagen). First strand cDNA was synthesized using reverse transcriptase (Sigma). Primer sequences for the Real-time PCR can be found in Supplementary Table S3. Relative mRNA levels were calculated with the PCR product for each primer set normalized to TBP RNA.
Western blot analysis and antibodies
Tissues and cells were rapidly processed in lysis buffer49. Western blot analyses were used to assess protein and phosphorylation levels of various molecules. Primary antibodies purchased from commercial sources included α-tubulin, pY99, XBP1, and insulin receptor (Santa Cruz; 1:500); IRS2 (Millipore; 1:2000); p-IRE1α (Novus Biologicals; 1:1000); IRS1 and JNK (Upstate; 1:2000); IRS-1-Tyr612 (Biosource; 1:2000); and p-Akt-Thr308, Akt, Bip, CHOP, FoxO1, FoxO3, p-FoxO1-Ser256 and p-FoxO3-Ser253 (Cell Signaling; 1:2000). Secondary antibodies used were horseradish peroxidase (HRP)-conjugated anti-rabbit (Amersham; 1:2000), HRP-conjugated anti-mouse (Upstate; 1:3000), and HRP-conjugated anti-goat (Promega; 1:2000). Antibody to TRB3 was a gift from Dr. Montminy3, 53. Blots were developed using ECL reagents (Amersham Pharmacia), and bands were visualized and quantified using AlphaEaseFC v. 2.01 (Alpha Innotech).
Statistical analysis
Data are means ± S.E.M. All data were compared using Student’s t-test, paired t-test, one-way ANOVA, or two-way ANOVA. Correlation analyses utilized the Pearson’s coefficient. The differences between groups were considered significant when p < 0.05.
Supplementary Material
ACKNOWLEDGEMENTS
The authors thank Dr. M. Montminy (Salk Institute) for providing TRB3 antibody and adenoviruses for TRB3 and RNAi for TRB3, Julie A. Ripley (Joslin Diabetes Center) for editorial contributions, and all other members of the Goodyear lab for critical discussions. This work was supported by NIH grants to H.J.K. (5P30DK036836 and P30DK040561), to L.J.G. (R01AR045670), to R.N.K. (5R01DK067536) and to the Joslin DERC (P30DK036836). T.T. and M.Y.L were supported by ADA mentor based fellowships (to L.J.G.).
Footnotes
AUTHOR CONTRIBUTIONS H.J.K. designed research; H.J.K., T.T., M.M.J., M.Y.L., and M.F.H. performed research; H.J.K., T.T., and M.Y.L. analyzed data; M.W.S., R.N.K., and N.M. provided critical reagents; H.J.K. and L.J.G. wrote the paper.
COMPETING FINANCIAL INTERESTS The authors declare no competing financial interests.
REFERENCES
- 1.DeFronzo RA, Ferrannini E, Sato Y, Felig P. Synergistic interaction between exercise and insulin on peripheral glucose uptake. J. Clin. Invest. 1981;68:1468–1474. doi: 10.1172/JCI110399. [DOI] [PMC free article] [PubMed] [Google Scholar]
- 2.Wu M, Xu LG, Zhai Z, Shu HB. SINK is a p65-interacting negative regulator of NF-kappaB-dependent transcription. J. Biol. Chem. 2003;278:27072–27079. doi: 10.1074/jbc.M209814200. [DOI] [PubMed] [Google Scholar]
- 3.Du K, Herzig S, Kulkarni RN, Montminy M. TRB3: a tribbles homolog that inhibits Akt/PKB activation by insulin in liver. Science. 2003;300:1574–1577. doi: 10.1126/science.1079817. [DOI] [PubMed] [Google Scholar]
- 4.Qi L, et al. TRB3 links the E3 ubiquitin ligase COP1 to lipid metabolism. Science. 2006;312:1763–1766. doi: 10.1126/science.1123374. [DOI] [PubMed] [Google Scholar]
- 5.Avery J, et al. TRB3 function in cardiac endoplasmic reticulum stress. Circ. Res. 2010;106:1516–1523. doi: 10.1161/CIRCRESAHA.109.211920. [DOI] [PMC free article] [PubMed] [Google Scholar]
- 6.Koh HJ, et al. Skeletal muscle-selective knockout of LKB1 increases insulin sensitivity, improves glucose homeostasis, and decreases TRB3. Mol. Cell. Biol. 2006;26:8217–8227. doi: 10.1128/MCB.00979-06. [DOI] [PMC free article] [PubMed] [Google Scholar]
- 7.Koo SH, et al. PGC-1 promotes insulin resistance in liver through PPAR-alpha-dependent induction of TRB-3. Nat. Med. 2004;10:530–534. doi: 10.1038/nm1044. [DOI] [PubMed] [Google Scholar]
- 8.Liew CW, et al. The pseudokinase tribbles homolog 3 interacts with ATF4 to negatively regulate insulin exocytosis in human and mouse beta cells. J. Clin. Invest. 2010;120:2876–2888. doi: 10.1172/JCI36849. [DOI] [PMC free article] [PubMed] [Google Scholar]
- 9.Liu J, et al. Mammalian Tribbles homolog 3 impairs insulin action in skeletal muscle: role in glucose-induced insulin resistance. Am. J. Physiol. Endocrinol. Metab. 2010;298:E565–E576. doi: 10.1152/ajpendo.00467.2009. [DOI] [PMC free article] [PubMed] [Google Scholar]
- 10.Matos A, et al. Acute exercise reverses TRB3 expression in the skeletal muscle and ameliorates whole body insulin sensitivity in diabetic mice. Acta Physiol. (Oxf) 2010;198:61–69. doi: 10.1111/j.1748-1716.2009.02031.x. [DOI] [PubMed] [Google Scholar]
- 11.Engin F, Hotamisligil GS. Restoring endoplasmic reticulum function by chemical chaperones: an emerging therapeutic approach for metabolic diseases. Diabetes Obes. Metab. 2010;12(Suppl 2):108–115. doi: 10.1111/j.1463-1326.2010.01282.x. [DOI] [PubMed] [Google Scholar]
- 12.Wang S, Kaufman RJ. The impact of the unfolded protein response on human disease. J. Cell. Biol. 2012;197:857–867. doi: 10.1083/jcb.201110131. [DOI] [PMC free article] [PubMed] [Google Scholar]
- 13.Hotamisligil GS. Endoplasmic reticulum stress and the inflammatory basis of metabolic disease. Cell. 2010;19(140):900–917. doi: 10.1016/j.cell.2010.02.034. [DOI] [PMC free article] [PubMed] [Google Scholar]
- 14.Walter P, Ron D. The unfolded protein response: from stress pathway to homeostatic regulation. Science. 2011;334:1081–1086. doi: 10.1126/science.1209038. [DOI] [PubMed] [Google Scholar]
- 15.Ozcan U, et al. Endoplasmic reticulum stress links obesity, insulin action, and type 2 diabetes. Science. 2004;306:457–461. doi: 10.1126/science.1103160. [DOI] [PubMed] [Google Scholar]
- 16.Ozcan U, et al. Chemical chaperones reduce ER stress and restore glucose homeostasis in a mouse model of type 2 diabetes. Science. 2006;313:1137–1140. doi: 10.1126/science.1128294. [DOI] [PMC free article] [PubMed] [Google Scholar]
- 17.Elouil H, et al. Acute nutrient regulation of the unfolded protein response and integrated stress response in cultured rat pancreatic islets. Diabetologia. 2007;50:1442–1452. doi: 10.1007/s00125-007-0674-4. [DOI] [PubMed] [Google Scholar]
- 18.Lipson KL, et al. Regulation of insulin biosynthesis in pancreatic beta cells by an endoplasmic reticulum-resident protein kinase IRE1. Cell Metab. 2006;4:245–254. doi: 10.1016/j.cmet.2006.07.007. [DOI] [PubMed] [Google Scholar]
- 19.Cnop M, et al. Selective inhibition of eukaryotic translation initiation factor 2 alpha dephosphorylation potentiates fatty acid-induced endoplasmic reticulum stress and causes pancreatic beta-cell dysfunction and apoptosis. J. Biol. Chem. 2007;282:3989–3997. doi: 10.1074/jbc.M607627200. [DOI] [PubMed] [Google Scholar]
- 20.Karaskov E, et al. Chronic palmitate but not oleate exposure induces endoplasmic reticulum stress, which may contribute to INS-1 pancreatic beta-cell apoptosis. Endocrinology. 2006;147:3398–3407. doi: 10.1210/en.2005-1494. [DOI] [PubMed] [Google Scholar]
- 21.Cardozo AK, et al. Cytokines downregulate the sarcoendoplasmic reticulum pump Ca2+ ATPase 2b and deplete endoplasmic reticulum Ca2+, leading to induction of endoplasmic reticulum stress in pancreatic beta-cells. Diabetes. 2005;54:452–461. doi: 10.2337/diabetes.54.2.452. [DOI] [PubMed] [Google Scholar]
- 22.Kimura K, Jin H, Ogawa M, Aoe T. Dysfunction of the ER chaperone BiP accelerates the renal tubular injury. Biochem. Biophys. Res. Commun. 2008;366:1048–1053. doi: 10.1016/j.bbrc.2007.12.098. [DOI] [PubMed] [Google Scholar]
- 23.Thuerauf DJ, et al. Activation of the unfolded protein response in infarcted mouse heart and hypoxic cultured cardiac myocytes. Circ. Res. 2006;99:275–282. doi: 10.1161/01.RES.0000233317.70421.03. [DOI] [PubMed] [Google Scholar]
- 24.Li SY, Ren J. Cardiac overexpression of alcohol dehydrogenase exacerbates chronic ethanol ingestion-induced myocardial dysfunction and hypertrophy: role of insulin signaling and ER stress. J. Mol. Cell Cardiol. 2008;44:992–1001. doi: 10.1016/j.yjmcc.2008.02.276. [DOI] [PMC free article] [PubMed] [Google Scholar] [Retracted]
- 25.Mao W, et al. Darbepoetin alfa exerts a cardioprotective effect in autoimmune cardiomyopathy via reduction of ER stress and activation of the PI3K/Akt and STAT3 pathways. J. Mol. Cell Cardiol. 2008;45:250–260. doi: 10.1016/j.yjmcc.2008.05.010. [DOI] [PMC free article] [PubMed] [Google Scholar]
- 26.Ikezoe K, et al. Endoplasmic reticulum stress in myotonic dystrophy type 1 muscle. Acta Neuropathol. 2007;114:527–535. doi: 10.1007/s00401-007-0267-9. [DOI] [PubMed] [Google Scholar]
- 27.Deldicque L, et al. The unfolded protein response is activated in skeletal muscle by high-fat feeding: potential role in the downregulation of protein synthesis. Am. J. Physiol. Endocrinol. Metab. 2010;299:E695–E705. doi: 10.1152/ajpendo.00038.2010. [DOI] [PubMed] [Google Scholar]
- 28.Peter A, et al. Individual stearoyl-coa desaturase 1 expression modulates endoplasmic reticulum stress and inflammation in human myotubes and is associated with skeletal muscle lipid storage and insulin sensitivity in vivo. Diabetes. 2009;58:1757–1765. doi: 10.2337/db09-0188. [DOI] [PMC free article] [PubMed] [Google Scholar]
- 29.Wu J, et al. The unfolded protein response mediates adaptation to exercise in skeletal muscle through a PGC-1alpha/ATF6alpha complex. Cell Metab. 2011;13:160–169. doi: 10.1016/j.cmet.2011.01.003. [DOI] [PMC free article] [PubMed] [Google Scholar]
- 30.Jove M, Planavila A, Laguna JC, Vazquez-Carrera M. Palmitate-induced interleukin 6 production is mediated by protein kinase C and nuclear-factor kappaB activation and leads to glucose transporter 4 down-regulation in skeletal muscle cells. Endocrinology. 2005;146:3087–3095. doi: 10.1210/en.2004-1560. [DOI] [PubMed] [Google Scholar]
- 31.Esposito DL, Li Y, Cama A, Quon MJ. Tyr(612) and tyr(632) in human insulin receptor substrate-1 are important for full activation of insulin-stimulated phosphatidylinositol 3-kinase activity and translocation of glut4 in adipose cells. Endocrinology. 2001;142:2833–2840. doi: 10.1210/endo.142.7.8283. [DOI] [PubMed] [Google Scholar]
- 32.Ohoka N, Yoshii S, Hattori T, Onozaki K, Hayashi H. TRB3, a novel ER stress-inducible gene, is induced via ATF4-CHOP pathway and is involved in cell death. EMBO J. 2005;24:1243–1255. doi: 10.1038/sj.emboj.7600596. [DOI] [PMC free article] [PubMed] [Google Scholar]
- 33.Okamoto H, et al. Genetic deletion of Trb3, the mammalian Drosophila tribbles homolog, displays normal hepatic insulin signaling and glucose homeostasis. Diabetes. 2007;56:1350–1356. doi: 10.2337/db06-1448. [DOI] [PubMed] [Google Scholar]
- 34.Choi CS, et al. Paradoxical effects of increased expression of PGC-1alpha on muscle mitochondrial function and insulin-stimulated muscle glucose metabolism. Proc. Natl. Acad. Sci. U. S. A. 2008;105:19926–19931. doi: 10.1073/pnas.0810339105. [DOI] [PMC free article] [PubMed] [Google Scholar]
- 35.Mortensen OH, Frandsen L, Schjerling P, Nishimura E, Grunnet N. PGC-1alpha and PGC-1beta have both similar and distinct effects on myofiber switching toward an oxidative phenotype. Am. J. Physiol. Endocrinol. Metab. 2006;291:E807–E816. doi: 10.1152/ajpendo.00591.2005. [DOI] [PubMed] [Google Scholar]
- 36.Hirose M, et al. Long-term denervation impairs insulin receptor substrate-1-mediated insulin signaling in skeletal muscle. Metabolism. 2001;50:216–222. doi: 10.1053/meta.2001.20169. [DOI] [PubMed] [Google Scholar]
- 37.Lauritzen HP, et al. Denervation and high-fat diet reduce insulin-signalling in t-tubules in skeletal muscle of living mice. Diabetes. 2008;57:13–23. doi: 10.2337/db07-0516. [DOI] [PubMed] [Google Scholar]
- 38.Han XX, Fernando PK, Bonen A. Denervation provokes greater reductions in insulin-stimulated glucose transport in muscle than severe diabetes. Mol. Cell. Biochem. 2000;210:81–89. doi: 10.1023/a:1007108025929. [DOI] [PubMed] [Google Scholar]
- 39.Du K, Ding J. Insulin regulates TRB3 and other stress-responsive gene expression through induction of C/EBPbeta. Mol. Endocrinol. 2009;23:475–485. doi: 10.1210/me.2008-0284. [DOI] [PMC free article] [PubMed] [Google Scholar]
- 40.Seppala-Lindroos A, et al. Fat accumulation in the liver is associated with defects in insulin suppression of glucose production and serum free fatty acids independent of obesity in normal men. J. Clin. Endocrinol. Metab. 2002;87:3023–3028. doi: 10.1210/jcem.87.7.8638. [DOI] [PubMed] [Google Scholar]
- 41.Matsumoto M, et al. Role of the insulin receptor substrate 1 and phosphatidylinositol 3-kinase signaling pathway in insulin-induced expression of sterol regulatory element binding protein 1c and glucokinase genes in rat hepatocytes. Diabetes. 2002;51:1672–1680. doi: 10.2337/diabetes.51.6.1672. [DOI] [PubMed] [Google Scholar]
- 42.Kumashiro N, et al. Cellular mechanism of insulin resistance in nonalcoholic fatty liver disease. Proc. Natl. Acad. Sci. U. S. A. 2011;108:16381–16385. doi: 10.1073/pnas.1113359108. [DOI] [PMC free article] [PubMed] [Google Scholar]
- 43.Haas JT, et al. Hepatic insulin signaling is required for obesity-dependent expression of SREBP-1c mRNA but not for feeding-dependent expression. Cell Metab. 2012;15:873–884. doi: 10.1016/j.cmet.2012.05.002. [DOI] [PMC free article] [PubMed] [Google Scholar]
- 44.Bezy O, et al. PKCdelta regulates hepatic insulin sensitivity and hepatosteatosis in mice and humans. J. Clin. Invest. 2011;121:2504–2517. doi: 10.1172/JCI46045. [DOI] [PMC free article] [PubMed] [Google Scholar]
- 45.Chitturi S, et al. NASH and insulin resistance: Insulin hypersecretion and specific association with the insulin resistance syndrome. Hepatology. 2002;35:373–379. doi: 10.1053/jhep.2002.30692. [DOI] [PubMed] [Google Scholar]
- 46.Tantiwong P, et al. NF-kappaB activity in muscle from obese and type 2 diabetic subjects under basal and exercise-stimulated conditions. Am. J. Physiol. Endocrinol. Metab. 2010;299:E794–E801. doi: 10.1152/ajpendo.00776.2009. [DOI] [PMC free article] [PubMed] [Google Scholar]
- 47.Fujii N, et al. Overexpression or ablation of JNK in skeletal muscle has no effect on glycogen synthase activity. Am. J. Physiol. Cell. Physiol. 2004;287:C200–C208. doi: 10.1152/ajpcell.00415.2003. [DOI] [PubMed] [Google Scholar]
- 48.Kramer HF, et al. AS160 regulates insulin- and contraction-stimulated glucose uptake in mouse skeletal muscle. J. Biol. Chem. 2006;281:31478–85. doi: 10.1074/jbc.M605461200. [DOI] [PubMed] [Google Scholar]
- 49.Koh HJ, et al. Sucrose nonfermenting AMPK-related kinase (SNARK) mediates contraction-stimulated glucose transport in mouse skeletal muscle. Proc. Natl. Acad. Sci. U. S. A. 2010;107:15541–15546. doi: 10.1073/pnas.1008131107. [DOI] [PMC free article] [PubMed] [Google Scholar]
- 50.Hayashi T, Hirshman MF, Kurth EJ, Winder WW, Goodyear LJ. Evidence for 5′ AMP-activated protein kinase mediation of the effect of muscle contraction on glucose transport. Diabetes. 1998;47:1369–1373. doi: 10.2337/diab.47.8.1369. [DOI] [PubMed] [Google Scholar]
- 51.Fujii N, Jessen N, Goodyear LJ. AMP-activated protein kinase and the regulation of glucose transport. Am. J. Physiol. Endocrinol. Metab. 2006;291:E867–E877. doi: 10.1152/ajpendo.00207.2006. [DOI] [PubMed] [Google Scholar]
- 52.Nedachi T, Kanzaki M. Regulation of glucose transporters by insulin and extracellular glucose in C2C12 myotubes. Am. J. Physiol. Endocrinol. Metab. 2006;291:E817–E828. doi: 10.1152/ajpendo.00194.2006. [DOI] [PubMed] [Google Scholar]
- 53.Yu H, Fujii N, Hirshman MF, Pomerleau JM, Goodyear LJ. Cloning and characterization of mouse 5′-AMP-activated protein kinase {gamma}3 subunit. Am. J. Physiol. Cell. Physiol. 2004;286:C283–C292. doi: 10.1152/ajpcell.00319.2003. [DOI] [PubMed] [Google Scholar]
Associated Data
This section collects any data citations, data availability statements, or supplementary materials included in this article.


