Short abstract
Renal disease is epidemic in the United States with approximately 8 × 10⁶ people having chronic kidney disease. Renal biopsies are widely used to provide essential diagnostic information to physicians. However, the risk of bleeding complications possibly leading to life-threatening situations results in the contra-indication of biopsy in certain patient populations. Safer renal biopsies will allow more accurate diagnosis and better management of this epidemic health problem. We report the preclinical testing of a novel biopsy device called the therapeutic injection system (TIS). The device introduces a third stage to the standard two-stage side-cut percutaneous biopsy process. The third stage is designed to reduce bleeding complications by injecting a hemostatic plug at the time of biopsy. Laboratory evaluation and preliminary in vivo animal testing using an anticoagulated porcine model of the TIS and Bard Monopty® (Bard Medical, Covington, GA) control device were performed. The hemostatic material Gelfoam® (Pfizer, Brussels, Belgium) was selected as the active material comprising the hemostatic plugs. The performance of two composite plugs, one composed of polyvinyl alcohol (PVA) combined in 2:1 and 12:1 ratios with the hemostatic material, and one plug composed of 100 hemostatic material were tested. Stroke sequence and hemostatic plug deployment were verified by sequential firing of the TIS biopsy needle into clear gelatin and ex vivo bovine kidney specimens. In vivo trials with porcine specimens revealed a significant reduction in blood loss (8.1 3.9 ml, control versus 1.9 1.6 ml, 12:1 PVA/hemostatic, TIS, = 0.01, = 6). The 100 hemostatic plug showed a substantial and immediate reduction in blood loss (9.2 ml, control versus 0.0 ml, TIS, = 1). The prototype device was shown to work repeatedly and reliably in laboratory trials. Initial results show promise in this approach to control post biopsy bleeding. This solution maintains the simplicity and directness of the percutaneous approach, while not significantly changing the standard percutaneous biopsy procedure.
Keywords: biopsy, kidney, hemostatic, bleeding
1. Introduction
Renal disease is epidemic in the United States with 8 × 10⁶ people having chronic kidney disease (CKD) with a glomerular filtration rate of less than 60 ml/min and another 12 × 106 having evidence of microalbuminuria. Bleeding from biopsy is a major problem in many areas of medicine but particularly in nephrology where the risk of serious bleeding from the kidney, although infrequent, may become life threatening [1–4].
Risk factors associated with bleeding such as hypertension or other comorbidities have been studied [2,3]. However, while methods of performing kidney biopsies have improved over the last two decades, renal biopsies still entail inherent bleeding risk such that approximately a third may have postbiopsy hematoma [1,2]. Even though some modifiable risk factors are mitigated, most patients at increased risk are not biopsied. Even mild coagulopathies increase the risk such that conventional (percutaneous) renal biopsy is contraindicated [1,3,4]. While these and other published data indicate that serious bleeding complications occur in only 1%–2 of cases, the data are inherently biased by excluding the riskiest patients from percutaneous renal biopsy.
Because of this bleeding risk, renal biopsy is used sparingly in the CKD population, ranging in western countries from 3.3 in 100,000 in Italy, to 21.5 in 100,000 in Australia [5]. While accurate biopsy rates in the US are lacking, using a median rate of 16.2 in 100,000 such as that reported for France [5], yields an estimate of approximately 50,000 renal biopsies annually in the US. The contraindication of biopsy is not optimal since the risk of bleeding is greater in many patient populations where renal biopsy would be most helpful, such as in autoimmune diseases and renal dysfunction manifested by elevated creatinine greater than 2 mg/ [4]. Even though most hematoma do not become life threatening, the current strategy for monitoring and managing complications can be improved. Safer renal biopsy will allow more accurate diagnosis and better management of this epidemic health problem.
Prior attempts at designing biopsy needles that deploy hemostatic agents have been made [6–9]. However, there are two shortcomings in prior designs. First, they attempt to deploy an unshielded hemostatic plug into the kidney (or other organ) tissue along the outside of the biopsy needle shaft during the biopsy procedure. These plugs will be met with resistance from the remaining organ tissue as it is introduced into the biopsy site, resulting in ineffective deployment. Second, no controlled deployment mechanism has been developed that will reliably fill the tissue void created by the biopsy needle with the hemostatic plug. Other designers have attempted to improve guidance and deployment mechanisms in standard two-stage biopsy needles [10–15], but these prior solutions do not address the problem of effective deployment of the hemostatic plug within the void as the needle is withdrawn.
While there are a variety of approaches that may be taken to improve the current situation, we have chosen to develop a biopsy needle and mechanism that injects a hemostatic plug at the time of biopsy to control bleeding. This study evaluates the performance of a prototype biopsy device referred to as the therapeutic injection system (TIS). The TIS is designed to minimize the risk of bleeding complications by delivering a shielded hemostatic plug using a specialized delivery mechanism. The clotting and sealing caused by the plug material then completes the hemostatic action.
The following two sections describe the design and validation of this device. Section 4 provides experimental results, followed by Secs. 5 and 6 presenting a discussion of the results and concluding remarks.
2. Device Design
The TIS device performs very similarly to a traditional side-cut biopsy device, which consists of two spring loaded needles, an inner needle, called the stylet and the outer needle, called the trochar. The stylet contains a notch near the end of the needle to collect the tissue sample. When the clips holding the stylet spring are released, two distinct processes take place: (1) The stylet is accelerated forward, and tissue fills the stylet notch; and (2) at the end of the travel the stylet releases the clip holding the trochar which is then also driven forward, severing and trapping the biopsy sample in the stylet notch.
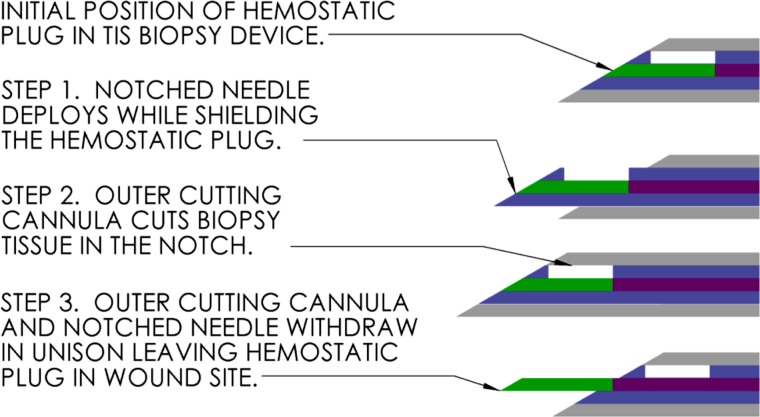
The TIS device adds a “third stage” when the trochar releases a clip at the end of its travel. This results in the automatic retraction of both stylet (containing the biopsy sample) and trochar along the same stroke length. The third stage simultaneously deploys a hemostatic plug from a channel running below the stylet notch, exiting at the stylet tip. The deployment sequence of the TIS biopsy device is illustrated in Fig. 1. Since each stage sequentially triggers the following stage, the time the needles are inside the organ being biopsied is minimized, reducing the possibility for further injury due to movements of the patient or physician.
Fig. 1.
TIS biopsy needle deployment sequence (not to scale)
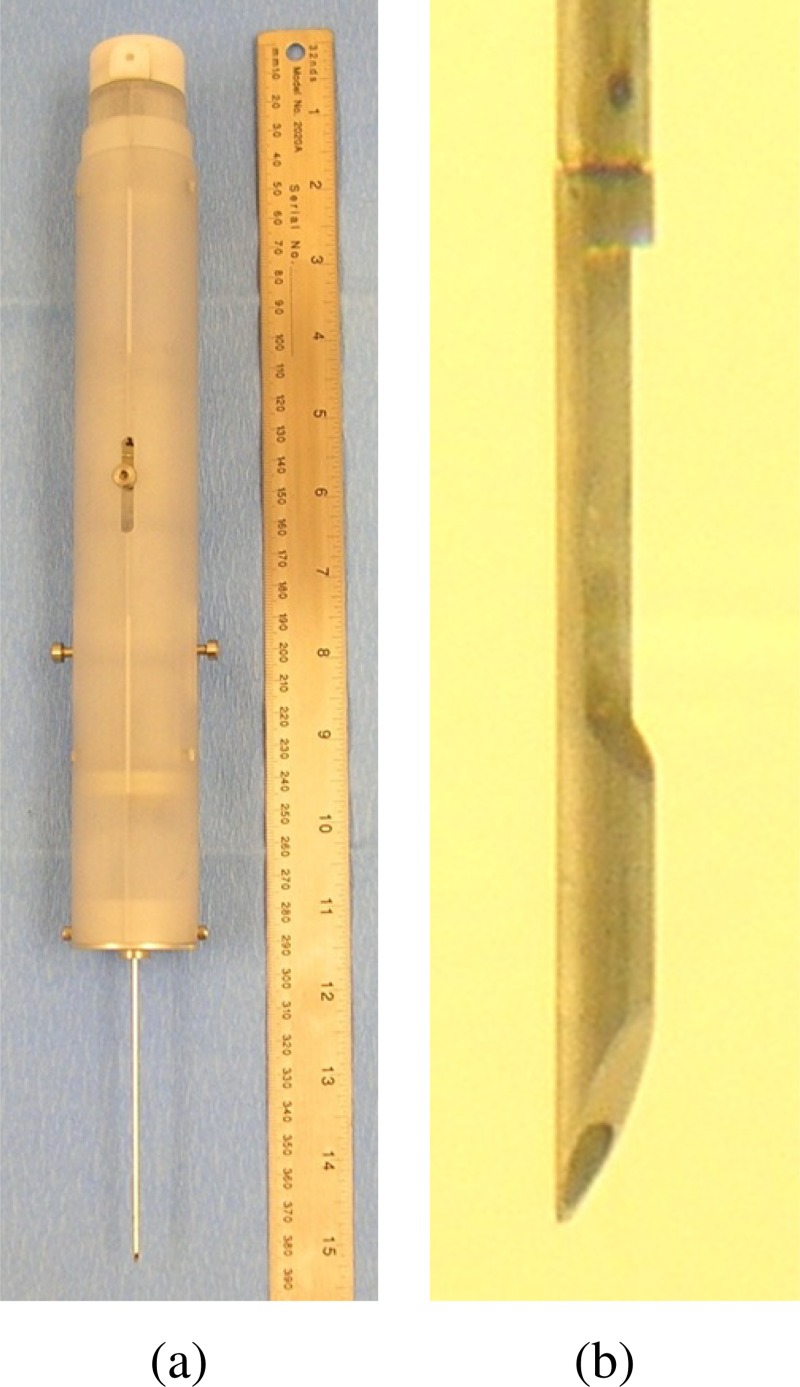
The completed prototype TIS device and specialized stylet tip are shown in Figs. 2(a) and 2(b), respectively. CAD software (Solidworks, Dassault Systèmes, Concord, MA) was used to design the parts and create dimensioned drawings. CAD simulations were conducted to verify proper stroke length and deployment sequence prior to component fabrication. A design review assessed component manufacturability, ease of assembly, and the ability of the design to meet specifications. The design characteristics of the TIS device are provided in Table 1. The prototype housing that holds the internal components was manufactured using SLA (stereo-lithography apparatus), while other components including the clip lock and release mechanisms were machined from stock material. Externally accessible levers were included to draw back the trocar to retrieve the biopsy tissue from the notch and to re-arm the device. After each biopsy sequence, new hemostatic plugs were manually loaded into the channel in the stylet. During design, the ability to economically mold these components was considered to facilitate the commercialization process.
Fig. 2.
TIS prototype showing (a) complete device (38 cm long) and (b) stylet tip with channel for hemostatic plug
Table 1.
TIS device characteristics
| Trocar diameter | 16 gauge (1.65 mm) |
| Stylet diameter | 0.053 in. (1.35 mm) |
| Stylet notch depth | 0.025 in. (0.64 mm) |
| Stylet notch length | 0.244 in. (6.20 mm) |
| Needle stroke length | 0.430 in. (10.92 mm) |
| Hemostatic channel height | 0.019 in. (0.48 mm) |
| Deployed volume of hemostatic agent | 2.8 × (0.046 ) |
| Spring force | 38 N device loaded, |
| 22 N end of travel |
3. Methods
Three key elements of the TIS biopsy device were investigated. First, a suitable formulation for the hemostatic plug was obtained, allowing it to be easily loaded into the needle, while maintaining its hemostatic properties and sufficient mechanical rigidity during the deployment process. Second, the efficacy of the device at deploying in ex vivo tissue was investigated. Finally, the overall performance of the TIS device to control bleeding in an in vivo setting was evaluated.
3.1. Hemostatic Plug Characterization.
Due to the cutting-edge geometry of the stylet tip, it can be assumed that a mostly lateral incision is made when the needle enters the tissue. Should the biopsy channel fill with blood after the needle is removed, theoretically a worst-case circular cross section with diameter of 0.053 in. would result (assuming low pressures, excluding the effect of tissue elasticity). Therefore, experiments were performed to determine the expansion characteristics of the hemostatic plug. Since a larger stylet may cause additional damage to the organ, a constraint of 0.053 in was placed on the stylet diameter. This resulted in a maximum achievable hemostatic channel height of 0.019 in., and a target hemostatic expansion requirement of at least 147 change from its preinjected to saturated form.
A commercially available hemostatic agent Gelfoam® (Pfizer, Brussels, Belgium) was selected as the hemostatic material to develop the injectable plug for the device. Gelfoam® is a water-insoluble, nonelastic, porous and pliable sterile sponge that is capable of holding 45 times its weight in blood and is intended for application to bleeding surfaces as a hemostatic agent. It is prepared from purified porcine skin, gelatin granules, and will naturally break down in the body over a period of about a week.
Initially, the hemostatic material was combined with polyvinyl alcohol (PVA) in a 12:1 ratio. Since the hemostatic is supplied either as a foam sheet or powder, the goals were to develop a composite plug with improved mechanical properties for loading into a needle. Also, the composition needed to prevent the plug breaking apart on deployment and being swept into the vascular system, increasing the chances of embolism. Both standard and composite plug materials were placed in water and the thickness was measured as a function of time.
3.2. Plug Deployment in Gelatin.
Clear gelatin was prepared and poured into vials and hardened. The vials containing the gelatin were then fixed to the bench top. The TIS biopsy device was mounted to the bench top with a bracket that positions the tip of the TIS biopsy device past the free surface of the clear gelatin. A centimeter scale with 2 mm resolution was positioned adjacent to the stroke axis of the TIS biopsy device. The deployment sequence was observed and compared to specifications.
3.3. Ex Vivo Testing in Bovine Kidney.
The performance of the TIS device was evaluated in the laboratory by comparing tissue sample collection to the Bard Monopty® device (Bard Medical, Covington, GA), which acted as the control. Both the TIS and the control had a stroke length of 11 mm. Bovine kidneys were purchased from a local abattoir, refrigerated, and used within 12 h to perform the experiments. The needles were manually inserted 1 cm into the kidney prior to taking the biopsy. Ten biopsies using each device (TIS and control) for a total of 20 biopsies were performed. After biopsy the tissue samples were fixed in buffered formalin and stained with hematoxylin and eosin. The area of the sectioned tissue was calculated from digital images using ImageScope® software (Aperio, Vista, CA).
3.4. In Vivo Testing in Porcine Kidney.
A porcine model ( = 2, 38, and 48 kg) was selected to provide live kidneys of reasonable size for biopsy to assess performance of the TIS device. All experimental procedures were approved by the IACUC of the University of Michigan consistent with the Association for the Assessment and Accreditation of Laboratory Animal Care (AAALAC) guidelines. After administration of general anesthesia Telazol (5–6 mg/kg) and Xylazine (2–3 mg/kg), the animals were intubated and maintained under general anesthesia (Forane 1%–2). An arterial line was placed to measure blood pressure. A large bore IV was inserted in a peripheral vein for administration of maintenance fluids. A blood sample was taken to measure platelet count and activated clotting time (ACT) for each animal. ACT was measured using a Hemochron 401 Series ACT measurement machine. Heparin (150 units/kg) was administered resulting in ACT of 212 s 10. Platelet count was 182,000 and 287,000 per for the first and second animal, respectively. Mean arterial pressure was maintained at 70 to 74 mmHg.
Both animals underwent midline laparotomy. The small bowel was retracted and covered with a saline soaked drape. The peritoneum was cut to expose the kidney which was then elevated with a sponge. Sponges were used to remove abdominal fluid prior to biopsy.
The first animal had 12 biopsies taken, six on the right and six on the left kidney. The right kidney had three biopsies taken with the control device in the upper pole and three taken with the TIS device using the PVA to hemostatic ratio of 2:1 in the lower pole. Two investigators, each using a different biopsy device, performed biopsies simultaneously. The opposing kidney was biopsied in a similar manner with each device biopsying the pole opposite the previous kidney. The second animal had a similar series of biopsies using the PVA to hemostatic ratio of 12:1 ( = 6) and one plug composed of 100 hemostatic material ( = 1).
Sponges were used to absorb blood from each biopsy site to measure blood loss. To prevent the sponges from influencing the results, the sponges were not directly applied to the biopsy site with manual pressure. Rather, the sponges were used to gently absorb blood as it flowed down the organ to a lower elevation. Post biopsy minus dry sponge mass was measured to quantify blood loss from the animal for each biopsy and a conversion factor of 1.06 g/ml was used to obtain blood volume loss. At the end of the study, the animals were euthanized. At necropsy, the kidneys were examined grossly, excised, and processed for histology around the wound site.
4. Results
This section will present the results obtained from the laboratory, ex vivo and in vivo experiments discussed in the preceding section.
4.1. Plug Expansion Characteristics.
Pure hemostatic and composite plug thickness versus time in water are tabulated in Tables 2 and 3. Percent change in thickness was calculated for both materials. Maximum percent change in thickness was 67 for 12:1 PVA/hemostatic, taking 300 s to expand 25. The pure hemostatic exhibited a quicker and far greater expansion only taking 30 s to expand to 33 and 100 s to expand to 150.
Table 2.
12:1 PVA/hemostatic composite plug thickness versus time in water
| Time, s | Thickness, in mm | Percent change |
|---|---|---|
| 0 | 0.012 (0.305) | 0 |
| 60 | 0.013 (0.330) | 8 |
| 120 | 0.014 (0.356) | 17 |
| 180 | 0.014 (0.356) | 17 |
| 240 | 0.015 (0.381) | 25 |
| 300 | 0.015 (0.381) | 25 |
| 3120 | 0.020 (0.508) | 67 |
Table 3.
Hemostatic foam sheet thickness versus time in water
| Time, s | Thickness, in mm | Percent change |
|---|---|---|
| 0 | 0.12 (3.048) | 0 |
| 30 | 0.16 (4.064) | 33 |
| 48 | 0.20 (5.080) | 67 |
| 100 | 0.30 (7.620) | 150 |
Even though the composite hemostatic plug did not reach the theoretically determined maximum, the effect of the inherent elasticity and pressure from surrounding tissue minimizing the biopsy void volume must also be considered. It was expected that these external influences would most likely prevent the achievement of the maximum biopsy void diameter during in vivo experimentation.
4.2. Plug Deployment in Gelatin.
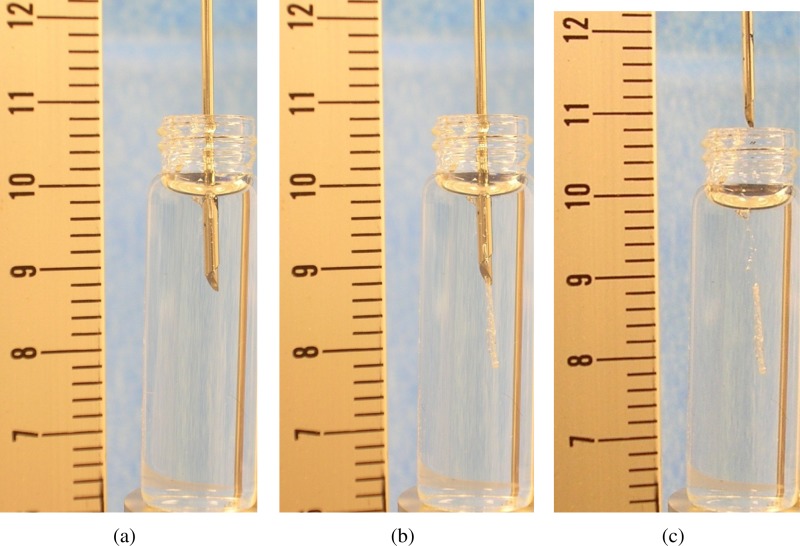
Stroke sequence and hemostatic plug deployment were verified by repeated firing ( = 3) of the TIS biopsy needle into clear gelatin. Figure 3 shows the deployment sequence. Figure 3(a) shows the needle initially inserted into the gelatin. Figure 3(b) shows the needle after the trigger had been activated, the biopsy taken, and the hemostatic plug deployed. Figure 3(c) shows the needle removed and the hemostatic plug remaining in the gelatin.
Fig. 3.
TIS deployment sequence with scale (cm), showing (a) prefiring, (b) hemostatic plug exiting needle, and (c) hemostatic plug deployed
4.3. Ex Vivo Testing in Porcine Kidney.
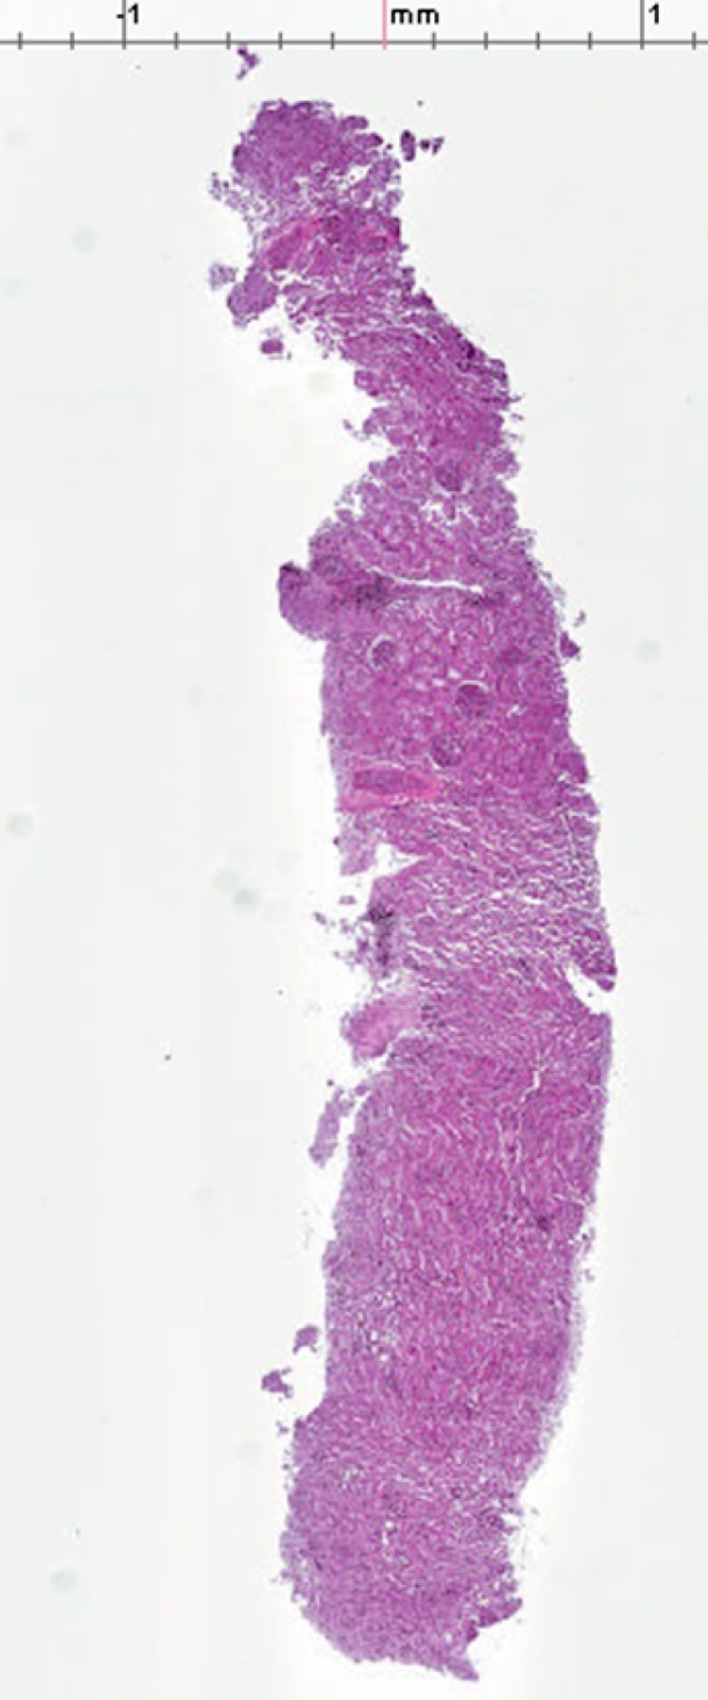
An example of the histological evaluation performed is shown in Fig. 4. These successful completion of the 10 biopsies demonstrated the capability of the TIS device for obtaining adequate tissue samples. Although there was a 24 reduction in mean tissue sample area (3.386 versus 2.573 ), the specimens collected with the TIS and control device showed comparable specimen quality. The promising expansion performance of the pure hemostatic suggests that the channel holding the hemostatic agent may be reduced, allowing an increase in notch depth to make the biopsy sample volume for the TIS the same as the control.
Fig. 4.
Stained and sectioned biopsy taken with TIS device
4.4. In Vivo Testing in Porcine Kidney.
For animal 1, time to hemostasis was visually assessed. However, accurate measurements proved difficult due to the persistence of very slow bleeding rates continuing even after practical hemostasis was achieved. Therefore, for animal 2, the assessment of blood loss was measured as a function of time, where time to hemostasis was defined as the first data point at which the bleeding rate fell below 0.5 mL/min. Results for both porcine specimens are provided in Table 4. Because the two populations (control and TIS) had different standard deviations, the Smith–Satterthwaite procedure was employed instead of a standard T-test.
Table 4.
Time to hemostasis and blood loss for control and experimental devices
| Device | Hemostatic plug material | Animal | n | Blood loss, ml |
|---|---|---|---|---|
| Control | None | 1 | 6 | 4.3 3.2 |
| TIS | 2:1 PVA/hemostatic | 1 | 6 | 2.3 1.1 |
| Control | None | 2 | 6 | 8.1 3.9 |
| TIS | 12:1 PVA/hemostatic | 2 | 6 | 1.9 1.6 |
| Control | None | 2 | 1 | 9.2 |
| TIS | 2:1 Pure hemostatic | 2 | 1 | 0.0 |
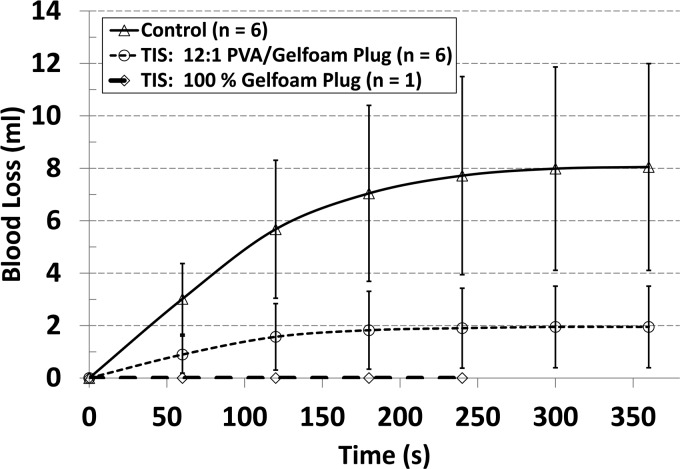
Statistically significant reductions in both blood loss and time to hemostasis were found when using the 12:1 PVA/hemostatic plug (blood loss: 8.1 3.9 ml, control versus 1.9 1.6 ml, TIS, = 0.01, = 6; time to hemostasis: 290 45 s, control versus 130 103 s, TIS, = 0.01, = 6). The experimental results for the 12:1 PVA/hemostatic versus control bleeding volumes are illustrated in Fig. 5, where the difference between bleeding volumes and time to hemostasis can be clearly seen for the various experiments. Also, a reduction in blood loss standard deviation by a factor of 2.4 (3.9/1.6) between the control and TIS device with 12:1 plug was observed. Due to the complexity of loading the pure hemostatic foam into the needle, only one pure hemostatic plug was deployed during the experiment. Notably, the pure hemostatic plug resulted in the substantial and immediate reduction in blood loss from 9.2 to 0.0 ml. This clearly showed that the pure hemostatic plug with its rapid expansion in the presence of blood has the potential to outperform the composite plug and control device.
Fig. 5.
Blood loss (ml) versus time (s). Error bars represent 1 standard deviation.
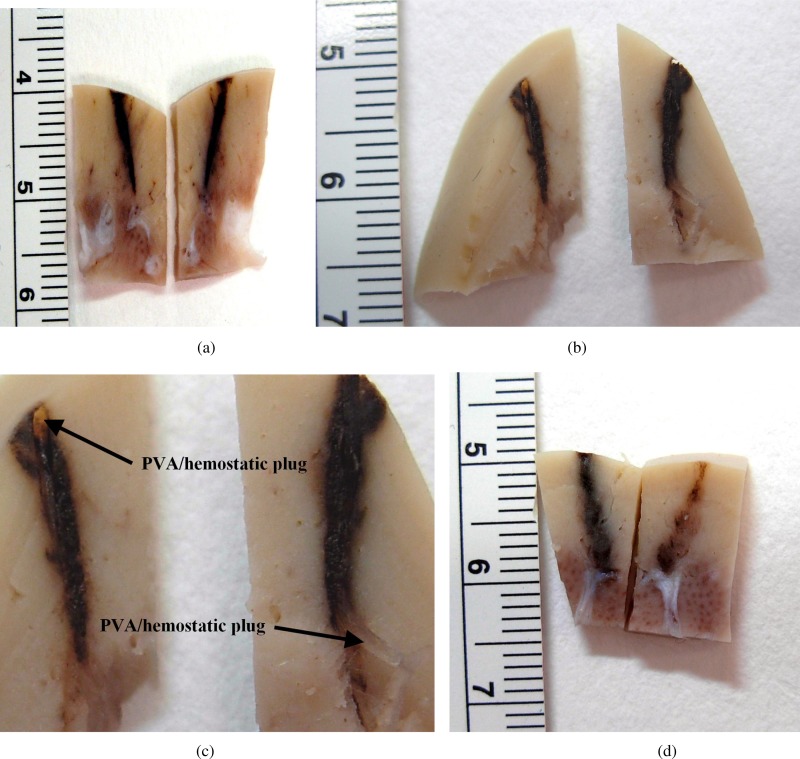
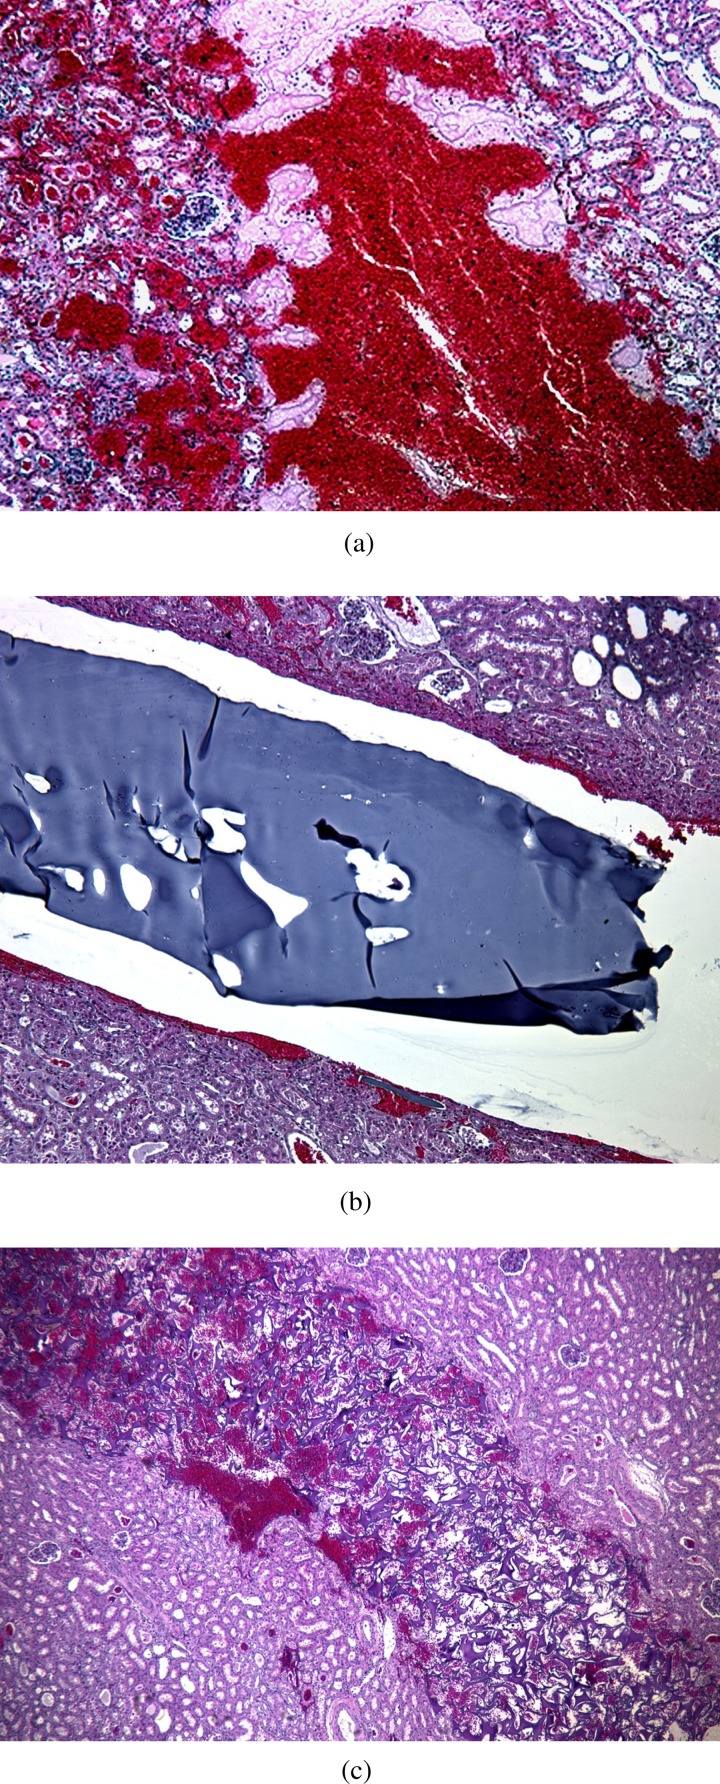
Figure 6 shows gross tissue specimens sectioned along the plane of the biopsy needle track from kidneys biopsied from animal 2. Figure 6(a) shows the track of the control device with no plug. Figure 6(b) shows the track from the TIS device with the translucent 12:1 PVA/hemostatic plug deployed within the track. Figure 6(c) provides a magnified view of Fig. 6(b) showing the correct placement of the composite plug in the tissue, verifying the in vitro gelatin results in vivo. The plug was bent during sectioning (lower arrow) pulling the plug slightly away from the entry point (upper arrow). Although the pure hemostatic plug in Fig. 6(d) is not visible, the same specimen when stained and sectioned, in Fig. 7(c), shows that it was correctly placed placement and has expanded by absorbing blood followed by coagulation within the biopsy track.
Fig. 6.
Renal cortical tissue sections from in vivo porcine experiment for animal 2 (scale is in cm with 1 mm resolution)
Fig. 7.
Histology of biopsy sections with hematoxylin and eosin staining
Gross specimens from Fig. 6 were stained with hematoxylin and eosin and sectioned. Figure 7(a) shows blood and acute thrombus formation in the biopsy track of the control device. Figure 7(b) shows the 12:1 PVA/hemostatic plug within the track. The white space is the pulling away of the plug from the tissue resulting from histological processing and embedding. Figure 7(c) shows the pure hemostatic plug deployed in the kidney tissue and expanded within the track mixed with blood and thrombus.
5. Discussion
In order to respond to the bleeding risk, physicians appropriately limit percutaneous renal biopsy to cases where the diagnostic information exceeds the potentially life-threatening risk to the patient. Current nephrology practice consists of close clinical observation postbiopsy, with escalating imaging and surveillance for intervention, especially when transfusions become necessary when a patient's hematocrit is falling. In this setting, the next step is to proceed with invasive treatments to address the excessive bleeding by performing renal arteriography and segmental embolization or surgery [16]. In settings where conventional biopsy is considered too risky, high risk patients needing kidney biopsy are referred to interventional radiologists and surgeons to perform more complicated invasive procedures such as open, laparoscopic, or transjugular renal biopsy [17–20]. Surgical procedures have greater morbidity and cost; still entail bleeding risk, and the transjugular procedure remains much more involved than conventional biopsy and merely serves to keep the bleeding that does occur within the vascular space (bleeding is directed into the venous system). Advances in laparoscopic procedures have allowed a less morbid surgical approach to be used [20], but this remains more involved and costly than the percutaneous approach, and is reserved for cases where the standard percutaneous approach is contra-indicated. While surgical advances and laparoscopic procedures are needed, and will continue to be needed for complicated and high risk patients, a safer percutaneous biopsy device and procedure will definitely allow a greater number of biopsies to be performed, offering a diagnostic advantage to physicians.
One potential solution that has been envisioned involved the use of standard medical imaging guidance with a coaxial guide for biopsy needle placement in order to inject an hemostatic agent after the biopsy has been performed and the biopsy needle is removed. In this way one might anticipate bleeding control at the surface of the kidney. Unfortunately a large clinical study recently published with over a thousand patients showed no difference between this coaxial approach with hemostatic injection and the standard approach with or without coaxial guides in reducing complications [21]. Since open procedures can control bleeding using hemostatic agents, these results suggest that imaging with a coaxial guide is not sufficient to deliver the hemostatic agent to the site of bleeding and maintain the agent at the site of bleeding to achieve hemostasis.
The TIS prototype addresses the bleeding problem by directly deploying a hemostatic agent into the void created by the biopsy needle as part of the procedure itself. This solution maintains the simplicity and directness of the percutaneous approach, gaining access to the outer cortex of the kidney with a needle of conventional thickness, through the patient's back under ultrasound guidance, and avoiding significant changes to the standard percutaneous biopsy procedure.
6. Conclusion
While substantial development and experimentation remain, these initial results show significant promise in this approach to control postbiopsy bleeding, thereby addressing the unmet need for safer kidney biopsies. Future iterations of this device may also serve to reduce the cost of care by allowing more accurate diagnosis of renal diseases. These results lay the groundwork for further study applicable to other clinical situations where increased safety and control of bleeding are desired.
Acknowledgment
This research was supported in part by NIH Grant R43DK084599.
Contributor Information
Philip Wong, MC3, Inc., 3526 West Liberty, Suite 100, Ann Arbor, MI 48103, e-mail: pwong@MC3corp.com.
Kent J. Johnson, e-mail: kjjkjj@umich.edu
Roscoe L. Warner, e-mail: roscoew@umich.edu, Department of Pathology, University of Michigan, 1301 Catherine, 7520 MSRBI, Ann Arbor, MI 48109
Scott I. Merz, MC3, Inc., 3526 West Liberty, Suite 100, Ann Arbor, MI 48103, e-mail: smerz@MC3corp.com
Grant H. Kruger, Department of Mechanical Engineering, University of Michigan, 2350 Hayward, 1031 H.H. Dow; Department of Anesthesiology, 1500 E. Medical Center Dr., 1H247 UH, Ann Arbor, MI 48109, e-mail: ghkruger@umich.edu
William F. Weitzel, Nephrology Division, University of Michigan, 102 Observatory, 312 Simpson, Ann Arbor, MI 48109; VA Medical Center, 2215 Fuller Road, Ann Arbor, MI 48105, e-mail: weitzel@umich.edu.
References
- [1]. Manno, C. , Strippoli, G. F. , Arnesano, L. Bonifati, C. , Campobasso, N. , Gesualdo, L. , and Schena, F. P. , 2004, “Predictors of Bleeding Complications in Percutaneous Ultrasound-Guided Renal Biopsy,” Kidney Int., 66(4), pp. 1570–157710.1111/j.1523-1755.2004.00922.x [DOI] [PubMed] [Google Scholar]
- [2]. Eiro, M. , Katoh, T. , and Watanabe, T. , 2005, “Risk Factors for Bleeding Complications in Percutaneous Renal Biopsy,” Clin. Exp. Nephrol., 9(1), pp. 40–4510.1007/s10157-004-0326-7 [DOI] [PubMed] [Google Scholar]
- [3]. Shidham, G. B. , Siddiqi, N. , Beres, J. A. , Logan, B. , Nagaraja, H. N. , Shidham, S. G. , and Piering, W. F. , 2005, “Clinical Risk Factors Associated With Bleeding After Native Kidney Biopsy,” Nephrology (Carlton), 10(3), pp. 305–31010.1111/j.1440-1797.2005.00394.x [DOI] [PubMed] [Google Scholar]
- [4]. Stratta, P. , Canavese, C. , Marengo, M. , Mesiano, P. , Besso, L. , Quaglia, M. , Bergamo, D. , Monga, G. , Mazzucco, G. , and Ciccone, G. , 2007, “Risk Management of Renal Biopsy: 1387 Cases Over 30 Years in a Single Centre,” Eur. J. Clin. Invest., 37(12), pp. 954–96310.1111/j.1365-2362.2007.01885.x [DOI] [PubMed] [Google Scholar]
- [5]. Orlando, C. , Raggi, C. C. , Bagnoni, L. , Sestini, R. , Briganti, V. , La Cava, G. , Bernini, G. , Tonini, G. P. , Pazzagli, M. , Serio, M. , and Maggi, M. , 2001, “Somatostatin Receptor Type 2 Gene Expression in Neuroblastoma, Measured by Competitive Rt-Pcr, is Related to Patient Survival and to Somatostatin Receptor Imaging by Indium-111-Pentetreotide,” Med. Pediatr. Oncol., 36(1), pp. 224–22610.1002/1096-911X(20010101)36:1<224::AID-MPO1054>3.0.CO;2-# [DOI] [PubMed] [Google Scholar]
- [6]. Haaga, J. , 1989, “Hemostatic Sheath for a Biopsy Needle and Method of Use,” U.S. Patent No. 4,838,280. [Google Scholar]
- [7]. Haaga, J. , 1992, “Medical Biopsy Needle,” U.S. Patent No. 5,080,655. [Google Scholar]
- [8]. Haaga, J. , 1996, “Biopsy System With Hemostatic Insert,” U.S. Patent No. 5,487,392. [Google Scholar]
- [9]. Krause, W. R. , 2004, “Biopsy and Delivery Device,” U.S. Patent No. 7,169,114. [Google Scholar]
- [10]. Quinn, B. , 1999, “Biopsy Needle Hub Assembly,” U.S. Patent No. 5,876,354. [Google Scholar]
- [11]. Pruitt, T. , Field, D. , and Jacobs, C. , 1999, “Automated Tissue Sampling Device,” U.S. Patent No. 5,993,399. [Google Scholar]
- [12]. Zanelli, C. , 2003, “Ultrasonic Based Detection of Interventional Medical Device Contact and Alignment,” U.S. Patent No. 6,546,276. [Google Scholar]
- [13]. Matyas, J. , and Rattner, J. , 1999, “Method of Tissue Transfer and Retrieval,” U.S. Patent No. 5,858,781. [Google Scholar]
- [14]. Gambale, R. , 2007, “Tissue Capturing and Suturing Device and Method,” U.S. Patent No. 7,220,266. [Google Scholar]
- [15]. Gambale, R. , Shah, C. , Weiser, M. , Forcucci, S. , and Forde, S. , 2007, “Agent Delivery Systems,” U.S. Patent No. 7,232,421. [Google Scholar]
- [16]. Breyer, B. N. , McAninch, J. W. , Elliott, S. P. , and Master, V. A. , 2008, “Minimally Invasive Endovascular Techniques to Treat Acute Renal Hemorrhage,” J. Urol., 179(6), pp. 2248–2252, Discussion 2253.10.1016/j.juro.2008.01.104 [DOI] [PubMed] [Google Scholar]
- [17]. Cluzel, P. , Martinez, F. , Bellin, M. F. , Michalik, Y. , Beaufils, H. , Jouanneau, C. , Lucidarme, O. , Deray, G. , and Grenier, P. A. , 2000, “Transjugular Versus Percutaneous Renal Biopsy for the Diagnosis of Parenchymal Disease: Comparison of Sampling Effectiveness and Complications,” Radiology, 215(3), pp. 689–693 [DOI] [PubMed] [Google Scholar]
- [18]. Smith, T. P. , Presson, T. L. , Heneghan, M. A. , and Ryan, J. M. , 2003, “Transjugular Biopsy of the Liver in Pediatric and Adult Patients Using an 18-Gauge Automated Core Biopsy Needle: A Retrospective Review of 410 Consecutive Procedures,” AJR Am. J. Roentgenol., 180(1), pp. 167–172 [DOI] [PubMed] [Google Scholar]
- [19]. Abbott, K. C. , Musio, F. M. , Chung, E. M. , Lomis, N. N. , Lane, J. D. , and Yuan, C. M. , 2002, “Transjugular Renal Biopsy in High-Risk Patients: An American Case Series,” BMC Nephrol., 3, p. 5.10.1186/1471-2369-3-5 [DOI] [PMC free article] [PubMed] [Google Scholar]
- [20]. Shetye, K. R. , Kavoussi, L. R. , Ramakumar, S. , Fugita, O. E. , and Jarrett, T. W. , 2003, “Laparoscopic Renal Biopsy: A 9-Year Experience,” BJU Int., 91(9), pp. 817–82010.1046/j.1464-410X.2003.04243.x [DOI] [PubMed] [Google Scholar]
- [21]. Hatfield, M. K. , Beres, R. A. , Sane, S. S. , and Zaleski, G. X. , 2008, “Percutaneous Imaging-Guided Solid Organ Core Needle Biopsy: Coaxial Versus Noncoaxial Method,” AJR Am. J. Roentgenol., 190(2), pp. 413–41710.2214/AJR.07.2676 [DOI] [PubMed] [Google Scholar]


