

Abstract
Purpose
To describe a method of en face visualization and quantification of the photoreceptor inner segment/outer segment junction area, using spectral-domain optical coherence tomography, and association with visual acuity.
Methods
Case series of 74 eyes in 53 patients. Central 1-mm and 400-mm en face areas were analyzed with a computer algorithm.
Results
The presence or absence of inner segment/outer segment junction was visible on both spectral-domain optical coherence tomography en face and retinal cross sections. Thirty eyes (40.6%) had no retinal pathology and an average logMAR visual acuity of 0.116. Twenty-five eyes (33.8%) had intraretinal edema, with visual acuity of 0.494. Nineteen eyes had nonneovascular age-related macular degeneration (dry age-related macular degeneration, 25.6%), with visual acuity of 0.392. In all eyes, central 1-mm and 400-µm en face areas were 58.3 ± 25.0% and 56.4 ± 26.0%, which showed significant correlation with visual acuity (Pearson correlation, r = −0.66 and −0.56, both P < 0.001). This correlation was greater than correlation of visual acuity with central subfield thickness (r = 0.39, P < 0.001), macular volume (r = 0.36, P = 0.002), and average macular thickness (r = 0.37, P = 0.001). However, no variables were significantly correlated with dry age-related macular degeneration eyes.
Conclusion
Central en face inner segment/outer segment junction areas are significantly correlated with visual acuity in most eyes. This may correlate better with visual acuity than other spectral-domain optical coherence tomography values, as a reflection of photoreceptor integrity. Dry age-related macular degeneration may disrupt the plane used to formulate the en face display. Advancements in spectral-domain optical coherence tomography may provide routine en face visualization analysis.
Keywords: en face optical coherence tomography, macular edema, optical coherence tomography, visual acuity, spectral-domain optical coherence tomography
Optical coherence tomography (OCT) was introduced in 1991 as a noninvasive, diagnostic ophthalmic imaging technique1 and made the routine clinical measurement of retinal thickness possible. Since 2004, higher resolution spectral-domain (SD) OCT has entered clinical practice with reported resolutions of 1 µm to 5 µm and improved visualization of retinal morphology and pathology.2,3 One aspect of SD OCT that is greatly improved compared with its predecessor, time-domain OCT, is the ability to clearly differentiate outer retinal layers. This has led to novel findings, not observable on clinical examination, including the description of several distinct hyperreflective layers in the outer retina corresponding to Verhoeff outer limiting membrane, the photoreceptor inner segment/outer segment (IS/OS) junction, and the inner and outer borders of the retinal pigment epithelium (RPE).4–7 Furthermore, data from several recent OCT studies have indicated that the integrity of the IS/OS is important for visual function and may be a predictor of visual acuity in eyes with many different retinal pathologies including diabetic macular edema (DME), epiretinal membrane, macular holes, and central or branch retinal vein occlusion (RVO).8–15
In this manner, SD OCT technology has provided improved correlation of outer retinal structural imaging and visual function. In a recent study, images acquired with Cirrus SD OCT (Carl Zeiss Meditec, Dublin, CA) were used to correlate quantifiable SD OCT findings, including macular thickness and outer photoreceptor length, to visual acuity in eyes with diabetic DME. The authors reported that there was a significantly greater correlation coefficient for outer photoreceptor length (range of Pearson correlation, r = −0.61 to −0.81) than with macular thickness (r = 0.13–0.22) in the entire 6 × 6-mm macular grid, central 1-mm subfield, and central 330-µm foveal point.16
Another intriguing derivation of SD OCT technology is en face visualization (also called a transverse-, coronal-, or C-scan) of specific layers of the retina, including the IS/OS. This allows the clinician or patient to view the whole area, or specific retinal layer length and width, from “a bird’s eye view” rather than the length and depth observed with traditional OCT cross sections. Although this modality is not yet available on all the commercially produced SD OCT systems, one group determined that en face OCT may help provide prognostic indicators for visual acuity based on pre- and postoperative analysis of macular hole area measurement using a specific software program. 7 Another report, written by a coauthor of this study (D.F.K.), described novel en face outer retinal findings in a patient with acute zonal occult outer retinopathy using the advanced visualization three-dimensional (3D) analysis function of Cirrus SD OCT. In this case, IS/OS obliteration, observed with en face SD OCT scan of the outer retinal layers, precisely correlated with clinical observations, fundus autofluorescence, Goldmann visual field, and the IS/OS junction observable on SD OCT cross-sectional scans. Interestingly, the central 5° to 10° of macula was spared and the patient’s visual acuity remained 20/20.
Based on this background and our clinical experience with en face OCT imaging, we developed the hypothesis that there may be a significant correlation between en face OCT visualization of the outer retina, which includes the IS/OS, and visual acuity in both healthy patients and those with retinal pathology. Therefore, in this study, we sought to further describe en face visualization of the outer retina using Cirrus SD OCT and determine whether there was any correlation between the central 1-mm and 400-µm outer retinal areas and visual acuity. In addition, we explored how these results compared with routine measurements provided by Cirrus SD OCT software including central subfield thickness (CST), macular volume (MV), and average macular thickness (AMT).
Methods
This study was approved by the Institutional Review Board of The University of Chicago Hospitals Medical Center. Health Insurance Portability and Accountability Act compliance was maintained. This was a case– control study of patients who received clinical examinations and Cirrus SD OCT macular cube scans (128 B-scans, each consisting of 512 A-scans over a 6 × 6-mm area with a maximal scan velocity of 27,000 axial scans per second) at a satellite university clinic over a 5-month period. All scans were performed by the same experienced, OCT-certified ophthalmic technician. To minimize software-induced miscorrelation, only high-quality scans, defined as those that were centered on the fovea, with a signal strength ≥6 and which displayed correctly aligned automatic software segmentation of the internal limiting membrane and inner RPE boundary were included. Only patients who had vision measurable on a Snellen chart with a range of 20/20–20/400 were included. Healthy eyes were defined as eyes without a history of eye disease, or clinical and SD OCT findings of retinal pathology. Exclusion criteria included OCT scan acquisition defects on any part of the macular cube, recent intraocular surgery (within 4 weeks), a diagnosis of glaucoma, any media opacity precluding complete macular cube scan or a history of trauma, or any vitreoretinal surgery in the study eye. These criteria were chosen to minimize those eyes that may have had decreased visual acuity because of optic neuropathy or media opacity, rather than outer retinal pathology.
Cirrus SD OCT en face scans were analyzed using advanced visualization 3D analysis, RPE slice mode. The Cirrus software automatically generated the en face images based on the density of the IS/OS junction signal for each individual scan. The authors did not manually alter the algorithm. All images were rotated in order that the RPE slice was viewed as an en face image, which was aligned equally in the horizontal and vertical planes without adjusting the zoom characteristic. Images were saved and exported as Joint Photographic Experts Group (JPEG) files and then converted into Tagged Image File Format (TIFF) data. These were then analyzed using Metamorph image processing software Version 7.6 (Molecular Devices, Sunnyvale, CA). The TIFF images were imported and converted into 16-bit grayscale images, and then inclusive thresholds were applied to each image. Determination of image thresholds was based on the reflective signal intensities of the OCT scan, which was automatically applied to the en face images by Cirrus software. A specific software threshold algorithm was developed, to differentiate hyperreflective from hyporeflective OCT signals in an attempt to include intact IS/OS and exclude other areas, and applied to all images. The threshold value, based on the contrasts between the peaks of the “hottest” signal color (orange-yellow) compared with the “coolest” color (blue-green), was established by applying the Metamorph software’s threshold calculation of each individual scan of healthy controls and then applying this summed average threshold to all other images. Circular regions of 1 mm and 400 µm were centered on the fovea, and the percentage inclusive threshold was determined for both regions in each image using Metamorph region analysis. Optical coherence tomography measurements including CST, MV, and AMT, which had been automatically determined by the Cirrus OCT software, were recorded.
For statistical analysis, best-corrected Snellen visual acuity was converted to a logarithm of the minimum angle of resolution (logMAR) score. The logMAR visual acuity was compared with both en face outer retinal OCT area analyses and with CST, MV, and AMT measurements using Pearson correlation analysis. The 2 en face areas were compared using a paired Student t-test. Any differences with a P value <0.05 were considered statistically significant. All statistical analysis was performed using IBM SPSS Statistics software (SPSS, Inc, Chicago, IL).
Results
Eighty eyes of 58 patients were analyzed. Six scans were excluded, because of scanning errors within the 6 × 6-mm scan area because of patient movement or blinking. A total of 74 eyes of 53 patients were included in this study. The average patient age was 63.6 years (±17.6 years), and 29 patients were women (54.7%). The mean visual acuity for all eyes was 0.315 (Snellen equivalent, ~20/40, range 20/20–20/400). Thirty eyes (40.5%, 5 of which were healthy fellow eyes of patients affected in the other eye) had no previous or established retinal pathology on clinical examination, 25 eyes (33.7%) had intraretinal edema on clinical examination because of retinal vein occlusion (n = 6, 8.1%), DME (n = 6, 8.1%), idiopathic epiretinal membrane (n = 4, 5.4%), pseudophakic cystoid macular edema (n = 4, 5.4%), neovascular age-related macular degeneration (wet AMD, n = 3, 4%), or vitreomacular traction (n = 2, 2.7%). Nineteen eyes had intermediate or advanced nonneovascular (dry) AMD (25.6%) on clinical examination, with medium and/or large drusen, pigmentary changes, and/or geographic atrophy of the RPE noted on clinical examination. Results of visual acuity, CST, MV, and average macular thickness by diagnosis are listed in Table 1.
Table 1.
Results of Visual Acuity, Central Subfield Thickness, Macular Volume, and Average Macular Thickness by Diagnosis
| Diagnosis | n | VA | SD | CST (µm) | SD (µm) | MV (mm3) | SD (mm3) | AMT (µm) | SD (µm) |
|---|---|---|---|---|---|---|---|---|---|
| All eyes | 74 | 0.315 | 0.29 | 298.0 | 25.0 | 10.1 | 26.0 | 283.7 | 45.9 |
| Healthy eyes | 30 | 0.116 | 0.09 | 263.1 | 12.1 | 9.9 | 14.2 | 276.2 | 18.0 |
| Dry AMD | 19 | 0.392 | 0.27 | 249.5 | 21.9 | 9.1 | 25.0 | 260.4 | 30.7 |
| All eyes excluding dry AMD | 55 | 0.288 | 0.29 | 314.8 | 25.5 | 10.5 | 26.3 | 291.8 | 47.7 |
| Macular edema | 25 | 0.494 | 0.32 | 376.8 | 22.6 | 11.1 | 26.7 | 310.5 | 63.8 |
| VO with CME | 6 | 0.705 | 0.45 | 463.6 | 210.6 | 11.8 | 2.69 | 329 | 74.1 |
| DME | 6 | 0.541 | 0.38 | 290.1 | 88.4 | 11.4 | 3.39 | 318 | 94.3 |
| ERM with CME | 4 | 0.345 | 0.18 | 419.5 | 13.5 | 12.1 | 0.91 | 336 | 25.1 |
| Pseudophakic CME | 4 | 0.420 | 0.15 | 409.2 | 1.8 | 10.7 | 1.83 | 298 | 50.5 |
| Neovascular AMD | 3 | 0.137 | 0.11 | 285.3 | 70.7 | 9.4 | 0.15 | 262 | 4.3 |
| VMT with CME | 2 | 0.515 | 0.06 | 363.5 | 183.1 | 10.0 | 1.27 | 278 | 35.3 |
n, number; VA, visual acuity (logarithm of the minimum angle of resolution); SD, standard deviation; VO, retinal vein occlusion; CME, cystoid macular edema; ERM, idiopathic epiretinal membrane; VMT, vitreomacular traction.
Figure 1 demonstrates SD OCT en face images and corresponding central macular cube horizontal cross sections highlighting the 1-mm and 400-µm zones, which were analyzed in 4 different patients. When present, the hyperreflective orange signal demonstrated with en face scans corresponded with the hyperreflective orange IS/OS junction visible on cross-sectional scans. In patients with retinal pathology, the less reflective, green-blue colors in en face scans corresponded with irregular or absent IS/OS on cross-sectional images.
Fig. 1.
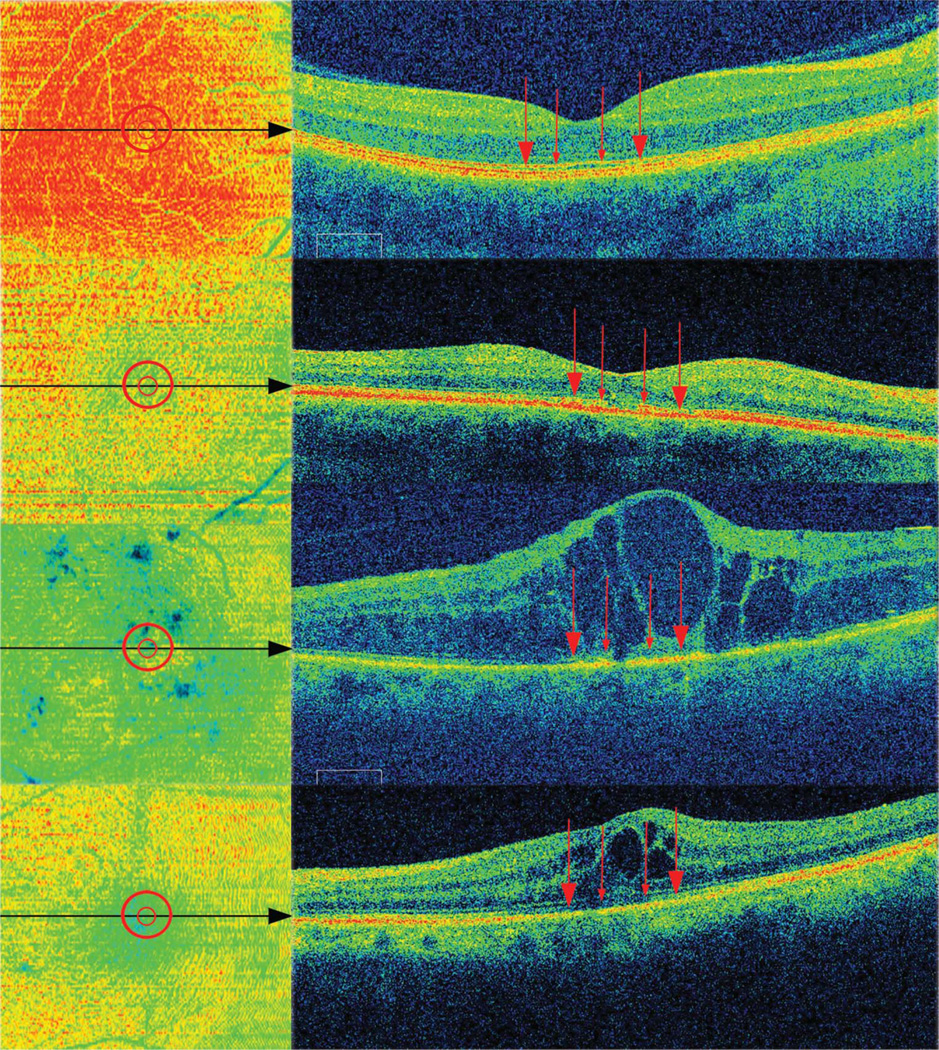
En face OCT images of different patients with corresponding (black arrows) cross-sectional OCT scans. Red circles indicate analyzed areas corresponding to red arrows, which point to the inner/outer photoreceptor junction location. Top to bottom (visual acuity): healthy (20/20), dry AMD (20/50), DME (20/400), and pseudophakic macular edema (20/40).
Figure 2 demonstrates examples of the Cirrus SD OCT en face images, images converted into 16-bit grayscale, and images with thresholds and area regions applied, which were then analyzed with Metamorph software. Inclusion and exclusion thresholds in the analyzed areas and in the entire macular cube scan corresponded with hyperreflective and hyporeflective areas, respectively, on the original en face images. The results of outer retinal en face OCT analyses of the central 1-mm and 400-µm area are listed in Table 2. Similar to standard OCT macular thicknesses and volume, en face OCT area measurements varied by diagnosis. Although there was no statistically significant difference between central 1-mm and 400-µm en area measurements for all eyes as a group (P = 0.12), healthy eyes showed a higher percentage of outer retinal area in the central 1-mm compared with 400-µm area (78.1 ± 12.1% and 73.3 ± 14.2%, respectively, P = 0.013).
Fig. 2.

En face OCT images of the same 4 eyes as in Figure 1, demonstrating (from left to right) examples of original Cirrus SD OCT images, images converted into 16-bit grayscale, and images with thresholds and analysis regions (red circles) applied that were then analyzed with a specific Metamorph computer software algorithm for all images.
Table 2.
Results of En Face OCT 1-mm and 400-mm Area Analysis by Diagnosis
| Diagnosis | n | 1-mm Area (Intact IS/OS%) | SD | 400-mm Area (Intact IS/OS%) | SD |
|---|---|---|---|---|---|
| All eyes | 74 | 58.3 | 25.0 | 56.4 | 26.0 |
| Healthy eyes | 30 | 78.1 | 12.1 | 73.3 | 14.2 |
| Dry AMD | 19 | 49.4 | 21.9 | 50.4 | 25.0 |
| All eyes excluding dry AMD | 55 | 61.4 | 25.5 | 58.5 | 26.3 |
| Macular edema | 25 | 41.2 | 22.6 | 40.8 | 26.7 |
| VO with CME | 6 | 36.4 | 17.3 | 32.4 | 15.3 |
| DME | 6 | 38.9 | 22.5 | 39.8 | 15.5 |
| ERM with CME | 4 | 38.9 | 34.6 | 42.4 | 32.1 |
| Pseudophakic CME | 4 | 34.0 | 39.5 | 37.6 | 31.6 |
| Neovascular AMD | 3 | 35.6 | 15.1 | 40.5 | 14.6 |
| VMT with CME | 2 | 85.1 | 1.2 | 78.4 | 8.4 |
n, number; SD, standard deviation; VO, retinal vein occlusion; CME, cystoid macular edema; ERM, idiopathic epiretinal membrane; VMT, vitreomacular traction.
In all eyes, mean CST was 298.0 ± 114.6 mm, mean MV was 10.15 ± 1.71 mm3, and mean AMT was 283.7 ± 45.9 mm. Depending on whether eyes were healthy or affected with retinal pathology, visual acuity and OCT thickness measurements varied considerably (Table 1). The results of visual acuity, correlated with en face area, OCT retinal thickness, and volume are listed in Table 3 and Figure 3–Figure 5. En face area measurements demonstrated greater correlation than retinal thickness or volume in the majority of analysis. In all eyes, central 1mm and 400-µm en face areas were 58.3 ± 25.0% and 56.4 ± 26.0%, respectively, which showed significant correlation with visual acuity (Pearson correlation, r = −0.664 and −0.560, respectively, P < 0.001 for both). This correlation was greater than that of visual acuity compared with mean CST (r = 0.398, P < 0.001), MV (r = 0.365, P = 0.002), or AMT (r = 0.374, P = 0.001).
Table 3.
Comparison of En Face Areas, Central Subfield Thickness, Macular Volume, and Average Macular Thickness Pearson Correlations With Visual Acuity
| Diagnosis | n | 1-mm Area Pearson |
P | 400-µm Area Pearson |
P |
t-Test 400 µm vs. 1 mm |
CST Pearson |
P | MV Pearson |
P | AMT Pearson |
P |
|---|---|---|---|---|---|---|---|---|---|---|---|---|
| All eyes | 74 | −0.664 | <0.0001 | −0.560 | <0.0001 | 0.129 | 0.398 | 0.0004 | 0.365 | 0.002 | 0.374 | 0.001 |
| Healthy eyes | 30 | −0.616 | 0.0002 | −0.587 | 0.00 | 0.013 | 0.187 | 0.32 | −0.056 | 0.89 | −0.044 | 0.81 |
| Dry AMD | 19 | −0.066 | 0.78 | 0.009 | 0.97 | 0.638 | −0.462 | 0.95 | −0.329 | 0.79 | −0.447 | 0.62 |
| All eyes excluding dry AMD | 55 | −0.812 | <0.0001 | −0.717 | <0.0001 | 0.054 | 0.577 | ,0.0001 | 0.629 | <0.001 | 0.633 | <0.0001 |
| Macular edema | 25 | −0.676 | 0.0002 | −0.532 | 0.01 | 0.845 | 0.446 | 0.025 | 0.617 | 0.0010 | 0.620 | 0.0009 |
| VO with CME | 6 | −0.449 | 0.37 | −0.810 | 0.05 | 0.411 | 0.631 | 0.17 | 0.543 | 0.26 | 0.550 | 0.25 |
| DME | 6 | −0.813 | 0.002 | −0.930 | 0.007 | 0.805 | 0.761 | 0.045 | 0.890 | 0.034 | 0.888 | 0.03 |
| ERM with CME | 4 | −0.447 | 0.55 | −0.636 | 0.36 | 0.596 | 0.276 | 0.40 | 0.051 | 0.94 | 0.064 | 0.93 |
| Pseudophakic CME | 4 | −0.881 | 0.11 | −0.896 | 0.10 | 0.667 | 0.821 | 0.17 | 0.998 | 0.001 | 0.999 | 0.0006 |
| Neovascular AMD | 3 | 0.536 | 0.319 | −0.449 | 0.351 | 0.622 | 0.276 | 0.41 | 0.907 | 0.138 | 0.794 | 0.20 |
| VMT with CME | 2 | −1.00 | na | −1.00 | na | 0.414 | −1.00 | na | −1.00 | na | −1.00 | na |
n, number; VO, retinal vein occlusion; CME, cystoid macular edema; ERM, idiopathic epiretinal membrane; VMT, vitreomacular traction; na, sample size too small to calculate significance.
Fig. 3.

Correlation of en face outer retinal 1-mm and 400-mm areas, CST, AMT, and MV with visual acuity in all eyes and healthy eyes.
Fig. 5.

Correlation of en face outer retinal 1-mm and 400-µm areas, CST, AMT, and MV with visual acuity in eyes with nonneovascular AMD (dry AMD) and eyes without dry AMD.
The significance of the correlations varied by diagnosis; en face OCT area correlation was much greater compared with CST, MV, and AMT in all eyes as a group, healthy eyes, and eyes with macular edema (Figure 3 and Figure 4). These differences varied depending on the macular edema etiology, although the few eyes studied precluded statistical significance in many subanalysis groups (Table 3). However, in eyes with dry AMD, there was poor and nonstatistically significant correlation observed for all measurements. Excluding eyes with dry AMD, all measurements demonstrated statistically significant correlation with visual acuity, but it was highest for the 1-mm (r = −0.812, P < 0.001) and 400-µm en face areas (r = −0.717, P < 0.001) than for CST (r = 0.577, P < 0.001), MV (r = 0.629, P < 0.001), or AMT (r = 0.633, P < 0.001; Figure 5).
Fig. 4.

Correlation of en face outer retinal 1-mm and 400-µm areas, CST, AMT, and MV with visual acuity in eyes with macular edema.
Discussion
Using Cirrus SD OCT and a specific Metamorph computer software algorithm, we have described en face OCT visualization of the outer retina in a variety of patients and attempted to correlate visual acuity with parafoveal areas of intact IS/OS. We report a relatively strong correlation between en face area and visual acuity especially when compared with standard OCT measurements. To our knowledge, this is the first comparative study describing the close association of outer retinal layer en face visualization with the IS/OS seen on crosssectional scan using a commercial SD OCT device for healthy eyes and a variety of pathologies, and the first to correlate en face area with visual acuity for the same.
Previous studies attempting to generate en face fundus images have used scanning laser ophthalmoscopy with relatively high transverse resolution and contrast19; however, pupil aperture and ocular aberrations limited the axial resolution to a level insufficient to realize fine retinal details such as the IS/OS junction. In contrast to this, large volumes of rapid, high-resolution images can be obtained with SD OCT despite the long depth of focus as occurs during in vivo retinal imaging.1,20 Other research has used retinal densitometry to experimentally measure in vivo changes of visual pigment density within rods and cones.21 Hofer et al22 also used high-resolution adaptive optics imaging combined with retinal densitometry to differentiate the relative numbers of L, M, and S photoreceptors identified near the central 1° of the macula, essentially describing a “cone mosaic,” which exists within the fovea. A separate study used SD OCT to view en face retinal topography in patients with macular edema and correlate cross-sectional thickness with Stratus OCT, but did not separately visualize the outer retina or IS/ OS.23 Another recent article described the creation of high-resolution en face images of the outer retinal layers, built with prototype SD OCT systems, including the central 2° to 4° of the parafoveal IS/OS junction and tips of the outer photoreceptors. The authors described the cellular morphology and photoreceptor density seen in a normal subject, and abnormalities observed in 1 patient with Type 2 macular telangiectasia and another with retinitis pigmentosa.24 Although this was a small, qualitative study using experimental technology, the data did reveal disruption of the IS/OS junction in diseased compared with healthy eyes with en face images, which we also observed in our study. However, none of these previous studies attempted to correlate structural findings with visual function.
Forooghian et al16 examined patients with DME and demonstrated a much stronger correlation of photoreceptor outer length to visual acuity than was seen with macular thickness in 3 different zones, including CST and the central 330-µm central fovea point, which is similar to the 2 central areas studied in this report. Although their correlations of outer retinal analysis were slightly lower than ours (r = −0.81, P < 0.0001 and r = −0.75, P < 0.0001 for CST and central fovea point, respectively) and their correlation results of macular thickness measurements were much lower than ours (r = 0.13, P < 0.05 and r = 0.14, P < 0.05 for CST and central fovea point, respectively), they only included eyes that did not have subretinal fluid present on SD OCT.16 The prototype algorithm developed and used by the authors measured photoreceptor outer length as the distance from the IS/OS to the inner boundary of the RPE; thus, inclusion of eyes with subretinal fluid would have made some measurements erroneously high. Although their results also support the notion that photoreceptor health correlates with visual acuity, our study design, despite having fewer patients with DME, may more accurately reflect the effect of subretinal fluid on photoreceptor function.
Only one other study has described the Cirrus advance visualization en face software and correlated with visual acuity in patients with macular pathology. Oh et al17 retrospectively reviewed patients with macular hole who had SD OCT before and after surgery. Their group analyzed the same advanced visualization 3D mode as our group; however, they used Image J (http://rsb.info.nih.gov/ij/) to analyze the images. This program is provided online for free by the National Institutes of Health, but it does not allow hyper/hyporeflective OCT signal color contrast analysis, as does Metamorph, the program used by our group. Therefore, their visual acuity correlation was based on a more arbitrary black and white interpretation rather than a closer color-based threshold analysis of the actual Cirrus en face data that Metamorph provided.
The results of our study demonstrate poor overall correlation of visual acuity with all parameters in eyes with dry AMD. The pathologic features of dry AMD that were present in this study’s patients, including basal laminar, basal linear and cuticular drusen, retinal pigmentary changes, drusenoid pigmented epithelial detachments, and geographic atrophy, may have altered the IS/OS and RPE plane, which resulted in abnormal en face images to be generated by the Cirrus software. Schuman et al. used an investigational SD OCT system to describe outer retinal findings in eyes with dry AMD and found that in most eyes drusen appeared to bulge into the photoreceptor layer, and in 47% of eyes, there was photoreceptor outer segment loss focally over at least 1 druse, which was associated with disruption or loss of the hyperreflective band at the IS/OS.25 Because the en face analysis used in this study was dependent on the presence or absence of a clear, hyperreflective IS/OS line, focal disruption of this line by changes induced by dry AMD may have precluded accurate correlation with visual acuity in this subgroup. Furthermore, in patients with central or paracentral scotoma as a result of advanced disease, fixation difficulties may have contributed to small eye movements, resulting in less en face data to be acquired. Although a previous study determined that there was no significant correlation between signal strengths between ~6 and 9 and macular thickness parameters with time-domain OCT, it is not currently known whether a weakened SD OCT signal strength may contribute to degeneration of the subsequent en face image. In addition, a total of 6 scans were excluded, because of scanning errors within the 6 × 6-mm scan area because of patient movement or blinking. Because this type of error may be relatively common in a clinical setting, it is important to recognize central macular scan alignment errors and consider either rescanning the patient or manually calibrating the reference lines.
Our study demonstrated greater association of CST, MV, and AMT with visual acuity in eyes with macular edema and in all eyes with dry AMD excluded. Although there are little data available regarding AMT,27 the correlation of MV and CST with visual acuity was higher for these two subgroups than was seen in other studies of similar eyes.10,16,28–31 This likely reflects difference in patient selection, instrumentation, and experimental methods. With one exception,16 other research that examined the relationship between retinal thickness and visual acuity used OCT instruments that were time domain and used segmentation algorithms different than that of Cirrus SD OCT. Average macular thickness, which is automatically generated by Cirrus OCT, can be derived using the manufacturer’s formula (Carl Zeiss Meditec, unpublished data, Durbin M, PhD, 2008) applied to either the MV or each macular thickness value of the 9 test subfields.27 Because AMT is a function of MV, and both reflect the 3D structure of the retina, this may explain the higher correlation seen with visual acuity in patients with macular edema. Also, because the macular edema subgroup makes up 45.4% of the total number of all eyes without dry AMD, it is likely that eyes with macular edema are overrepresented for this group; furthermore, the inclusion of normal eyes in the study may also contribute to an increased correlation compared with previous studies, which only analyzed eyes with retinal pathology.
Aside from a relatively small sample size, another weakness of this study is that, even in healthy eyes, factors other than a disrupted IS/OS may have resulted in decreased visual acuity. Although media opacities precluding a complete macular cube scan were excluded, the presence of cataract, corneal edema, or surface abnormalities may have resulted in decreased visual acuity. Furthermore, other aspects of the posterior segment, including the vitreous, optic nerve, RPE, and nine other retinal layers, contribute toward visual acuity rather than just the IS/OS and photo-receptors alone. For example, in the presence of intraor subretinal fluid, decreased visual acuity may occur from metamorphopsia induced by the distortion of light as it is transmitted through swollen retinal tissues, even in the presence of an intact IS/OS. Conversely, IS/OS abnormalities may reflect perturbation of a higher level of retinal organization and not an absolute loss of photoreceptors.10 Retinal ischemia, more likely occurring in a condition such as DME, may have also decreased IS/OS integrity within the entire macula, causing decreased visual acuity despite a higher percentage of central IS/OS inclusion compared with a condition such as pseudophakic CME, which has a better overall macular grid IS/OS integrity and visual acuity, but a lower central inclusion area (Figure 1 and Figure 2, bottom 2 examples).
Usually, the IS/OS line is continuous on cross-sectional OCT images in healthy eyes. Therefore, en face area might be expected to be nearly 100% in the healthy eyes. Yet, as seen in Figure 1, the IS/OS line seems disrupted on the cross-sectional OCT in the healthy eye. This may be explained by the fact that although the IS/OS in each individual cross-sectional scan may appear continuous, the standard Cirrus SD OCT protocol used consists of 512 A-scans over a 6 × 6-mm area. However, the en face visualization is summed interpolation of the entire 6 × 6-mm area, even though there are unscanned lines within this area. Therefore, with Cirrus en face visualization, there is inherent decreased IS/OS density even within healthy eyes. Also, as demonstrated in healthy eyes, the 1-mm area was significantly more associated with visual acuity than the 400-µm area; visual acuity is likely a summation of retinal function larger than the central 1-mm area. Although the fovea may be responsible for Snellen visual acuity per se, mean retinal visual sensitivity in the macular area likely represents a summation of retinal function. Therefore, analysis of a wider area with a standardized vision testing environment may improve the correlation and may be a subject of future investigations. In addition, although this study suggests proof-of-concept for en face OCT visualization, the evidence suggesting correlation with visual acuity would be strengthened with repeatability and reproducibility data, as was demonstrated in Forooghian et al16 correlation of outer photoreceptor length and visual acuity in diabetic eyes.
There are at least 9 commercially produced SD OCT devices that are or will be available shortly, many of which have built-in, advanced features such as 3D analysis that may not be fully used in a busy clinical practice.32 Despite a relatively small sample size, the results of this pilot study indicate a potential role for applying the advanced visualization 3D analysis mode of Cirrus SD OCT to generate en face images of the IS/ OS. En face OCT analysis of the photoreceptors is an exciting aspect of clinical and experimental retinal imaging, which deserves further exploration. Furthermore, the significant association of central macular IS/OS en face areas with visual acuity strongly supports the role of SD OCT for deriving a closer relationship of retinal structure and visual function within a clinical setting.
Acknowledgments
Supported in part by University of Illinois at Chicago core grant EY01792, an unrestricted grant from Research from Prevent Blindness, and the Gerhard Cless Retina Research Fund (J.I.L.).
Footnotes
Presented in part as paper presentations at the 2010 meetings of the Macula Society, Tucson, AZ, February 27; American Ophthalmologic Association, White Sulphur Springs, WV, May 22; American Society of Retina Specialists, Vancouver, BC, Canada, August 30; and the Retina Society, San Francisco, CA, September 25.
The authors declare no proprietary interest or conflict of interest.
References
- 1.Huang D, Swanson EA, Lin CP, et al. Optical coherence tomography. Science. 1991;254:1178–1181. doi: 10.1126/science.1957169. [DOI] [PMC free article] [PubMed] [Google Scholar]
- 2.Drexler W, Morgner U, Ghanta RK, et al. Ultra-high resolution ophthalmic optical coherence tomography. Nat Med. 2001;7:502–507. doi: 10.1038/86589. [DOI] [PMC free article] [PubMed] [Google Scholar]
- 3.Drexler W, Sattmann H, Hermann B, et al. Enhanced visualization of macular pathology with the use of ultrahigh resolution optical coherence tomography. Arch Ophthalmol. 2003;121:695–706. doi: 10.1001/archopht.121.5.695. [DOI] [PubMed] [Google Scholar]
- 4.Wojtkowski M, Srinivasan V, Fujimoto JG, et al. Three-dimensional retinal imaging with high-speed ultrahigh-resolution optical coherence tomography. Ophthalmology. 2005;112:1734–1746. doi: 10.1016/j.ophtha.2005.05.023. [DOI] [PMC free article] [PubMed] [Google Scholar]
- 5.Nassif N, Cense B, Park BH, et al. In vivo high-resolution video rate spectral-domain optical coherence tomography of the human retina and optic nerve. Opt Express. 2004;12:367–376. doi: 10.1364/opex.12.000367. [DOI] [PubMed] [Google Scholar]
- 6.Wojtkowski M, Srinivasan VJ, Ko TH, et al. Ultrahigh-resolution, high-speed, Fourier domain optical coherence tomography and methods for dispersion compensation. Opt Express. 2004;12:2404–2422. doi: 10.1364/opex.12.002404. [DOI] [PubMed] [Google Scholar]
- 7.Choi SS, Zawadzki RJ, Greiner MA, et al. Fourier-domain optical coherence tomography and adaptive optics reveal nerve fiber layer loss and photoreceptor changes in a patient with optic nerve drusen. J Neuroophthalmol. 2008;28:120–125. doi: 10.1097/WNO.0b013e318175c6f5. [DOI] [PMC free article] [PubMed] [Google Scholar]
- 8.Gibran SK, Khan K, Jungkim S, Cleary PE. Optical coherence tomographic pattern may predict visual outcome after intravitreal triamcinolone for diabetic macular edema. Ophthalmology. 2007;114:890–894. doi: 10.1016/j.ophtha.2006.11.026. [DOI] [PubMed] [Google Scholar]
- 9.Arichika S, Hangai M, Yoshimura N. Correlation between thickening of the inner and outer retina and visual acuity in patients with epiretinal membrane. Retina. 2010;30:503–508. doi: 10.1097/IAE.0b013e3181bd2d65. [DOI] [PubMed] [Google Scholar]
- 10.Mitamura Y, Hirano K, Baba T, Yamamoto S. Correlation of visual recovery with presence of photoreceptor inner/outer segment junction in optical coherence images after epiretinal membrane surgery. Br J Ophthalmol. 2009;93:171–175. doi: 10.1136/bjo.2008.146381. [DOI] [PubMed] [Google Scholar]
- 11.Suh MH, Seo JM, Park KH, Yu HG. Associations between macular findings by optical coherence tomography and visual outcomes after epiretinal membrane removal. Am J Ophthalmol. 2009;147:473–480. doi: 10.1016/j.ajo.2008.09.020. e3. [DOI] [PubMed] [Google Scholar]
- 12.Chang LK, Koizumi H, Spaide RF. Disruption of the photoreceptor inner segment-outer segment junction in eyes with macular holes. Retina. 2008;28:969–975. doi: 10.1097/IAE.0b013e3181744165. [DOI] [PubMed] [Google Scholar]
- 13.Oster SF, Mojana F, Brar M, et al. Disruption of the photoreceptor inner segment/outer segment layer on spectral domainoptical coherence tomography is a predictor of poor visual acuity in patients with epiretinal membranes. Retina. 2010;30:713–718. doi: 10.1097/IAE.0b013e3181c596e3. [DOI] [PubMed] [Google Scholar]
- 14.Ota M, Tsujikawa A, Kita M, et al. Integrity of foveal photoreceptor layer in central retinal vein occlusion. Retina. 2008;28:1502–1508. doi: 10.1097/IAE.0b013e3181840b3c. [DOI] [PubMed] [Google Scholar]
- 15.Ota M, Tsujikawa A, Murakami T, et al. Association between integrity of foveal photoreceptor layer and visual acuity in branch retinal vein occlusion. Br J Ophthalmol. 2007;91:1644–1649. doi: 10.1136/bjo.2007.118497. [DOI] [PMC free article] [PubMed] [Google Scholar]
- 16.Forooghian F, Stetson PF, Meyer SA, et al. Relationship between photoreceptor outer segment length and visual acuity in diabetic macular edema. Retina. 2010;30:63–70. doi: 10.1097/IAE.0b013e3181bd2c5a. [DOI] [PMC free article] [PubMed] [Google Scholar]
- 17.Oh J, Smiddy WE, Flynn HW, Jr, et al. Photoreceptor inner/outer segment defect imaging by spectral domain OCT and visual prognosis after macular hole surgery. Invest Ophthalmol Vis Sci. 2010;51:1651–1658. doi: 10.1167/iovs.09-4420. [DOI] [PubMed] [Google Scholar]
- 18.Kiernan DF, Ksiazek SM, Jampol LM, Grassi MA. Photoreceptor attenuation in acute zonal occult outer retinopathy. Retin Cases Brief Rep. 2010;4:339–345. doi: 10.1097/ICB.0b013e3181d42801. [DOI] [PubMed] [Google Scholar]
- 19.van Norren D, van de Kraats J. Imaging retinal densitometry with a confocal scanning laser ophthalmoscope. Vision Res. 1989;29:1825–1830. doi: 10.1016/0042-6989(89)90163-6. [DOI] [PubMed] [Google Scholar]
- 20.Fercher AF, Hitzenberger CK, Drexler W, et al. In vivo optical coherence tomography. Am J Ophthalmol. 1993;116:113–114. doi: 10.1016/s0002-9394(14)71762-3. [DOI] [PubMed] [Google Scholar]
- 21.Ripps H, Weale RA. Analysis of foveal densitometry. Nature. 1965;205:52–56. doi: 10.1038/205052a0. [DOI] [PubMed] [Google Scholar]
- 22.Hofer H, Carroll J, Neitz J, et al. Organization of the human trichromatic cone mosaic. J Neurosci. 2005;25:9669–9679. doi: 10.1523/JNEUROSCI.2414-05.2005. [DOI] [PMC free article] [PubMed] [Google Scholar]
- 23.Mizota A, Sakuma T, Miyauchi O, et al. Measurement of retinal thickness from three-dimensional images obtained from C scan images from the optical coherence tomography ophthalmoscope. Clin Experiment Ophthalmol. 2007;35:220–224. doi: 10.1111/j.1442-9071.2007.01456.x. [DOI] [PubMed] [Google Scholar]
- 24.Rosen RB, Hathaway M, Rogers J, et al. Multidimensional en-face OCT imaging of the retina. Opt Express. 2009;17:4112–4133. doi: 10.1364/oe.17.004112. [DOI] [PubMed] [Google Scholar]
- 25.Schuman SG, Koreishi AF, Farsiu S, et al. Photoreceptor layer thinning over drusen in eyes with age-related macular degeneration imaged in vivo with spectral-domain optical coherence tomography. Ophthalmology. 2009;116:488–496. doi: 10.1016/j.ophtha.2008.10.006. [DOI] [PMC free article] [PubMed] [Google Scholar]
- 26.Barkana Y, Burgansky-Eliash Z, Gerber Y, et al. Inter-device variability of the Stratus optical coherence tomography. Am J Ophthalmol. 2009;147:260–266. doi: 10.1016/j.ajo.2008.08.008. [DOI] [PubMed] [Google Scholar]
- 27.Kiernan DF, Hariprasad SM, Chin EK, et al. Prospective comparison of cirrus and stratus optical coherence tomography for quantifying retinal thickness. Am J Ophthalmol. 2009;147:267–275. doi: 10.1016/j.ajo.2008.08.018. e2. [DOI] [PubMed] [Google Scholar]
- 28.Zambarakji HJ, Amoaku WM, Vernon SA. Volumetric analysis of early macular edema with the Heidelberg retina tomograph in diabetic retinopathy. Ophthalmology. 1998;105:1051–1059. doi: 10.1016/S0161-6420(98)96007-9. [DOI] [PubMed] [Google Scholar]
- 29.Larsson J, Zhu M, Sutter F, Gillies MC. Relation between reduction of foveal thickness and visual acuity in diabetic macular edema treated with intravitreal triamcinolone. Am J Ophthalmol. 2005;139:802–806. doi: 10.1016/j.ajo.2004.12.054. [DOI] [PubMed] [Google Scholar]
- 30.Keane PA, Liakopoulos S, Chang KT, et al. Relationship between optical coherence tomography retinal parameters and visual acuity in neovascular age-related macular degeneration. Ophthalmology. 2008;115:2206–2214. doi: 10.1016/j.ophtha.2008.08.016. [DOI] [PMC free article] [PubMed] [Google Scholar]
- 31.Diabetic Retinopathy Clinical Research Network. Browning DJ, Glassman AR, Aiello LP, et al. Relationship between optical coherence tomography-measured central edema. Ophthalmology. 2007;114:525–536. doi: 10.1016/j.ophtha.2006.06.052. [DOI] [PMC free article] [PubMed] [Google Scholar]
- 32.Kiernan DF, Mieler WF, Hariprasad SM. Spectral-domain optical coherence tomography: a comparison of modern high-resolution retinal imaging systems. Am J Ophthalmol. 2010;149:18–31. doi: 10.1016/j.ajo.2009.08.037. [DOI] [PubMed] [Google Scholar]