

Abstract
Insulin resistance (IR) and pancreatic β-cell dysfunction lead to type 2 diabetes mellitus (DM). We tested whether risk factors would differ for DM that was preceded predominantly by IR, β-cell dysfunction, or both among 4,384 older adults (mean age, 72.7 (standard deviation, 5.6) years) in the Cardiovascular Health Study, which was conducted in North Carolina, California, Maryland, and Pennsylvania (1989–2007). When evaluating established risk factors, we found older age, greater adiposity, higher systolic blood pressure, a lower high-density lipoprotein cholesterol level, a higher triglyceride level, and a lower alcohol intake to be independently associated with greater IR but, conversely, with better β-cell function (P < 0.001). The prospective associations between some risk factors and incident DM varied significantly depending on whether DM was preceded predominantly by IR, β-cell dysfunction, or both. For example, obesity and lower high-density lipoprotein cholesterol levels were positively associated with DM preceded predominantly by IR (hazard ratio (HR) = 5.02, 95% confidence interval (CI): 2.81, 9.00; and HR = 1.97, 95% CI: 1.32, 2.93, respectively), with a significant association with and an insignificant trend toward a lower risk of DM preceded predominantly by β-cell dysfunction (HR = 0.33, 95% CI: 0.14, 0.80; and HR = 0.78, 95% CI: 0.43, 1.39, respectively). In conclusion, among older adults, DM risk factors were differentially associated with DM preceded predominantly by IR or β-cell dysfunction. Biologic and clinical implications of putative subtypes of DM require further investigation.
Keywords: aging, diabetes mellitus, incidence, insulin resistance, insulin-secreting cells, risk factors
Type 2 diabetes mellitus (DM) is caused by both insulin resistance (IR) and β-cell dysfunction (1–3), each of which is independently associated with the onset of DM (4–12). Although there may be overlap of these conditions in some individuals, many people exhibit predominantly either IR or β-cell dysfunction (1, 13, 14). Thus, whereas the clinical diagnosis of DM is based on the common manifestation of elevated glucose, the underlying pathophysiology may vary across individuals. It would be important to determine whether this was true in older adults, in whom β-cell dysfunction may be relatively common (15). If DM is predominantly caused by either IR or β-cell dysfunction in some persons, then the factors predicting these different “subtypes” of DM—and the most relevant foci for their prevention and treatment—may also be different (1–3).
Prior studies have consistently shown that IR was related to classic DM risk factors, including greater rates of adiposity, hypertension, and hyperlipidemia (16–26). Some investigators have also examined risk factors for β-cell dysfunction (22–32), but rarely with multivariable adjustment (21, 26). No studies have prospectively assessed independent associations of the risk factors with incident DM preceded predominantly by IR, β-cell dysfunction, or both. To address the gap of knowledge regarding the potential subtypes of DM, we investigated multivariable-adjusted associations between the DM risk factors and measures of IR and β-cell dysfunction, as well as prospective associations of these risk factors with incident DM preceded predominantly by IR, β-cell dysfunction, or both among older adults in the Cardiovascular Health Study (CHS).
MATERIALS AND METHODS
Design and population
The CHS is a prospective cohort study among US older adults, the details of which have been published previously (33). Briefly, 5,201 ambulatory, noninstitutionalized adults older than 65 years of age were randomly selected and enrolled in 1989–1990 from Medicare eligibility lists in 4 counties in North Carolina, California, Maryland, and Pennsylvania; an additional 687 African-American participants were similarly recruited and enrolled in 1992–1993. Among all eligible adults contacted, 53% agreed to enroll. Each center's institutional review committee approved the study, and all participants provided informed written consent.
The study design and participants for the present analyses are presented in Figure 1. We excluded participants with prevalent DM at baseline (n = 1,321), defined by use of antidiabetic medication (34), a fasting glucose level of 7.0 mmol/L or more, or a 2-hour postchallenge glucose level of 11.1 mmol/L or greater; with missing baseline data on fasting glucose or insulin levels (n = 82); with a fasting glucose level less than 3.5 mmol/L, which would preclude calculation of a β-cell dysfunction index (n = 1); who died within the first year of follow-up (n = 75); or who refused follow-up or moved away during follow-up (n = 25). There were 4,384 participants available for the present study. For prospective analyses of incident DM, we further excluded 485 participants in whom IR and β-cell dysfunction could not be determined (see below).
Figure 1.

Measurements for cross-sectional and longitudinal analyses, Cardiovascular Health Study, 1989–2007. We used cross-sectional analysis to evaluate 4,384 adults in total. Longitudinal analysis related baseline risk factors for type 2 diabetes mellitus (DM) in 1989–1990 to incident DM identified between 1992 and 2007. In the longitudinal analysis, measures of homeostatic model assessment for insulin resistance (HOMA-IR) and β-cell function (HOMA-B) in 1992–1993 were used as additional criteria to subclassify incident DM into its subtypes (preceded predominantly by IR, β-cell dysfunction, or both). Meds, medication.
At baseline and annual follow-up examinations, participants completed standardized interviews to assess sociodemographic characteristics, lifestyle habits, and medications and underwent in-clinic physical examinations, including standardized measurement of anthropometric characteristics (33–36). Blood pressure (BP) and fasting measures of glucose, insulin, and lipids were assessed using standard methods as previously described (37). Weight at 50 years of age was assessed via a questionnaire. Participants were examined annually in study clinic visits for 10 years and via 6-month telephone contacts thereafter.
Assessment of IR and β-cell dysfunction
In primary analysis, we evaluated degrees of IR and β-cell dysfunction by homeostatic model assessment for IR (HOMA-IR) and β-cell dysfunction (HOMA-B) calculated from fasting glucose and insulin levels using the formulas HOMA-IR = glucose × insulin/22.5 and HOMA-B = 20 × insulin/(glucose − 3.5) (38). A higher HOMA-IR value indicates greater IR, and a lower HOMA-B value indicates greater β-cell dysfunction, as validated against gold standards (r = 0.5–0.7) (38–40). HOMA-IR and HOMA-B were moderately positively correlated (r = 0.6), that is, greater IR was correlated with less β-cell dysfunction, as observed for gold-standard measures for IR and β-cell dysfunction (r = 0.09) (39).
In cross-sectional analyses, we evaluated HOMA-IR and HOMA-B assessed repeatedly in 1989–1990 and 1992–1993 as outcomes (Figure 1). Secondary analyses were conducted to evaluate measures of fasting and 2-hour glucose and insulin from 3,757 adults (86%) who had an oral glucose tolerance test performed at baseline in 1989–1990; postload IR and β-cell dysfunction had greater validity against gold standards (r = 0.6–0.8) than did fasting HOMA measures (40). In longitudinal analyses, we used follow-up HOMA-IR and HOMA-B values in 1992–1993 (3 years after the baseline (Figure 1)) as additional diagnostic criteria to subclassify incident DM (1992–2007) into its subtypes (see below).
Risk factors for DM
Demographic, anthropometric, and physiological factors were previously identified as independent risk factors for DM (41, 42). Risk factors assessed in 1989–1990 and 1992–1993 were related to HOMA-IR and HOMA-B in cross-sectional analyses; those assessed in 1989–1990 were related to incident DM (1992–2007) in longitudinal analyses.
Body mass index (BMI) was calculated as weight in kilograms divided by height in meters squared. Pulse pressure was calculated by subtracting diastolic BP from systolic BP. Physical activity level and diet were evaluated by creating a summary score for each, as previously described (42). Physical activity level, including pace of walking (<2, 2–3, or >3 mph) and leisure-time activity (kcal/week), was assessed using a modified Minnesota Leisure-Time Activities questionnaire (43). These 2 measures of physical activity were summarized as a score (42). Alcohol consumption and dietary habits were assessed using a validated questionnaire at baseline (44). We created a dietary score that represented diet quality based on reported intakes of trans fat and dietary fiber, overall glycemic index of reported food consumption, and the ratio of polyunsaturated to saturated fat intakes (42). Smoking status was assessed using a questionnaire, and participants were categorized as never, current, or former smokers.
In our longitudinal analyses, we used previously determined risk categorizations (41) to evaluate established DM risk factors, including overweight (BMI 25–29.9), obesity (BMI ≥30.0), hypertension (systolic BP >130 mm Hg, diastolic BP >85 mm Hg, or taking antihypertensive drugs), low high-density lipoprotein cholesterol (HDL-C) (<1.03 mmol/L or <40 mg/dL in men and <1.29 mmol/L or <50 mg/dL in women), high triglycerides (≥1.69 mmol/L or ≥150 mg/dL), and impaired fasting glucose (5.5–6.9 mmol/L or 100–125.9 mg/dL). We separately examined lifestyle factors and in more detail each of multiple adiposity measures investigated in our prior work for incident DM (36).
Ascertainment and subclassification of incident DM
Ascertainment of incident DM
In longitudinal analyses, we evaluated incident DM between 1992 and 2007 as a primary outcome. An incident DM event was identified as new use of antidiabetic medications (assessed annually) (34), a fasting glucose level of 7.0 mmol/L or greater (assessed in 1992–1993, 1996–1997, and 2005–2006), or a 2-hour glucose level of 11.1 mmol/L or greater based on an oral glucose tolerance test (assessed in 1996–1997) (Figure 1). To examine the stability of our findings, we performed sensitivity analysis in which we defined incident DM only by antidiabetic medication use.
Subclassification of incident DM
To evaluate incident DM cases with various degrees of preceding IR and β-cell dysfunction, we applied additional criteria to subclassify incident DM cases into the following subtypes: 1) DM preceded predominantly by IR with preserved β-cell function, 2) DM preceded predominantly by β-cell dysfunction without preceding IR, 3) DM preceded by both IR and β-cell dysfunction, in which insulin secretion dropped in setting of IR, and 4) DM preceded by neither IR nor β-cell dysfunction. Using population medians of follow-up HOMA-IR and HOMA-B values, DM preceded by IR was defined as incident DM with a preceding HOMA-IR value greater than the median and DM preceded by β-cell dysfunction was defined as incident DM with a preceding HOMA-B value less than the median (13). In our preliminary analyses, few DM cases (n = 15) were preceded by neither IR nor β-cell dysfunction, and thus this subtype was not further evaluated. We used HOMA-IR and HOMA-B assessed during follow-up (1992–1993) but preceding incident DM. Incident DM occurring before assessments of HOMA-IR and HOMA-B were treated as noncases.
Alternative subclassification of incident DM
For sensitivity analyses, we repeated the longitudinal analyses using different criteria of DM subclassification. We subclassified incident DM cases by the 25th percentile of high HOMA-IR and low HOMA-B. We further performed subclassification by tertiles of fasting insulin assessed in 1992–1993 to explore whether fasting insulin alone could be a surrogate for HOMA measures preceding DM diagnosis.
Methodological consideration of disease subclassification
Ideally, measures would be available just before the time of diagnosis to best differentiate potential subtypes of DM at onset. However, in the CHS, information to subclassify incident DM was not assessed in a standardized fashion at innumerable time points. We also recognized that characterizing preceding IR and β-cell dysfunction by baseline measures (13) could produce reverse causation and selection bias. Defining incident cases by baseline characteristics would be equivalent to an approach in a retrospective case-control study: Reverse causation would occur by determining exposure and outcome measured at the same time; selection bias would occur by failing to define noncases as a source population giving rise to the cases; and net influence of the bias would be unknown. Therefore, we characterized preceding IR and β-cell dysfunction using study measures obtained during follow-up (1992–1993), 3 years after the baseline (Figure 1). Correlations between baseline and follow-up HOMA-IR and HOMA-B values were moderate (r = 0.54 and 0.49, respectively).
Statistical methods
Cross-sectional analysis
We evaluated independent associations of established DM risk factors identified in prior studies with cross-sectional levels of HOMA-IR and HOMA-B. We modeled repeated-measure linear regression, estimating robust standard errors, using serial measurements (1989–1990, 1992–1993; 2.9 years apart on average) of glucose, insulin, and DM risk factors and accounting for within-person correlations. We confirmed the assumption that a current outcome was independent of the other time-varying covariates conditional on the current time-varying covariates (data not shown) (45). HOMA-IR and HOMA-B were standardized per each standard deviation at each baseline state. HOMA-B was inversed so that higher coefficients represented greater β-cell dysfunction. Among adults with repeated measures of both glucose and insulin, we examined associations between the DM risk factors assessed at baseline (1989–1990) and 3-year changes in HOMA-IR and HOMA-B (1989–1990 to 1992–1993), with adjustment for baseline levels of HOMA-IR and HOMA-B. The risk factors considered were mutually adjusted and adjusted for prevalent coronary heart disease, prevalent stroke, enrollment clinic, educational level, and income. We also performed secondary cross-sectional analyses evaluating measures of IR and β-cell dysfunction derived from 2-hour oral glucose tolerance test assessed at baseline (1989–1990).
Longitudinal analysis
We evaluated prospective associations of established DM risk factors assessed in 1989–1990, including physiological, anthropometric, and lifestyle factors, with incident DM during 1992–2007 using multivariable-adjusted Cox proportional hazards models. Participants were censored at first diagnosis of DM, death, or last date of informative contact; less than 1% of person-years were censored early because of missing information. We evaluated overall incident DM and mutually exclusive subtypes: 1) DM preceded predominantly by IR, 2) DM preceded predominantly by β-cell dysfunction, and 3) DM with both IR and β-cell dysfunction (see above for classification). The proportionality assumption of Cox regression models for overall DM and DM subtypes was not violated by a test based on Schoenfeld residuals (P > 0.1). For the mutually exclusive subtypes of incident DM, we formally tested the heterogeneity of associations using a competing-risk approach (46). We also projected incident curves in 3 obesity strata.
Values for physiological factors were missing in fewer than 20 participants each; for dietary factors, values were missing for 478 participants. Missing values were imputed using regression analyses that included sociodemographic characteristics, disease histories, and available physiological variables; the main results were similar when we excluded individuals for whom we were missing information (data not shown). Analyses were performed using Stata, version 10.1 (StataCorp LP, College Station, Texas) and SAS, version 9.1.3 (SAS Institute, Inc., Cary, North Carolina), with a 2-tailed α = 0.05.
RESULTS
At baseline, the mean participant age was 72.7 (standard deviation, 5.6) years (range, 65–98 years), 58.6% were women, and more than 15% were nonwhite (Table 1). Approximately half of the older adults had never smoked and had a college education or higher. One of every 6 adults had a history of nonfatal coronary heart disease. Half of the adults were overweight or obese and treated with hypertension medication.
Table 1.
Baseline Characteristics of Study Participants Included in Cross-Sectional and Longitudinal Analysesa, Cardiovascular Health Study, 1989–2007
| Variable | Participants in Cross-Sectional Analyses (n = 4,384) |
Participants in Longitudinal Analyses (n = 3,899) |
||
|---|---|---|---|---|
| Mean (SD) | % | Mean (SD) | % | |
| HOMA-IR, mIU/L·mmol/L | 3.3 (1.7) | 3.3 (1.7) | ||
| HOMA-B, mIU/L·mmol/L | 138 (62) | 138 (61) | ||
| Fasting glucose level, mmol/L | 5.5 (0.5) | 5.5 (0.5) | ||
| Fasting insulin level, mIU/L | 13.5 (9.9) | 13.6 (8.0) | ||
| 2-hour postchallenge glucose level, mmol/Lb | 7.2 (1.8) | 7.2 (1.8) | ||
| 2-hour postchallenge insulin level, mIU/Lb | 78.3 (57.2) | 78.3 (57.2) | ||
| 2-hour HOMA-IR, mIU/L·mmol/Lb | 26.6 (22.2) | 26.9 (23.8) | ||
| Corrected insulin response, μIU/L·(mmol/L)2 b | 7.6 (4.6) | 7.7 (4.9) | ||
| Age, years | 72.7 (5.6) | 72.7 (5.6) | ||
| Male sex | 41 | 42 | ||
| White race | 85 | 96 | ||
| Educational level, some college or higher | 45 | 46 | ||
| Income ≥$25,000 per year | 42 | 44 | ||
| Coronary heart disease | 17 | 17 | ||
| Stroke | 5 | 5 | ||
| Smoking | ||||
| Never | 47 | 46 | ||
| Former smokers | 41 | 42 | ||
| Current smokers | 12 | 12 | ||
| Physical activity level, kcal/weekc | 1,203 (1,564) | 1,265 (1,604) | ||
| Walking pace, mphc | 1.95 (0.48) | 1.97 (0.47) | ||
| Dietary fiber intake, g/dayc | 18.3 (7.2) | 18.3 (7.2) | ||
| % of daily calories from trans fatsc | 1.2 (0.4) | 3.6 (1.2) | ||
| Glycemic index of overall dietc | 50.5 (5.2) | 50.4 (5.4) | ||
| Polyunsaturated: saturated fat ratioc | 0.74 (0.24) | 0.75 (0.26) | ||
| Alcohol, servings/day | 2.5 (5.3) | 2.6 (5.4) | ||
| Body mass indexd | 26.2 (4.5) | 26.0 (4.3) | ||
| Waist circumference, cm | 93 (13) | 92 (12) | ||
| Waist-hip ratio | 0.92 (0.09) | 0.92 (0.09) | ||
| Waist-height ratio | 0.57 (0.08) | 0.56 (0.08) | ||
| Body mass indexd at 50 years of age | 25.1 (3.6) | 25.0 (3.5) | ||
| Weight change since 50 years of age, kg/year | 0.14 (0.41) | 0.13 (0.39) | ||
| Use of medication for hypertension | 42 | 40 | ||
| Systolic blood pressure, mm Hg | 135 (22) | 134 (21) | ||
| Diastolic blood pressure, mm Hg | 71 (11) | 70 (11) | ||
| Pulse pressure, mm Hg | 64 (18) | 65 (18) | ||
| High-density lipoprotein cholesterol level, mmol/L | 1.5 (0.4) | 1.4 (1.4) | ||
| Triglyceride level, mmol/L | 1.5 (0.7) | 1.5 (0.7) | ||
| Fasting glucose level, mmol/L | 5.5 (0.5) | 5.5 (0.5) | ||
Abbreviations: HOMA-B, homeostasis model assessment of β-cell dysfunction; HOMA-IR, homeostasis model assessment of insulin resistance; SD, standard deviation.
a Cross-sectional analyses were used to evaluate potential risk factors for insulin resistance and β-cell dysfunction, and longitudinal analyses were used to evaluate potential risk factors for subtypes of incident type 2 diabetes mellitus. The prospective analyses could not include the second cohort in which African American participants were oversampled, and participants included in cross-sectional and longitudinal analyses showed several differences that were primarily due to race.
b Indices of insulin resistance and β-cell dysfunction were based on both fasting and 2-hour postchallenge glucose and insulin measurements (n = 3,757). Two-hour HOMA-IR was defined by the geometric mean of fasting and 2-hour HOMA-IR. Corrected insulin response is a marker of β-cell function and was defined by insulin /(glucose × (glucose − 3.89)), using each of the 2-hour postchallenge measurements.
c These factors were used as components to calculate physical activity score and dietary score (42).
d Weight (kg)/height (m)2.
Cross-sectional analyses for insulin resistance and β-cell dysfunction
We examined multivariable-adjusted cross-sectional associations of major DM risk factors with degrees of IR and β-cell dysfunction (Figure 2). Compared with women, men had 8.0% (95% CI = 2.7%, 13.1%) and 8.4% (2.7%–14.1%) greater IR and β-cell dysfunction, respectively. Age, BMI, HDL-C, and triglycerides were associated with both IR and β-cell dysfunction (P < 0.02 for both), but in opposite directions. For example, higher BMI was independently associated with less β-cell dysfunction. Physical activity levels and dietary scores were inversely associated with IR (P < 0.004), even after adjustment for potential mediators, but they were unassociated with β-cell dysfunction (P > 0.05). In multivariable models that were not adjusted for the potential mediators, including BMI, hypertension medication use, BP measurements, HDL-C levels, and triglyceride levels, these 3 lifestyle factors were each independently associated with IR, as expected (data not shown). Alcohol use was associated with lesser IR but greater β-cell dysfunction (P < 0.001). Higher pulse pressure was positively associated with IR (P = 0.04) but not with β-cell dysfunction (P = 0.75). When evaluated in place of pulse pressure, systolic BP was positively associated with IR (2.5% higher per 1 standard deviation (10.7 mm Hg), 95% CI: 0.1, 4.9) but not with β-cell dysfunction (P = 0.8), whereas diastolic BP was associated with less IR (3.4% lower per 1 standard deviation (11.2 mm Hg), 95% CI: 1.0%, 5.9%) and greater β-cell dysfunction (3.8% higher per 1 standard deviation, 95% CI: 1.2%, 6.4%). No major difference was identified between results when performed separately for 2 time points. Similar results were observed when analyzing 3-year changes in IR and β-cell dysfunction (Figure 2) and when evaluating baseline 2-hour postload IR and β-cell dysfunction (Web Figure 1, available at http://aje.oxfordjournals.org/).
Figure 2.

Associations of major diabetes risk factors with insulin resistance (IR) and β-cell dysfunction, Cardiovascular Health Study, 1989–1992. A) Cross-sectional results of difference in levels of IR (black bars) and β-cell dysfunction (white bars) (n = 4,384). B) Results of difference in 3-year changes in IR and β-cell dysfunction (n = 3,018). IR and β-cell dysfunction were assessed using homeostatic model assessment for IR (HOMA-IR) and β-cell function (HOMA-B); HOMA-B was then inversed so that higher values represent greater β-cell dysfunction. Positive values represent greater IR or β-cell dysfunction in the cross-sectional results and greater worsening of IR and β-cell dysfunction in the analysis of difference in changes (% of standard deviation (SD) of baseline HOMA-IR or HOMA-B; 1.7 mIU/L·mmol/L and 63.3 mIU/L·mmol/L, respectively). Physical activity score and dietary score were each scaled so that 1 unit represented the difference between the first quintile and the fifth. When examining the changes, we found that results for race (white = 96%) had low precision and they therefore are not presented. All values were adjusted for the listed variables simultaneously and other potential confounders: enrollment clinic (4 categories), educational level (4 categories), annual income (4 categories), prevalent coronary heart disease (yes or no) and prevalent stroke (yes or no). No major difference was identified between results when performed separately for 2 time points. The analyses of changes in IR and β-cell dysfunction were adjusted for their baseline degrees. Associations per 1 standard deviation of difference at baseline were estimated for each of physiological variables: pulse pressure, high-density lipoprotein cholesterol (HDL-C) levels, triglyceride levels, and body mass index (weight (kg)/height (m)2). Bars, 95% confidence interval.
Longitudinal analyses for incident DM
Overall DM
During 43,558 person-years (median follow-up, 11.7 years), 274 adults developed DM. When we examined prospective associations of established DM risk factors with overall DM, higher BMI, hypertension, low HDL-C level, elevated triglyceride level, and elevated glucose level were all independently associated with higher risk of overall DM (all P < 0.05) (Table 2).
Table 2.
Associations of Risk Factors for Type 2 Diabetes Mellitus With Risk of Overall and Subtypes of Type 2 Diabetes Mellitus in Longitudinal Analyses, Cardiovascular Health Study (n = 3,899), 1989–2007a
| Variable | DM Cases Meeting Specific Criteriab |
|||||||
|---|---|---|---|---|---|---|---|---|
| All DM Cases |
Greater Insulin Resistance Plus β-Cell Dysfunctionb |
Greater Insulin Resistanceb |
Greater β-Cell Dysfunctionb |
|||||
| HRc | 95% CI | HRc | 95% CI | HRc | 95% CI | HRc | 95% CI | |
| No. of cases | 274 | 77 | 112 | 70 | ||||
| Person-years | 45,178 | 45,178 | 45,178 | 45,178 | ||||
| Years to DM diagnosis, median (10th and 90th percentiles) | 7.0 (6.7, 15.8) | 7.0 (6.7, 15.8) | 7.0 (6.7, 15.7) | 6.9 (6.7, 15.8) | ||||
| Sex, men vs. women | 1.08 | 0.85, 1.38 | 1.29 | 0.82, 2.03 | 0.94 | 0.64, 1.38 | 1.30 | 0.80, 2.09 |
| Age, per 5-year increment | 0.90 | 0.79, 1.02 | 0.92 | 0.72, 1.18 | 0.70 | 0.55, 0.89 | 1.17 | 0.93, 1.47 |
| Race, white vs. nonwhite | 0.98 | 0.53, 1.79 | 1.02 | 0.32, 3.25 | 0.78 | 0.34, 1.79 | 2.48 | 0.34, 18.0 |
| Body mass indexd | ||||||||
| 25.0–29.9 | 1.18 | 0.88, 1.58 | 1.22 | 0.70, 2.14 | 2.21 | 1.25, 3.92 | 0.61 | 0.37, 1.00 |
| ≥30 | 1.83 | 1.32, 2.54 | 1.76 | 0.94, 3.28 | 5.02 | 2.81, 9.00 | 0.33 | 0.14, 0.80 |
| Blood pressure >130/85 mm Hg or taking hypertension medication, yes vs. no | 1.31 | 0.99, 1.73 | 1.84 | 1.02, 3.30 | 1.43 | 0.91, 2.26 | 0.87 | 0.53, 1.45 |
| HDL-C level <1.03 mmol/L in men or <1.29 mmol/L in women, yes vs. no | 1.34 | 1.03, 1.74 | 1.35 | 0.82, 2.21 | 1.97 | 1.32, 2.93 | 0.78 | 0.43, 1.39 |
| Triglyceride level ≥1.69 mmol/L, yes vs. no | 1.62 | 1.25, 2.10 | 1.82 | 1.12, 2.95 | 1.55 | 1.04, 2.31 | 1.75 | 1.04, 2.94 |
| Fasting glucose level of 5.5– 7.0 mmol/L, yes vs. no | 3.19 | 2.42, 4.21 | 4.62 | 2.60, 8.22 | 2.73 | 1.77, 4.22 | 4.82 | 2.75, 8.46 |
Abbreviations: CI, confidence interval; DM, type 2 diabetes mellitus; HDL-C, high-density lipoprotein cholesterol; HR, hazard ratio.
a Incident DM during 1992–2007 was ascertained by a fasting glucose level of 7.0 mmol/L (126 mg/dL) or higher, a 2-hour post-challenge glucose level of 11.1 mmol/L (200 mg/dL) or higher, or prescription of antidiabetic medication. DM risk factors were assessed at baseline (1989–1990).
b Additional criteria to subclassify incident DM were applied. DM preceded by insulin resistance was defined as DM with a higher than median homeostatic model assessment (HOMA; median, 2.3) assessed after baseline but preceding the diagnosis of incident DM. DM preceded by β-cell dysfunction was defined as DM with a lower than median HOMA (median, 101.9) assessed after baseline but preceding the diagnosis of incident DM. DM events that occurred before assessments of HOMA and DM cases that did not meet the additional criteria were treated as noncases. Analyses of the cases that did not meet the criteria for either DM preceded by insulin resistance or DM preceded by β-cell dysfunction were not performed because of the small number of events (n = 15).
c The Cox proportional hazard model included the listed variables simultaneously for mutual adjustment to estimate independent longitudinal associations.
d Weight (kg)/height (m)2. The reference category was body mass index <25.
Subtypes of incident DM
The factors associated with overall DM were similarly associated with the risk of DM preceded by both IR and β-cell dysfunction or by IR predominantly. In contrast, for DM preceded predominantly by β-cell dysfunction, different profiles of associations were observed (Table 2). For example, overweight and obesity were associated with a lower risk of DM preceded predominantly by β-cell dysfunction, hypertension and low HDL-C were associated with trends toward lower risk and older age was associated with a trend toward higher risk. The measures of associations between DM risk factors and DM preceded predominantly by IR versus β-cell dysfunction significantly differed for overweight (hazard ratio (HR) = 2.21 vs. 0.61, Pheterogeneity = 0.002), obesity (HR = 5.02 vs. 0.33, Pheterogeneity < 0.001), elevated HDL-C (HR = 1.97 vs. 0.78, Pheterogeneity < 0.001), older age (HR = 0.70 vs. 1.17 per 5 years, Pheterogeneity < 0.001), and male sex (HR = 0.94 vs. 1.30, Pheterogeneity = 0.04). Analyses excluding nonwhite adults (n = 270) produced similar results.
When we evaluated diet, alcohol, physical activity levels, and smoking without adjustment for potential mediators such as BMI and other physiological factors, both dietary score and alcohol use were inversely associated with the risk of DM preceded predominantly by IR. The hazard ratio per interdecile range of dietary score was 0.58 (95% CI: 0.37, 0.90), and the hazard ratio comparing drinkers to nondrinkers was 0.59 (95% CI: 0.39, 0.89). Conversely, neither was significantly associated with DM preceded predominantly by β-cell dysfunction (P > 0.4 for both). Physical activity level and smoking status were not significantly associated with DM preceded predominantly by IR or β-cell dysfunction (P > 0.32 for both).
Different adiposity measures were prospectively examined for incident DM subtypes (Table 3). After multivariable adjustment, each adiposity measure was associated with a higher incidence of DM preceded predominantly by IR or both IR and β-cell dysfunction. In contrast, none of the adiposity measures were positively associated with incident DM preceded predominantly by β-cell dysfunction. Further adjustment for adiposity-related risk factors, which could be mediators of associations, attenuated the associations with DM preceded by IR and strengthened the inverse associations with DM preceded by β-cell dysfunction (Table 3).
Table 3.
Association Between Adiposity Measures and the Incidence of Type 2 Diabetes Mellitus, Cardiovascular Health Study (n = 3,899), 1989–2007a
| Variable | DM Cases Meeting Specific Criteriab |
|||||||
|---|---|---|---|---|---|---|---|---|
| All DM Cases |
Greater Insulin Resistance Plus β-Cell Dysfunctionb |
Greater Insulin Resistanceb |
Greater β-Cell Dysfunctionb |
|||||
| HR | 95% CI | HR | 95% CI | HR | 95% CI | HR | 95% CI | |
| No. of DM cases | 274 | 77 | 112 | 70 | ||||
| Person-years | 45,178 | 45,178 | 45,178 | 45,178 | ||||
| Years to DM diagnosis, median (10th and 90th percentiles) | 7.0 (6.7, 15.8) | 7.0 (6.7, 15.8) | 7.0 (6.7, 15.7) | 6.9 (6.7, 15.8) | ||||
| BMIc per 1 SD (4.5) | ||||||||
| Model 1d | 1.42 | 1.26, 1.59 | 1.48 | 1.18, 1.86 | 1.72 | 1.47, 2.01 | 0.77 | 0.57, 1.04 |
| Model 2e | 1.15 | 1.01, 1.31 | 1.09 | 0.85, 1.41 | 1.45 | 1.22, 1.72 | 0.57 | 0.41, 0.80 |
| Waist circumference per 1 SD (12.6 cm) | ||||||||
| Model 1d | 1.60 | 1.41, 1.81 | 1.59 | 1.24, 2.04 | 2.17 | 1.81, 2.60 | 0.79 | 0.58, 1.06 |
| Model 2e | 1.32 | 1.15, 1.51 | 1.22 | 0.93, 1.60 | 1.85 | 1.52, 2.24 | 0.61 | 0.44, 0.85 |
| Waist-to-hip ratio per 1 SD (0.09) | ||||||||
| Model 1d | 1.67 | 1.42, 1.97 | 1.68 | 1.23, 2.30 | 2.26 | 1.79, 2.84 | 0.92 | 0.65, 1.30 |
| Model 2e | 1.47 | 1.22, 1.75 | 1.43 | 1.01, 2.04 | 2.09 | 1.61, 2.73 | 0.78 | 0.54, 1.13 |
| Waist-to-height ratio per 1 SD (0.08) | ||||||||
| Model 1d | 1.54 | 1.36, 1.74 | 1.52 | 1.19, 1.93 | 2.03 | 1.70, 2.41 | 0.78 | 0.58, 1.05 |
| Model 2e | 1.29 | 1.11, 1.49 | 1.28 | 0.97, 1.70 | 1.77 | 1.45, 2.17 | 0.59 | 0.41, 0.84 |
| BMIc at 50 years of age per 1 SD (3.6)e | ||||||||
| Model 1d | 1.34 | 1.19, 1.50 | 1.40 | 1.11, 1.76 | 1.52 | 1.29, 1.79 | 0.89 | 0.66, 1.20 |
| Model 2e | 1.14 | 1.01, 1.30 | 1.13 | 0.88, 1.45 | 1.31 | 1.10, 1.56 | 0.75 | 0.55, 1.03 |
| Weight change since 50 years of age per 1 SD (3.9 kg/10 years)e | ||||||||
| Model 1d | 1.27 | 1.14, 1.42 | 1.19 | 0.95, 1.50 | 1.47 | 1.27, 1.70 | 0.85 | 0.64, 1.14 |
| Model 2e | 1.11 | 0.97, 1.27 | 0.99 | 0.75, 1.30 | 1.37 | 1.14, 1.65 | 0.66 | 0.47, 0.91 |
Abbreviations: BMI, body mass index; CI, confidence interval; DM, type 2 diabetes mellitus; HR, hazard ratio.
a Incident DM (1992–2007) was ascertained by a fasting glucose level of 7.0 mmol/L (126 mg/dL) or higher, a 2-hour post-challenge glucose level of 11.1 mmol/L (200 mg/dL) or higher, or prescription of antidiabetic medication. The adiposity measures were assessed at baseline (1989–1990).
b Additional criteria to subclassify incident DM were applied. DM preceded by insulin resistance was defined as DM with a higher than median homeostatic model assessment (HOMA; median, 2.3) assessed after baseline but preceding the diagnosis of incident DM. DM preceded by β-cell dysfunction was defined as DM with a lower than median HOMA (median, 101.9) assessed after baseline but preceding the diagnosis of incident DM. DM events that occurred before assessments of HOMA and DM cases that did not meet the additional criteria were treated as noncases. Analyses of the cases that did not meet the criteria for either DM preceded by insulin resistance or DM preceded by β-cell dysfunction were not performed because of the small number of events (n = 15).
c Weight (kg)/height (m)2.
d Model 1 was adjusted for sociodemographic and lifestyle factors and prevalent diseases: age (continuous), sex (male vs. female), race (white vs. nonwhite), enrollment clinic (4 categories), educational level (4 categories), annual income (4 categories), prevalent coronary heart disease (yes vs. no) and prevalent stroke (yes vs. no), physical activity score level (continuous), dietary score (continuous), smoking status (3 categories), and alcohol consumption (continuous).
e Model 2 was further adjusted for established physiological risk factors: blood pressure greater than 130/85 mm Hg or taking hypertension medication (yes vs. no), high-density lipoprotein cholesterol less than 1.03 mmol/L in men or less than 1.29 mmol/L in women (yes vs. no), triglyceride level of 1.69 mmol/L or more (yes vs. no), and fasting glucose between 5.5 mmol/L and 7.0 mmol/L (yes vs. no).
f Measure of weight at 50 years of age was available for 3,758 adults (41,956 person-years). When examining weight change per 10 years since 50 years of age, BMI at 50 years of age was included in the model.
Incidence of DM subtypes in obesity strata
The overall cumulative incidence of DM was highest among obese individuals, intermediate among overweight individuals, and lowest among normal-weight individuals (Figure 3). However, cumulative incidences of DM subtypes were different between the strata. Among obese individuals, the majority of DM cases were preceded predominantly by IR, whereas among normal-weight individuals, the majority of cases were preceded predominantly by β-cell dysfunction. Among the 3 obesity strata, the cumulative incidence of the latter subtype of DM was the highest in the normal-weight group.
Figure 3.
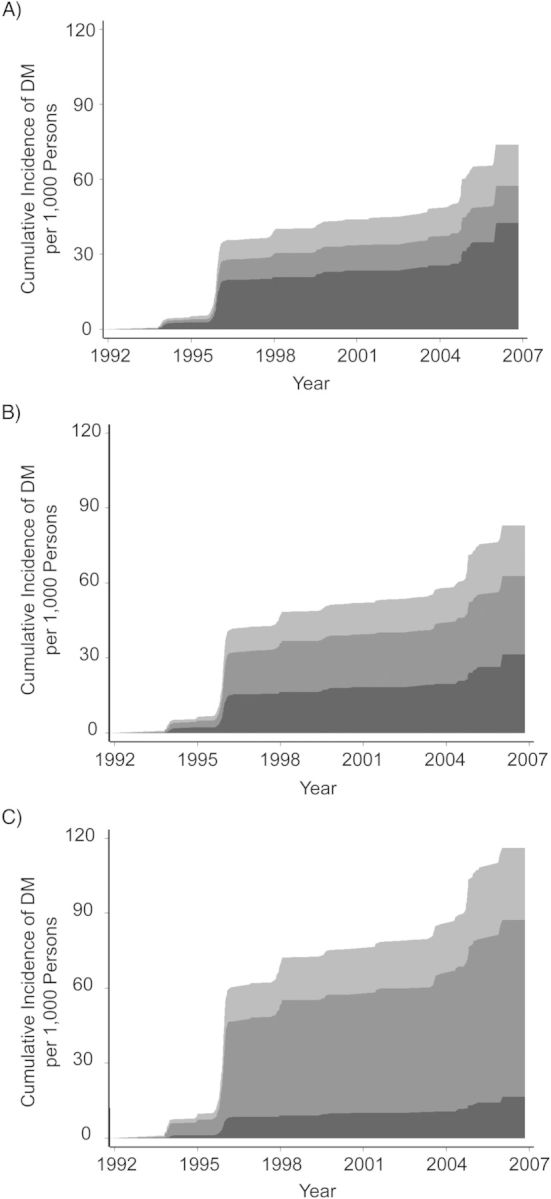
Cumulative incidence of type 2 diabetes mellitus (DM) according to 3 adiposity groups, Cardiovascular Health Study (n = 3,899), 1992–2007. Body mass index (BMI; measured as weight (kg)/height (m)2) was measured in 1989–1990 and used as a measure of adiposity in (A) normal weight adults (BMI <25.0), (B) overweight adults (BMI = 25.0–29.9), and (C) obese adults (BMI ≥30). Incident DM was subclassified as DM preceded predominantly by insulin resistance (IR) (light gray), DM preceded predominantly by β-cell dysfunction (medium gray), and DM preceded by both IR and β-cell dysfunction (dark gray). See text for diagnosis and subclassification of incident DM; availability of fasting and 2-hour glucose measurements in 1996 contributed to the steep increase in the incident rate. Cumulative incidence was adjusted for other factors presented in the Table 2. Obese individuals were more likely overall to develop DM than were normal-weight individuals. However, incident DM preceded predominantly by greater β-cell dysfunction was the highest among the normal-weight individuals, whereas incident DM preceded predominantly by greater IR was the highest among the obese individuals.
Sensitivity analyses
When we evaluated incident DM ascertained only by medication use, 210 cases were identified, and results from longitudinal analyses were generally similar (data not shown). We used the 25th percentile cutpoints of high HOMA-IR and low HOMA-B instead of the medians to classify subtypes of DM. Of incident DM cases, 27.4% did not meet the criteria for either IR or β-cell dysfunction, 41.0% met the criteria for predominant IR, and 30.0% met the criteria for predominant β-cell dysfunction. Unlike when using the median cutpoints, the divergent findings for different DM subtypes were similar (data not shown).
When subclassifying incident DM by fasting insulin level only, we found a partial overlap (Web Table 1). For example, 87% of DM cases in the highest tertile of fasting insulin met the criteria for DM preceded predominantly by IR, and 66% of DM cases in the lowest tertile of fasting insulin met the criteria for DM preceded predominantly by β-cell dysfunction. Similar results were obtained between longitudinal analyses based on DM subclassification by fasting insulin and by HOMA measures.
DISCUSSION
In the present large prospective cohort study of older adults, established DM risk factors, including overweight, obesity, elevated HDL-C, age, and sex, showed significantly different associations with DM preceded predominantly by IR versus β-cell dysfunction. These findings demonstrate the heterogeneity of risk factors for incident DM characterized by potentially differing underlying pathological processes related to IR and/or β-cell dysfunction. Moreover, we also observed heterogeneous relationships of physiological and lifestyle factors with degrees of IR and β-cell dysfunction.
Prior evidence supports the biologic plausibility of heterogeneity of incident DM. We found that greater adiposity and greater weight gain were each independently linked to lower rates of incident DM preceded predominantly by β-cell dysfunction. This finding supports the idea that older adults who have a lower weight or undergo weight loss may have some underlying pathological process that leads to the deterioration of β-cell dysfunction and DM onset (15). DM preceded predominantly by β-cell dysfunction could partly reflect latent autoimmune DM, although autoimmune antibodies were detected only among 5%–20% of individuals with incident DM (1, 47). Additionally, recent animal experiments suggested that elevated serum triglycerides might protect against β-cell dysfunction (48). Our findings and prior evidence warrant further investigation into the pathological processes and determinants of age-related β-cell dysfunction (3, 12).
Our findings suggest that 1 in 4 DM cases in older adults may be preceded predominantly by β-cell dysfunction and that their risk could be missed by reliance on conventional risk factors such as adiposity and atherogenic dyslipidemia. Among older adults impaired β-cell function is more common than in younger adults. Thus, the traditional focus on weight loss and lifestyle modification is likely still relevant for the great majority of younger adults at risk for DM. Weight loss is also a key for older adults with obesity and elevated fasting glucose levels, as demonstrated by the Diabetes Prevention Program (49, 50). Among other older adults, additional focus is needed to identify novel measures to preserve β-cell function, including determination of the roles of both weight management and lifestyle modification.
Prior cross-sectional studies of DM risk factors and IR and β-cell dysfunction have had mixed findings (24–26, 28–30). For instance, Chen et al. (26) reported associations among greater adiposity, higher triglycerides, and lower HDL-C with levels higher C-peptide, a marker of better β-cell function (38), whereas the Diabetes Prevention Program and San Antonio Heart Study found no significant associations of these risk factors with HOMA-B (13, 22). The Diabetes Prevention Program also reported evidence that weight loss and lifestyle intervention improved IR but not β-cell function evaluated by indices derived from a 30-minute oral glucose tolerance test (50). Our findings extend these prior investigations by evaluating how established risk factors independently relate to cross-sectional levels and change in levels of each IR and β-cell dysfunction.
Few prior studies have evaluated the heterogeneity of incident DM (13, 14). The San Antonio Heart Study, a cohort study of 1,734 middle-aged adults, classified 195 incident cases of DM arising during a 7-year follow-up period using fasting HOMA-IR and postload β-cell dysfunction at baseline (13). This analysis identified no significant associations of adiposity, triglycerides, HDL-C, or BP with DM cases preceded predominantly by β-cell dysfunction. Defining DM subtypes based on baseline IR and β-cell dysfunction precluded risk comparison and potentially caused selection bias as well as reverse causation.
Potential limitations deserve discussion. Our longitudinal analyses projected an unusual shape of the cumulative incidence curve because fasting and 2-hour postload glucose measurements for DM diagnosis were available at limited time-points. However, little bias due to DM diagnosis limited during specific years of follow-up is anticipated because our findings were robust against various definitions of DM diagnosis. Moreover, the availability of glucose measures is our strength compared with other epidemiologic studies in which DM was ascertained only by medication use, self-reported DM, or International Classification of Disease code. Residual confounding by unknown factors or poorly measured factors cannot be excluded. Although the CHS was a community-based cohort, generalizability to younger age groups or all race/ethnicities cannot be assumed. Misclassification of IR and β-cell dysfunction could occur because of imperfect measures of HOMA causing bias toward the null for cross-sectional associations and subclassification of incident DM. Another limitation is that despite the observed heterogeneous associations for different DM subtypes, it remains unclear whether different DM subtypes represent distinct biologic subtypes or rather are part of an overlapping continuum. As in any large cohort study, we were unable to subclassify incident DM by assessing IR and β-cell dysfunction immediately before diagnosis. Nevertheless, we could assess IR and β-cell dysfunction measured during follow-up, after baseline. These limitations inform directions of future research to characterize the heterogeneity of DM by assessing IR and β-cell dysfunction by HOMA and other measures derived from glucose tolerance tests and clamp tests.
In conclusion, risk factors for the onset of DM in older adults may differ depending on different etiologic variations of IR and β-cell dysfunction. Additional focus on these putative subtypes of DM is needed to better characterize the underlying biology and risk factors, as well as the potential clinical utility and implications for preventing DM.
Supplementary Material
ACKNOWLEDGMENTS
Author affiliations: Department of Epidemiology, Harvard School of Public Health, Boston, Massachusetts (Fumiaki Imamura, Dariush Mozaffarian); Division of General Medicine and Primary Care, Beth Israel Deaconess Medical Center, Boston, Massachusetts (Kenneth J. Mukamal); Harvard Medical School, Boston, Massachusetts (Kenneth J. Mukamal); General Medicine Division and Department of Medicine, Harvard Medical School, Boston, Massachusetts (James B. Meigs); Division of General Medicine, Columbia University Medical Center, New York, New York (José A. Luchsinger); Division of Nephrology, Department of Medicine, University of California, San Diego, California (Joachim H. Ix); the Veterans Affairs San Diego Healthcare System, San Diego, California (Joachim H. Ix); Departments of Medicine and Epidemiology, Cardiovascular Health Research Unit, University of Washington, Seattle, Washington (David S Siscovick); and Division of Cardiovascular Medicine, Brigham and Women's Hospital and Harvard Medical School, Boston, Massachusetts (Dariush Mozaffarian).
This work was supported by the National Heart, Lung, and Blood Institute (NHLBI) (grant R01-HL085710 and American Recovery and Reinvestment Act 3R01-HL085710-03S1). The Cardiovascular Health Study was supported by contract numbers N01-HC-85079 through N01-HC-85086, N01-HC-35129, N01-HC-15103, N01-HC-55222, N01-HC-75150, N01-HC-45133, and grant numbers U01 HL080295, R01-HL-075366, and R01-HL-094555 from the NHLBI; R01-AG-023629, R01-AG-15928, R01-AG-20098, and AG-027058 from the National Institute on Aging; the University of Pittsburgh Claude D. Pepper Older Americans Independence Center grant P30-AG-024827; and the National Institute of Neurological Disorders and Stroke.
We thank the participating Cardiovascular Health Study investigators (see www.chs-nhlbi.org).
This work was presented in part at the American Heart Association Epidemiology and Prevention/Nutrition, Physical Activity and Metabolism 2012 Scientific Sessions, March 13–16, 2012, San Diego, California, and presented in abstract form (Circulation. 2012;125(suppl):A008).
D.M. reported receiving research support from GlaxoSmithKline, Sigma Tau, and Pronova for a trial of fish oil and post-surgical complications; ad hoc travel reimbursement and/or honoraria for research presentations from Aramark, Unilever, SPRIM, and Nutrition Impact; ad hoc consulting fees from Foodminds and McKinsey Health Systems Institute; and royalties from UpToDate. The other authors report no conflicts.
REFERENCES
- 1.American Diabetes Association. Diagnosis and classification of diabetes mellitus. Diabetes Care. 2011;34(suppl 1):S62–S69. doi: 10.2337/dc11-S062. [DOI] [PMC free article] [PubMed] [Google Scholar]
- 2.Nathan DM, Buse JB, Davidson MB, et al. Medical management of hyperglycemia in type 2 diabetes: a consensus algorithm for the initiation and adjustment of therapy. Diabetes Care. 2009;32(1):193–203. doi: 10.2337/dc08-9025. [DOI] [PMC free article] [PubMed] [Google Scholar]
- 3.Heine RJ, Diamant M, Mbanya JC, et al. Management of hyperglycaemia in type 2 diabetes: the end of recurrent failure? BMJ. 2006;333(7580):1200–1204. doi: 10.1136/bmj.39022.462546.80. [DOI] [PMC free article] [PubMed] [Google Scholar]
- 4.Wilson PW, Meigs JB, Sullivan L, et al. Prediction of incident diabetes mellitus in middle-aged adults: the Framingham Offspring Study. Arch Intern Med. 2007;167(10):1068–1074. doi: 10.1001/archinte.167.10.1068. [DOI] [PubMed] [Google Scholar]
- 5.Song Y, Manson JE, Tinker L, et al. Insulin sensitivity and insulin secretion determined by homeostasis model assessment and risk of diabetes in a multiethnic cohort of women. Diabetes Care. 2007;30(7):1747–1752. doi: 10.2337/dc07-0358. [DOI] [PMC free article] [PubMed] [Google Scholar]
- 6.Haffner SM, Kennedy E, Gonzalez C, et al. A prospective analysis of the HOMA model. The Mexico City Diabetes Study. Diabetes Care. 1996;19(10):1138–1141. doi: 10.2337/diacare.19.10.1138. [DOI] [PubMed] [Google Scholar]
- 7.Lorenzo C, Wagenknecht LE, D'Agostino RB, et al. Insulin resistance, β-cell dysfunction, and conversion to type 2 diabetes in a multiethnic population. Diabetes Care. 2010;33(1):67–72. doi: 10.2337/dc09-1115. [DOI] [PMC free article] [PubMed] [Google Scholar]
- 8.Pradhan AD, Manson JE, Meigs JB, et al. Insulin, proinsulin, proinsulin:insulin ratio, and the risk of developing type 2 diabetes mellitus in women. Am J Med. 2003;114(6):438–444. doi: 10.1016/s0002-9343(03)00061-5. [DOI] [PubMed] [Google Scholar]
- 9.Lillioja S, Mott DM, Spraul M, et al. Insulin resistance and insulin secretory dysfunction as precursors of non-insulin-dependent diabetes mellitus: prospective studies of Pima Indians. N Engl J Med. 1993;329(27):1988–1992. doi: 10.1056/NEJM199312303292703. [DOI] [PubMed] [Google Scholar]
- 10.Bonora E, Kiechl S, Willeit J, et al. Population-based incidence rates and risk factors for type 2 diabetes in white individuals. Diabetes. 2004;53(7):1782–1789. doi: 10.2337/diabetes.53.7.1782. [DOI] [PubMed] [Google Scholar]
- 11.Hanley AJ, D'Agostino R, Jr, Wagenknecht LE, et al. Increased proinsulin levels and decreased acute insulin response independently predict the incidence of type 2 diabetes in the Insulin Resistance Atherosclerosis Study. Diabetes. 2002;51(4):1263–1270. doi: 10.2337/diabetes.51.4.1263. [DOI] [PubMed] [Google Scholar]
- 12.Tabák AG, Jokela M, Akbaraly TN, et al. Trajectories of glycaemia, insulin sensitivity, and insulin secretion before diagnosis of type 2 diabetes: an analysis from the Whitehall II Study. Lancet. 2009;373(9682):2215–2221. doi: 10.1016/S0140-6736(09)60619-X. [DOI] [PMC free article] [PubMed] [Google Scholar]
- 13.Haffner SM, Mykkanen L, Festa A, et al. Insulin-resistant prediabetic subjects have more atherogenic risk factors than insulin-sensitive prediabetic subjects: implications for preventing coronary heart disease during the prediabetic state. Circulation. 2000;101(9):975–980. doi: 10.1161/01.cir.101.9.975. [DOI] [PubMed] [Google Scholar]
- 14.Birkeland KI, Kilhovd B, Thorsby P, et al. Heterogeneity of non-insulin-dependent diabetes expressed as variability in insulin sensitivity, β-cell function and cardiovascular risk profile. Diabet Med. 2003;20(1):37–45. doi: 10.1046/j.1464-5491.2003.00838.x. [DOI] [PubMed] [Google Scholar]
- 15.Meneilly GS, Elliott T, Tessier D, et al. NIDDM in the elderly. Diabetes Care. 1996;19(12):1320–1325. doi: 10.2337/diacare.19.12.1320. [DOI] [PubMed] [Google Scholar]
- 16.Haffner SM, Miettinen H. Insulin resistance implications for type II diabetes mellitus and coronary heart disease. Am J Med. 1997;103(2):152–162. doi: 10.1016/s0002-9343(97)00027-2. [DOI] [PubMed] [Google Scholar]
- 17.Haffner SM, D'Agostino R, Mykkänen L, et al. Insulin sensitivity in subjects with type 2 diabetes. Relationship to cardiovascular risk factors: the Insulin Resistance Atherosclerosis Study. Diabetes Care. 1999;22(4):562–568. doi: 10.2337/diacare.22.4.562. [DOI] [PubMed] [Google Scholar]
- 18.Mykkanen L, Haffner SM, Ronnemaa T, et al. Low insulin sensitivity is associated with clustering of cardiovascular disease risk factors. Am J Epidemiol. 1997;146(4):315–321. doi: 10.1093/oxfordjournals.aje.a009272. [DOI] [PubMed] [Google Scholar]
- 19.Hanley AJ, Williams K, Stern MP, et al. Homeostasis model assessment of insulin resistance in relation to the incidence of cardiovascular disease. Diabetes Care. 2002;25(7):1177–1184. doi: 10.2337/diacare.25.7.1177. [DOI] [PubMed] [Google Scholar]
- 20.Festa A, Hanley AJG, Tracy RP, et al. Inflammation in the prediabetic state is related to increased insulin resistance rather than decreased insulin secretion. Circulation. 2003;108(15):1822–1830. doi: 10.1161/01.CIR.0000091339.70120.53. [DOI] [PubMed] [Google Scholar]
- 21.Ferrannini E, Balkau B, Coppack SW, et al. Insulin resistance, insulin response, and obesity as indicators of metabolic risk. J Clin Endocrinol Metab. 2007;92(8):2885–2892. doi: 10.1210/jc.2007-0334. [DOI] [PubMed] [Google Scholar]
- 22.Diabetes Prevention Program Research Group. Lipid, lipoproteins, C-reactive protein, and hemostatic factors at baseline in the diabetes prevention program. Diabetes Care. 2005;28(10):2472–2479. doi: 10.2337/diacare.28.10.2472. [DOI] [PMC free article] [PubMed] [Google Scholar]
- 23.Ferrannini E, Camastra S, Gastaldelli A, et al. Beta-cell function in obesity. Diabetes. 2004;53(suppl 3):S26–S33. doi: 10.2337/diabetes.53.suppl_3.s26. [DOI] [PubMed] [Google Scholar]
- 24.Hanley AJ, Wagenknecht LE, D'Agostino RB, Jr, et al. Identification of subjects with insulin resistance and beta-cell dysfunction using alternative definitions of the metabolic syndrome. Diabetes. 2003;52(11):2740–2747. doi: 10.2337/diabetes.52.11.2740. [DOI] [PubMed] [Google Scholar]
- 25.Iozzo P, Beck-Nielsen H, Laakso M, et al. Independent influence of age on basal insulin secretion in nondiabetic humans. J Clin Endocrinol Metab. 1999;84(3):863–868. doi: 10.1210/jcem.84.3.5542. [DOI] [PubMed] [Google Scholar]
- 26.Chen C-H, Tsai S-T, Chou P. Correlation of fasting serum C-peptide and insulin with markers of metabolic syndrome-X in a homogeneous Chinese population with normal glucose tolerance. Int J Cardiol. 1999;68(2):179–186. doi: 10.1016/s0167-5273(98)00366-0. [DOI] [PubMed] [Google Scholar]
- 27.Yudkin JS, May M, Elwood P, et al. Concentrations of proinsulin like molecules predict coronary heart disease risk independently of insulin: prospective data from the Caerphilly Study. Diabetologia. 2002;45(3):327–336. doi: 10.1007/s00125-001-0756-7. [DOI] [PubMed] [Google Scholar]
- 28.Oh J-Y, Barrett-Connor E, Wedick NM. Sex differences in the association between proinsulin and intact insulin with coronary heart disease in nondiabetic older adults: the Rancho Bernardo Study. Circulation. 2002;105(11):1311–1316. doi: 10.1161/hc1102.105565. [DOI] [PubMed] [Google Scholar]
- 29.Rönnemaa T, Laakso M, Puukka P, et al. Atherosclerotic vascular disease in middle-aged, insulin-treated, diabetic patients. Association with endogenous insulin secretion capacity. Arterioscler Thromb Vasc Biol. 1988;8(3):237–244. doi: 10.1161/01.atv.8.3.237. [DOI] [PubMed] [Google Scholar]
- 30.Reaven GM, Chen YD, Hollenbeck CB, et al. Plasma insulin, C-peptide, and proinsulin concentrations in obese and nonobese individuals with varying degrees of glucose tolerance. J Clin Endocrinol Metab. 1993;76(1):44–48. doi: 10.1210/jcem.76.1.8421101. [DOI] [PubMed] [Google Scholar]
- 31.Yudkin JS, Denver AE, Mohamed-Ali V, et al. The relationship of concentrations of insulin and proinsulin-like molecules with coronary heart disease prevalence and incidence. A study of two ethnic groups. Diabetes Care. 1997;20(7):1093–1100. doi: 10.2337/diacare.20.7.1093. [DOI] [PubMed] [Google Scholar]
- 32.Fritsche A, Madaus A, Stefan N, et al. Relationships among age, proinsulin conversion, and β-cell function in nondiabetic humans. Diabetes. 2002;51(suppl 1):S234–S239. doi: 10.2337/diabetes.51.2007.s234. [DOI] [PubMed] [Google Scholar]
- 33.Fried LP, Borhani NO, Enright P, et al. The cardiovascular health study: design and rationale. Ann Epidemiol. 1991;1(3):263–276. doi: 10.1016/1047-2797(91)90005-w. [DOI] [PubMed] [Google Scholar]
- 34.Psaty BM, Lee M, Savage PJ, et al. Assessing the use of medications in the elderly: methods and initial experience in the Cardiovascular Health Study. The Cardiovascular Health Study Collaborative Research Group. J Clin Epidemiol. 1992;45(6):683–692. doi: 10.1016/0895-4356(92)90143-b. [DOI] [PubMed] [Google Scholar]
- 35.Ives DG, Fitzpatrick AL, Bild DE, et al. Surveillance and ascertainment of cardiovascular events. The Cardiovascular Health Study. Ann Epidemiol. 1995;5(4):278–285. doi: 10.1016/1047-2797(94)00093-9. [DOI] [PubMed] [Google Scholar]
- 36.Biggs ML, Mukamal KJ, Luchsinger JA, et al. Association between adiposity in midlife and older age and risk of diabetes in older adults. JAMA. 2010;303(24):2504–2512. doi: 10.1001/jama.2010.843. [DOI] [PMC free article] [PubMed] [Google Scholar]
- 37.Cushman M, Cornell ES, Howard PR, et al. Laboratory methods and quality assurance in the Cardiovascular Health Study. Clin Chem. 1995;41(2):264–270. [PubMed] [Google Scholar]
- 38.Wallace TM, Levy JC, Matthews DR. Use and abuse of HOMA modeling. Diabetes Care. 2004;27(6):1487–1495. doi: 10.2337/diacare.27.6.1487. [DOI] [PubMed] [Google Scholar]
- 39.Festa A, Williams K, Hanley AJG, et al. β-cell dysfunction in subjects with impaired glucose tolerance and early type 2 diabetes. Diabetes. 2008;57(6):1638–1644. doi: 10.2337/db07-0954. [DOI] [PubMed] [Google Scholar]
- 40.Herzberg-Schäfer SA, Staiger H, Heni M, et al. Evaluation of fasting state-/oral glucose tolerance test-derived measures of insulin release for the detection of genetically impaired β-cell function. PLoS One. 2010;5(12):e14194. doi: 10.1371/journal.pone.0014194. [DOI] [PMC free article] [PubMed] [Google Scholar]
- 41.Meigs JB, Rutter MK, Sullivan LM, et al. Impact of insulin resistance on risk of type 2 diabetes and cardiovascular disease in people with metabolic syndrome. Diabetes Care. 2007;30(5):1219–1225. doi: 10.2337/dc06-2484. [DOI] [PubMed] [Google Scholar]
- 42.Mozaffarian D, Kamineni A, Carnethon M, et al. Lifestyle risk factors and new-onset diabetes mellitus in older adults: the cardiovascular health study. Arch Intern Med. 2009;169(8):798–807. doi: 10.1001/archinternmed.2009.21. [DOI] [PMC free article] [PubMed] [Google Scholar]
- 43.Geffken DF, Cushman M, Burke GL, et al. Association between physical activity and markers of inflammation in a healthy elderly population. Am J Epidemiol. 2001;153(3):242–250. doi: 10.1093/aje/153.3.242. [DOI] [PubMed] [Google Scholar]
- 44.Kumanyika S, Tell GS, Fried L, et al. Picture-sort method for administering a food frequency questionnaire to older adults. J Am Diet Assoc. 1996;96(2):137–144. doi: 10.1016/S0002-8223(96)00042-9. [DOI] [PubMed] [Google Scholar]
- 45.Pepe MS, Anderson GL. A cautionary note on inference for marginal regression models with longitudinal data and general correlated response data. Commun Stat Simul Comp. 1994;23(4):939–951. [Google Scholar]
- 46.Lunn M, Don M. Applying Cox regression to competing risks. Biometrics. 1995;51(2):524–532. [PubMed] [Google Scholar]
- 47.Pietropaolo M, Barinas-Mitchell E, Pietropaolo SL, et al. Evidence of islet cell autoimmunity in elderly patients with type 2 diabetes. Diabetes. 2000;49(1):32–38. doi: 10.2337/diabetes.49.1.32. [DOI] [PubMed] [Google Scholar]
- 48.Listenberger LL, Han X, Lewis SE, et al. Triglyceride accumulation protects against fatty acid-induced lipotoxicity. Proc Natl Acad Sci U S A. 2003;100(6):3077–3082. doi: 10.1073/pnas.0630588100. [DOI] [PMC free article] [PubMed] [Google Scholar]
- 49.Knowler WC, Barrett-Connor E, Fowler SE, et al. Reduction in the incidence of type 2 diabetes with lifestyle intervention or metformin. N Engl J Med. 2002;346(6):393–403. doi: 10.1056/NEJMoa012512. [DOI] [PMC free article] [PubMed] [Google Scholar]
- 50.Kitabchi AE, Temprosa M, Knowler WC, et al. Role of insulin secretion and sensitivity in the evolution of type 2 diabetes in the Diabetes Prevention Program: effects of lifestyle intervention and metformin. Diabetes. 2005;54(8):2404–2414. doi: 10.2337/diabetes.54.8.2404. [DOI] [PMC free article] [PubMed] [Google Scholar]
Associated Data
This section collects any data citations, data availability statements, or supplementary materials included in this article.