

Abstract
Non-rapid eye movement sleep (NREMS) onset is characterized by a reduction in cerebral metabolism and an increase in slow waves, 1–4-Hz oscillations between relatively depolarized and hyperpolarized states in the cerebral cortex. The metabolic consequences of slow-wave activity (SWA) at the cellular level remain uncertain. We sought to determine whether SWA modulates the rate of glycolysis within the cerebral cortex. The real-time measurement of lactate concentration in the mouse cerebral cortex demonstrates that it increases during enforced wakefulness. In spontaneous sleep/wake cycles, lactate concentration builds during wakefulness and rapid eye movement sleep and declines during NREMS. The rate at which lactate concentration declines during NREMS is proportional to the magnitude of electroencephalographic (EEG) activity at frequencies of <10 Hz. The induction of 1-Hz oscillations, but not 10-Hz oscillations, in the electroencephalogram by optogenetic stimulation of cortical pyramidal cells during wakefulness triggers a decline in lactate concentration. We conclude that cerebral SWA promotes a decline in the rate of glycolysis in the cerebral cortex. These results demonstrate a cellular energetic function for sleep SWA, which may contribute to its restorative effects on brain function.
Keywords: delta power, electroencephalogram, glycolysis, insomnia, optogenetic
Introduction
Sleep has long been posited to have restorative effects on brain function. These restorative effects are manifested by improved vigilance (Belenky et al. 2003), homeostatic changes in neuronal excitability (Liu et al. 2010), and changes in neurotransmitter release (Dash et al. 2009) occurring as a result of sleep subsequent to enforced wakefulness. However, the biochemical basis for these putative restorative effects has remained elusive. Neuronal excitation is an energy intensive process (Attwell and Laughlin 2001; Buzsaki et al. 2007; Alle et al. 2009). The maintenance of the ion concentration gradients that are necessary for neuronal excitability requires a continuous supply of adenosine triphosphate (ATP) to support membrane ion pumps. Cerebral cortical cells undergo periods of quiescence lasting up to several hundred milliseconds in association with non-rapid eye movement sleep (NREMS) slow-wave activity (SWA; Destexhe et al. 1999; Mukovski et al. 2007; Vyazovskiy, Olcese et al. 2009; Nir et al. 2011). These transient “down states” may have metabolic implications.
A reduction in the rate of cerebral glucose metabolism during NREMS relative to wakefulness is a reliable finding in positron emission tomography (PET) studies on human subjects. The estimates of the reduction in cerebral glucose metabolism during NREMS relative to wakefulness vary from 12% (Heiss et al. 1985) to 44% (Maquet 1995). This change does not reflect a reduced supply of glucose in the brain during NREMS. During sleep, blood glucose remains slightly higher than average daytime between-meal levels (Biston et al. 1996) and glucose concentration increases in the brain parenchyma relative to wakefulness (Netchiporouk et al. 2001). Therefore, the reduction in brain glucose metabolism, as measured by 2-deoxyglucose uptake in PET scans, is due to reduced demand for glucose as a function of sleep.
The simultaneous surge in ATP availability in the brain (Dworak et al. 2010) and decrease in glucose utilization (Kennedy et al. 1982; Heiss et al. 1985; Maquet 1995; Netchiporouk et al. 2001) during NREMS may be explained, in part, by a shift in cerebral metabolism from aerobic glycolysis to oxidative phosphorylation during NREMS. Several reports describe the use of enzymatic sensors to measure fluctuations of lactate concentration in the brain in real time (Hu and Wilson 1997; Shram et al. 2002; Burmeister et al. 2005). We have utilized this approach to demonstrate a previously undescribed relationship between NREMS SWA and aerobic glycolysis. When the electroencephalography (EEG) is desynchronized (during wakefulness and rapid eye movement sleep), lactate concentration builds. When the EEG is synchronized during NREMS or through optogenetic manipulations of cortical neuronal activity, lactate concentration declines. These experiments demonstrate a robust temporal relationship between lactate concentration and SWA in the cerebral cortex.
Materials and Methods
Experimental Subjects
The experimental subjects were mice derived from the B6.Cg-Tg(Thy1-COP4/eYFP)18Gfng/J transgenic line (JAX strain #7612; Arenkiel et al. 2007). In these mice, the “mouse thymus cell antigen 1 (thy1)” promoter drives the expression of a transgene construct containing the blue-light-sensitive cation channel, Channelrhodopsin-2, and enhanced yellow fluorescent protein. The Channelrhodopsin-2 cation channel is expressed in cerebral cortical pyramidal neurons (Arenkiel et al. 2007), allowing for optogenetic manipulation of the cerebral cortex EEG. Founder mice from JAX, which are on a C57BL/6 background, were bred to CD1 mice at Washington State University to increase the fecundity and size of the offspring. The mice used in experiments were B6.Cg-Tg(Thy1-COP4/eYFP)18Gfng/J X CD1 F1 males. Mice were kept on a 12:12 light:dark (LD) cycle with a temperature set point of 24.5°C and had unrestricted access to food and water throughout experimentation. All experimentation was approved by the Institutional Animal Care and Use Committee of Washington State University and adhered to the National Research Council Guide for the Care and Use of Laboratory Mice (Institute of Laboratory Animal Resources NRC 1996).
Surgical Implantation of Biosensors
Electroencephalogram, electromyogram (EMG), and cerebral cortex lactate concentration were monitored simultaneously with a commercially available biosensor system (Pinnacle Technology, Inc., Lawrence, KS, United States of America; product #8400-K1-SLl). Mice were surgically implanted under isoflurane anesthesia (5% induction, 1–3% maintenance) with a headmount (Pinnacle Technologies part # 8402, Lawrence, KS, United States of America) composed of a plastic 6-pin connector glued to a printed circuit board (PCB). Four stainless steel screws were fastened to the skull. Two frontal screws were placed 1.5 mm lateral to the midline and 1 mm anterior to the bregma. The left anterior screw served as an internal ground. Two parietal screws were placed 1.5 mm lateral to the midline and 2 mm anterior to the lambda. The wires connected to these screws were soldered to a tin/lead interface integrated into the PCB, which then conducted to the 6-pin connector at the top of the headmount.
Two channels of EEG data were collected, one conveying the potential between 2 parietal leads (channel 1), and the other the potential between parietal and frontal leads (channel 2). Channel 2 was used for state classification and EEG power spectral analysis. The 2 EMG electrodes consisted of stainless steel wires, 1.5 cm in length, attached to the PCB on one end, and terminating in a bolus of epoxy (roughly 1-mm diameter) at the other end. An insulating material was absent from ∼2 mm of stainless steel immediately next to the bolus of epoxy; this exposed stainless steel served as the lead and was embedded in the neck musculature. The headmount was secured to the skull and sealed with Ortho-Jet self-curing acrylic resin (Lang Dental Manufacturing Co.). The incision on the head and neck was closed with an Ethilon 5-0 nylon monofilament non-absorbable suture (Ethicon, NJ, United States of America). The female contacts on the connector remained uncovered by the composite and skin.
During the same surgery, 2 holes ∼0.7 mm in diameter were drilled through the skull bilaterally 1.1 mm anterior and 1.65 mm lateral from the bregma. Twenty-one-gauge guide cannulas (Plastics One part #C312GSPC), length 5.0 mm, were placed in these holes and secured to the skull, with their tips resting on the surface of the frontal cortex. The left cannula served as a guide cannula for the insertion of lactate biosensor. The right cannula served as a guide cannula for optogenetic fiber insertion. Mice were monitored closely following surgery until they were ambulatory. Buprenorphine was administered as an analgesic (0.05 mg/kg subcutaneous) at the end of surgery and for 3 subsequent days.
Amperometric Lactate Detection
Real-time lactate measurements in the cerebral cortex utilized an enzyme-based amperometric biosensor (Burmeister et al. 2005; Naylor et al. 2011). The working electrode (Pinnacle technologies part #7004-Lactate) was a polytetrafluoroethylene (PFTE; “Teflon”)-coated 90% platinum–10% iridium (Pt–Ir) wire 9 mm in length (Naylor et al. 2011). When inserted into the intracranial guide cannula, the wire protruded 1 mm from the end of the guide cannula into the cerebral cortex. The distal 1 mm of the Pt–Ir surface was free of PFTE and thus served as the sensing interface when embedded in the cerebral cortex. A Cl−-charged Ag wire wrapped concentrically around the Pt–Ir wire served as the reference electrode. The working and reference electrodes were embedded in the concentric layers of Nafion and cellulose acetate. A layer of lactate oxidase was affixed to the cellulose acetate by dipping the sensor in a lactate oxidase/bovine serum albumin/glutaraldehyde solution followed by dehydration. When installed in an aqueous environment and exposed to lactate, lactate oxidase converts lactate and molecular oxygen to H2O2. Nafion and cellulose acetate resist anion penetration but allow the passage of H2O2 to the Pt–Ir surface. H2O2 undergoes an oxidation/reduction reaction on the Pt–Ir surface, resulting in the generation of current fluctuations in the Pt–Ir electrode. Previously published work (Hu and Wilson 1997; Burmeister et al. 2005; Naylor et al. 2011) demonstrated that biologically plausible levels of ascorbic acid, dihydroxyphenylacetic acid, dopamine, serotonin, norepinephrine, homovanillic acid, methoxy-4-hydroxyphenylglycol, 5-hydroxyindoleacetic acid, l-tyrosine, l-cysteine, l-tryptophan, glutathione, uric acid, and catalase do not interfere with substrate detection by this type of enzymatic biosensor. The sensor has a lifetime of >3 days in vivo according to manufacturer specifications (Pinnacle Technologies; part #8403). The data collection in the current study occurred over <48 h.
Calibration of the Lactate Sensor
The sensitivity of the biosensor to lactate was verified by in vitro calibration immediately prior to insertion in the brain. The calibration was performed by immersion in a jacketed beaker containing 20 mL of 100 mM phosphate buffered saline (PBS) and warmed by circulating water at a set point of 37°C. The PBS solution was kept in motion with a stir bar. The sensor was subjected to stepwise titration in 25, 50, and 75 mM l-lactate over an interval of ∼5 min. Each step in the concentration was marked in the data collection file by the user.
The lactate sensor was inserted into the cerebral cortex immediately after in vitro calibration. Current detected at the lactate sensor was averaged across each 10-s epoch of the data collection. The visual inspection of lactate sensor data indicated the presence of artifact, or data dropout in a small number of epochs. An artifact was algorithmically eliminated from the lactate data. Any data point that deviated from the average of the 10 data points immediately preceding that data point by >10 standard deviations was recoded as the average of the 10 data points immediately preceding that data point. This algorithm recoded <1% of all data points within any given data file.
Optogenetic Stimulation of Pyramidal Cortical Neurons
A rodent optogenetic stimulation system was designed to manipulate the electrical activity of pyramidal neurons in the cerebral cortex with millisecond precision and to measure the effects of such manipulations on the EEG and cerebral cortical lactate concentration. The system was designed and constructed based on the prior literature (Adamantidis et al. 2007; Aravanis et al. 2007; Arenkiel et al. 2007; Gradinaru et al. 2007; Zhang et al. 2009). A transistor–transistor logic circuit with 0–5 V modulation controlled the timing of a variable output power source. The power source supplied timed pulses of electricity to a diode-pumped solid-state blue-light laser (BCL-050-M, 50 mW, Crystalaser). The light was transmitted through a FC/PC fiber optic coupling adaptor and mounted coupling lens, including a 2-m length, 200-μm diameter polyvinyl chloride-jacketed fiber patchcord. A fiber optic rotary joint (Doric Lenses Inc. #FRJ_FC-FC) then directed the light into a 200-μm fiber optic probe (Thorlabs, Inc., Small Animal Fiber Optic Kit) with a flat cleaved projecting end. The fiber optic cable was inserted into the mouse's skull through a 21-gauge guide cannula (Plastics One, Inc.). The fiber optic probe was secured in the guide cannula by a screw cap screwed onto threads at the external end of the guide cannula. The end of the fiber protruded from the guide cannula 1 mm below the dura. The intensity of light applied to the cerebral cortex of each mouse was adjusted in real time (i.e. during the first stimulation session), from a zero-intensity stimulus to an intensity sufficient to increase the amplitude of the EEG by a visually estimated 50%. The intensity necessary for this degree of responsiveness was typically 80–100 μW, an amount sufficient to induce spiking in cortical neurons in Channelrhodopsin-2 transgenic mice but not sufficient to cause tissue damage (Aravanis et al. 2007; Zhang et al. 2009).
The optogenetic stimulation parameters were established with a set of animals (n= 9 CD1XB6.Cg-Tg(Thy1-COP4/eYFP)18Gfng/J males) instrumented for bilateral fronto-parietal EEGs without lactate sensors. Data from these animals are presented in Figures 4 and 5; data from animals subjected to optogenetic stimulation during EEG/EMG/lactate measurements described above are presented in Figures 6 and 7. EEG effects of optogenetic stimulation were measured in bilateral EEG studies in 2 ways. First, each EEG was subjected to fast Fourier transform using an algorithm embedded in the Neuroscore 2.01 EEG processing software (Wisor and Clegern 2011; Wisor, Schmidt et al. 2011). EEG spectral power across 20 frequency bins in the 0.5–20 Hz range (0.5–1 Hz as 1 bin and 1-Hz bins thereafter) was subjected to repeated-measures ANOVA with stimulus intensity and EEG frequency as within-subjects measures. Secondly, optogenetically induced EEG wave dynamics were assessed by plotting event-triggered EEG traces derived from 10-s segments of EEG potential data processed at 500 Hz. The triggering event was a 40-ms depth-positive/surface-negative hyperpolarizing train. Such trains were identified as sequences of 20 EEG potential values (i.e. 40 ms when data are collected at 500 Hz) in which the EEG potential declined across 19 of the twenty 2-ms intervals. One-second segments of data, including the hyperpolarizing train, the 100 data points preceding it and the 380 data points following it, were used to calculate average event-triggered waves across 10-s EEG traces. These averaged traces were subjected to repeated-measures ANOVA with frequency of stimulation as a grouping factor and time relative to stimulation as a within-subjects measure.
Figure 4.

Optogenetic manipulation of the cerebral cortical electroencephalogram in Thy1/ChR2-eGFP transgenic mice. (A and C) A 2-min bilateral EEG recording demonstrates the effect of 10-Hz stimulation with 1.2-mW blue light on the waking EEG recorded contralaterally (A) and ipsilaterally (C) to the fiber optic probe. The 10-s application of the 10 Hz stimulus began 1-min into the 2-min recording. (B and D) Intensity-response curve for the effects of 10-Hz stimuli on EEG power spectra contralateral (B) and ipsilateral (D) to the stimulus. Insets show power in the 9–11 Hz range. Stimuli were delivered once per minute, during the first 10-s of the minute, at increasing intensities. (E) A 5-min EEG recording (upper panel) from the side ipsilateral to the fiber optic stimulus demonstrates an intensity-proportionate response to 10-Hz stimulation at increasing light intensities (lower panel). (F and G) Sixty-min EEG recordings from EEGs ipsilateral to a fiber optic stimulus probe demonstrate sustained responsiveness to continuous optogenetic stimulation. The mouse was subjected to a 30-min interval of continuous optogenetic stimulation at 10 Hz (F) or 1 Hz (G). The timing of stimulation is indicated by the bar at the base of the figure.
Figure 5.

Averaged event-triggered EEG traces from the hemisphere contralateral to the optogenetic stimulus. Open symbols with gray error bars denote the effect of a 10-Hz stimulus. Closed symbols with gray error bars denote the effect of a 1-Hz stimulus. Black bars at the base of the graph denote times when the 2 traces were statistically significantly different by Student's t-test (corrected to P < 0.0001).
Figure 6.

Continuity of sleep states during optogenetic stimulation. Each panel contains 30-s traces of EEG contralateral to the optogenetic stimulating cannula (upper trace), EEG ipsilateral to the optogenetic stimulating cannula (middle trace), and EMG (lower trace). The cerebral cortex was subjected to 10-s trains of 1.5-ms blue light pulses at 10 Hz (A and B) or 1 Hz (C and D) administered during spontaneous sleep/wake cycles. The stimulus induces a bilateral EEG response without altering the state of vigilance, whether the stimulus is delivered during wakefulness (A and C) or NREMS (B and D).
Figure 7.

Effects of 1 Hz (A) or 10 Hz (B) optogenetic stimulation on EEG SWA (upper panels) and lactate concentration (lower panels). Each panel contains data from a 1-min interval. The first 30 s were spent in wakefulness and the last 30 s in optogenetic stimulation. P-values denote main effect of time on dependent variables. *P < 0.05 versus last epoch before stimulation, Student's t-test with Bonferroni correction.
Experimental Protocol and Data Collection
For simultaneous measurement of EEG, EMG, and relative lactate concentration, data collection commenced at least 10 days after surgery. Mice (n= 7 CD1XB6.Cg-Tg(Thy1-COP4/eYFP)18Gfng/J) were acclimated to the data collection environment, a cylindrical acrylic plastic cage with horizontal diameter of 25 cm and height 20 cm, overnight prior to data collection. Data collection was preceded by the insertion of the pre-calibrated lactate sensor, which required restraint of the animal in a hand towel and fixation of its head between the fingers of an experimenter for ∼1 min. Data collection began ∼3 h into the light phase of the 12:12 LD cycle. After a 24-h baseline data collection session, during which mice were allowed to sleep spontaneously, they were subjected to 3 h of sleep deprivation (SD). This SD session served 2 purposes. First, it served to measure the effect of sustained wakefulness on lactate concentration in the cerebral cortex. Secondly, it caused an need of increase in sleep, which was expected to increase the likelihood that animals would sleep during the subsequent hour, when animals underwent optogenetic manipulation of the cerebral cortex. Wakefulness was enforced by introduction of novel objects into the cage. At the end of SD, fiber optic probes were inserted into the right frontal guide cannula to a depth of 1 mm into the cerebral cortex. This manipulation required restraint of the animal in a hand towel and fixation of its head between the fingers of the experimenter for ∼1 min.
Beginning 15 min after insertion of the fiber optic light delivery cable into the cerebral cortex (i.e. 15 min after termination of SD), each animal was subjected to two 15-min optogenetic stimulation sessions. During these sessions, lactate, EEG, and EMG data were collected continuously. Blue-light pulses 1.5 ms in duration were administered to the cerebral cortex during the first 30-s of each minute, yielding a total of fifteen 30-s trains per session. The pulses were delivered at 10 Hz during one session and 1 Hz during the other session. The order of the 2 stimulation sessions was partially counterbalanced across animals (n= 4 1 Hz stimulation followed by 10 Hz stimulation; n= 3 10 Hz stimulation followed by 1 Hz stimulation). One minute after the end of the second of these 2 stimulation sessions, the experiment was terminated.
The data from the 3 epochs immediately prior to each 30-s stimulus train and the 3 epochs immediately subsequent to each 30-s stimulus train were subjected to state classification. Neither NREMS nor rapid eye movement sleep (REMS) occurred reliably across all 7 animals during optogenetic stimulation protocols. Therefore, only stimulus trains preceded by 3 epochs classified as wake and followed by 3 epochs classified as wake were subjected to statistical analysis. Lactate and EEG SWA values across the 3 epochs immediately prior to each stimulus train and during the 3 epochs of stimulation were normalized to the mean of their values across the 3 epochs immediately prior to each stimulus train. These values were subjected to repeated-measures ANOVA, with epoch number as a within-subjects measure.
Polysomnographic Data Processing
Lactate sensor current, EEG potentials, and EMG potentials from the 6-pin female headmount connector were fed into a PCB-based preamplifier (Part #8406-SL, Pinnacle Technology, Inc.) through a 6-pin connector. The preamplifier amplified signals by 100-fold and high-pass filtered EEG and EMG signals (0.5 and 10 Hz, respectively). Signals were conveyed via an output cable to a commutator (Part #8408, Pinnacle Technology, Inc.) and from there to a PC-based acquisition system (Pinnacle Technology, Inc.; Part #8401). Signals were further amplified 50-fold and sampled at 400 Hz. EEG and EMG potentials were processed as described previously (Wisor, Clegern et al. 2011). Potentials were processed for state classification and spectral analysis with Neuroscore 2.01 software (Data Sciences Inc., St Paul, MN, United States of America). The digitized EEG was bandpass filtered at 1–30 Hz. An integrated EMG was highpass filtered at 10 Hz. Data were processed in 10 s epochs, each of which was classified as wake, REMS or non-REMS (NREMS) by individuals trained in rodent sleep-state classification. Power spectral analysis of EEG data was performed by an algorithm embedded in the Neuroscore software. EEG power values were averaged in 1-Hz bins across each 10-s epoch of data.
State Transition Analyses of Relative Lactate Concentration, EEG SWA, and Integrated EMG
State transitions were defined as 6 consecutive 10-s epochs of one state followed immediately by 6 consecutive 10-s epochs of a distinct state. Theoretically, 6 types of transitions could exist: Wake-to-NREMS, wake-to-REMS, NREMS-to-wake, NREMS-to-REMS, REMS-to-wake, and REMS-to-NREMS. In practice, no 12-epoch sequence from any animal met the criteria for REMS-to-NREMS or wake-to-REMS transitions, so data were processed from only the other 4 transition types. Within each transition identified, relative lactate concentration was normalized to the average value of the first 6 epochs of the transition. EEG SWA (power in the 1–4 Hz range) and integrated EMG were processed as raw values. Normalized lactate, EEG SWA, and integrated EMG were averaged across all such transitions exhibited by each animal to generate an average curve representing each transition type for each animal. These average curves were subjected to repeated-measures ANOVA with epoch number as a within-subjects measure.
Relationship Between EEG Power During NREMS and Relative Lactate Concentration
We sought to determine whether power in specific EEG spectral ranges predicts the dynamics of lactate concentration during NREMS. We also sought to determine whether the strength of this predictive relationship would increase or decrease if prior EEG power dynamics, rather than current EEG power at the time of lactate measurement, is considered. Toward this end, all 1-min segments of continuous NREMS (i.e. 6 consecutive 10-s epochs classified as NREMS) were identified in each animal's data set. The relative lactate concentration was normalized to the average of all 6 epochs within each such segment. Within each segment, average EEG power was calculated in eighteen 3-Hz power spectral windows (0–3, 1–4, … 17–20 Hz). This calculation was made across the 6 epochs constituting the segment, then across the 1-min interval ending 10-s before the end of the segment, the 1-min interval ending 20-s before the end of the segment, etc. through the 1-min interval ending 60-s before the end of the segment. Thus, each 6-epoch sequence of normalized lactate concentration values derived from NREMS segments was associated with an 18 × 7 matrix of EEG power values, which varied according to the EEG spectra contributing to the power values (18 rows; 0–3, 1–4, … 17–20 Hz) and the timing of the 1-min interval from which the EEG power values were derived relative to the lactate values (7 columns; ending at time −60, −50, … 0 s relative to the NREMS segment from which lactate values were derived).
The relative lactate concentration data associated with the matrix generated for each animal were sorted iteratively based on the values at each locus in the matrix: NREMS segments were ranked according to the EEG power at a given matrix locus and separated into quartiles. Within each animal's data set, relative lactate concentration was then averaged on an epoch-by-epoch basis across all segments in the lowest quartile (the 25% of segments with lowest EEG power at that locus in the matrix) and all segments in the highest quartile (the 25% of segments with highest EEG power at that locus in the matrix). The difference in the slopes of these 2 average lactate concentration curves (one derived from the highest quartile of EEG power and one derived from the lowest quartile of EEG power) was computed and plotted as a heat map in Figure 3A. Average curves were subjected to repeated-measures ANOVA with epoch number within the NREMS segment (1–6) and quartile (lowest 25% vs. highest 25%) as within-subjects variables. The results of these ANOVAs represent the probability that the EEG power within a given spectral range at a given time relative to lactate measurement predicts the rate of lactate dissipation during NREMS segments.
Figure 3.
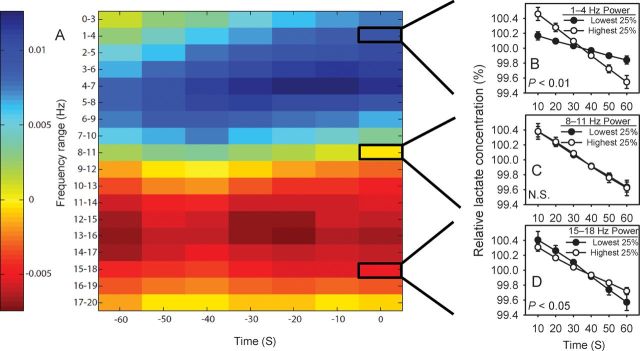
EEG power predicts the rate of decline of lactate concentration during NREMS. (A) A heat map indicates the magnitude of the effect of EEG power at each frequency bin × time window of the matrix on the rate of decline in lactate concentration across 1-min NREMS segments. Cold colors indicate a direct relationship between EEG power and the rate of decline in lactate concentration. Hot colors indicate an inverse relationship between EEG power and the rate of decline in lactate concentration. (B–D) Examples of the relationships between EEG power in 3 EEG frequency bins and relative lactate concentration. (B) The rate of decline of lactate concentration averaged across the 25% of 1-min segments with the highest EEG power in the 1–4 Hz range (white symbols) versus the 25% of 1-min segments with the lowest EEG power in the 1–4 Hz range (black symbols). (C) The rate of decline of lactate concentration averaged across the 25% of 1-min segments with the highest EEG power in the 8–11 Hz range (white symbols) versus the 25% of 1-min segments with the lowest EEG power in the 8–11 Hz range (black symbols). (D) The rate of decline of lactate concentration averaged across the 25% of 1-min segments with the highest EEG power in the 15–18 Hz range (white symbols) versus the 25% of 1-min segments with the lowest EEG power in the 15–18 Hz range (black symbols). P-values are those associated with EEG power × epoch interaction in repeated-measures ANOVA.
Results
Sleep Deprivation Increases Lactate Concentration in the Cerebral Cortex
In mice simultaneously instrumented for measurement of lactate-dependent current fluctuations (“relative lactate concentration” hereafter) and standard polysomnography, relative lactate concentration fluctuated by up to 35% over intervals <1 h. These fluctuations coincided with changes in sleep-state classification. A sample trace of current measured from a lactate sensor across 3 h of spontaneous sleep/wake (Fig. 1A) demonstrates state-dependent fluctuations: relative lactate concentration decreased during NREMS and increased during wake and REMS. The effects of SD confirm that wake drives an increase in lactate concentration: Relative lactate concentration increased in the cerebral cortex of 7 of 7 mice during a 3-h SD session (Fig. 1B). These data agree with previously published observations that SD increases brain lactate concentration (Van den Noort and Brine 1970; Kalinchuk et al. 2003; Wigren et al. 2009).
Figure 1.
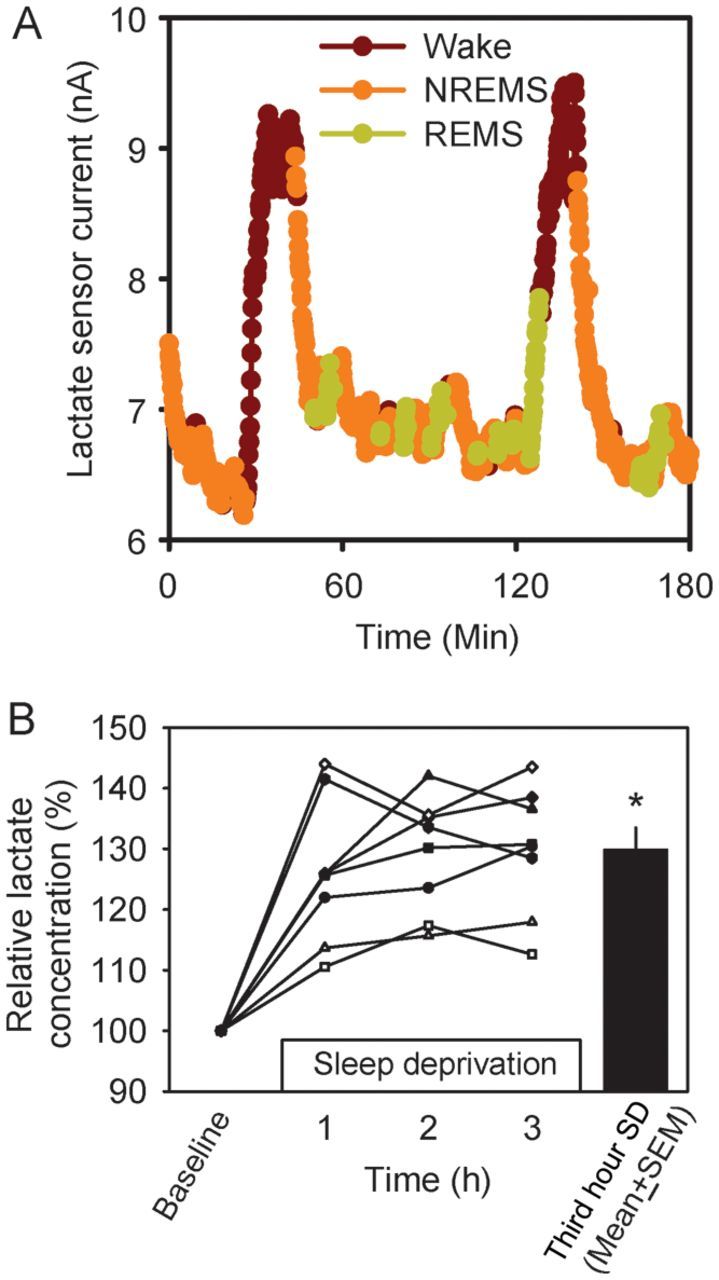
Cerebral cortex lactate concentration varies across sleep–wake states. (A) A sample trace of current measured by a lactate sensor across 3 h of spontaneous sleep/wake. Data are color coded according to the EEG-defined state. Data collected during wakefulness are shown in brown, NREMS in orange, and REMS in green. (B) The effect of 3-h SD on lactate concentration in the cerebral cortex. Each curve represents data from an individual mouse. Data are normalized to the baseline value measured during the hour immediately preceding the onset of SD. The black bar denotes mean + standard error of the mean (SEM) of group values during the third hour of SD. *P < 0.05 versus baseline, Student's t-test.
NREMS is Accompanied by a Decline in Cerebral Cortex Lactate Concentration
To document the relationship between sleep state and relative lactate concentration in spontaneous sleep/wake cycles, relative lactate concentration, EEG SWA, and integrated EMG were tracked within wake-to-NREMS transitions (Fig. 2A), NREMS-to-REMS transitions (Fig. 2B), NREMS-to-wake transitions (Fig. 2C), and REMS-to-wake transitions (Fig. 2D). EEG, EMG, and relative lactate concentration were all significantly affected by state across the wake-to-NREMS transitions. During wake-to-NREMS transitions (Fig. 2A), there was a significant increase in EEG SWA (main effect for state: F1,6= 18.22, P= 0.005) and a significant decrease in integrated EMG (main effect for state: F1,6= 198.81, P< 0.001). These EEG and EMG changes were expected, as they are the defining features of the sleep onset. They serve to validate the algorithm used to quantify moment-to-moment dynamics of physiological variables during state transitions. The relative lactate concentration decreased immediately at the NREMS onset (main effect for state: F1,6= 19.00, P= 0.005); within 30 s of NREMS onset, relative lactate concentration was significantly reduced relative to its level during wake just prior to the NREMS onset (Fig. 2A).
Figure 2.
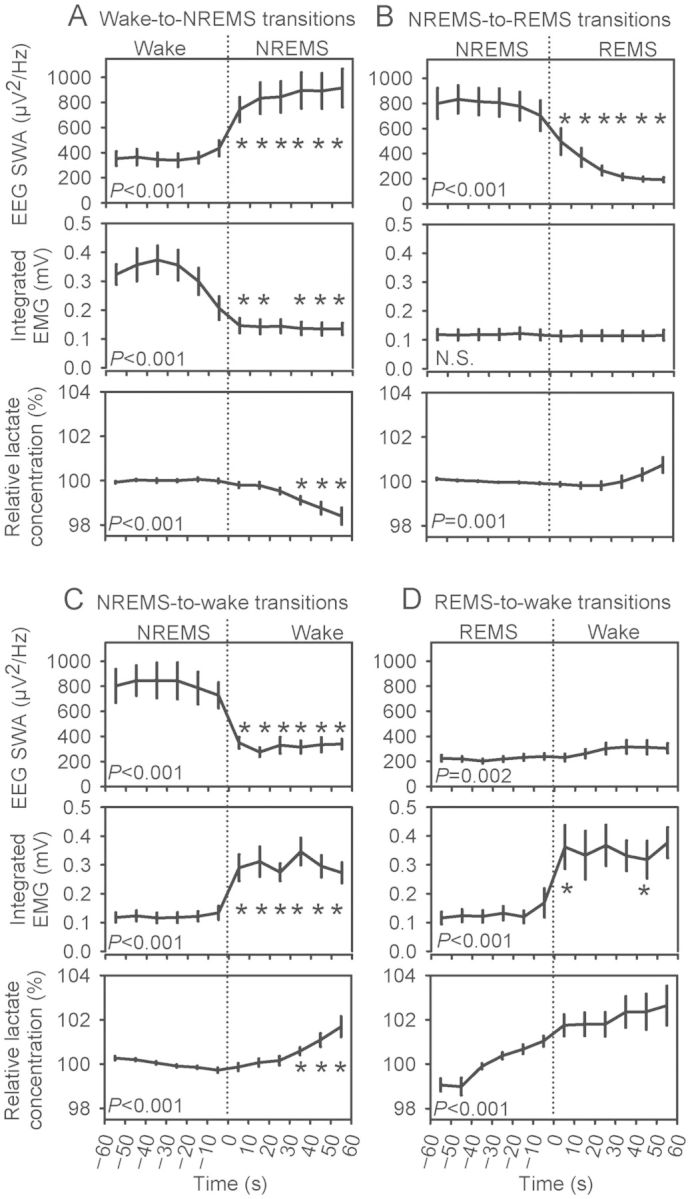
Lactate concentration decreases during NREMS and increases during wake and REMS. Data are from 2-min intervals characterized by state transitions. Transitions occurred at time 0: Wake-to-NREMS (A), NREMS-to-REMS (B), NREMS-to-wake (C), and REMS-to-wake (D). EEG SWA (upper panels) and integrated EMG (middle panels) are raw values; lactate concentration (lower panels) is normalized to the mean of the first 6 epochs within each transition. Variables were averaged across all such transitions exhibited by each animal. Group mean ± SEM of these averaged values are shown (n= 7 mice). P-values are those associated with main effect of time in repeated-measures ANOVA. *P < 0.05 versus last epoch before state transition, Student's t-test with Bonferroni correction.
During NREMS-to-REMS transitions (Fig. 2B), EEG SWA was affected by state (F1,6= 940.32, P< 0.001). EEG SWA declined at REMS onset. EMG was unaffected by state, time, or their interaction at REMS onset. Muscle tone was low before and after the NREMS-to-REMS transition. ANOVA yielded a significant main effect for time (Fig. 2B) and a significant interaction of state × time (F5,30= 6.86, P< 0.001) in affecting relative lactate concentration at the NREMS-to-REMS transition. While relative lactate concentration declined modestly during NREMS prior to transition, it began to rise after the first 30-s of REMS (Fig. 2B).
EEG, EMG, and relative lactate concentration all changed at wake onset, whether wake was preceded by NREMS (Fig. 2C) or REMS (Fig. 2D). EEG SWA decreased at wake onset after NREMS (main effect of state F1,6= 117.49, P< 0.001) and increased modestly at wake onset after REMS (F1,6= 25.06, P= 0.002). Integrated EMG increased at wake onset after REMS (main effect of state F1,6= 11.20, P= 0.015). Relative lactate concentration was greater during wake onset after either NREMS (main effect of state F1,6= 12.00, P= 0.014) or REMS (main effect of state F1,6= 8.45, P= 0.027). The state × time interaction was significant for lactate during NREMS-to-wake transitions (F5,30= 9.00, P< 0.001), but not REMS-to-wake transitions (P= 0.581). This difference between the 2 transition types reflects the fact that lactate declines during NREMS until the moment of waking (Fig. 2C), whereas lactate increases during REMS and subsequently continues to increase at wake onset (Fig. 2D). Collectively, these data establish that relative lactate concentration increases during wake and REMS (i.e. the desynchronized states characterized primarily by the absence of EEG slow waves) and decreases during NREMS, a state characterized by SWA in the EEG.
EEG Power in the Low Frequency Range Predicts the Rate of Decline in Lactate Concentration During NREMS
SWA is a feature unique to NREMS, and therefore might drive the decrease in lactate concentration that occurs during NREMS. We assessed the predictive value of EEG power during NREMS as a covariate of relative lactate concentration. All occurrences of 1 min of continuous NREMS (“segments”) were identified in 24-h spontaneous sleep recordings. For each such segment, a 126-point matrix was populated with EEG power values in each of 18 EEG spectral ranges across each of seven 1-min intervals relative to that segment (Fig. 3). The declining slope of lactate concentration across NREMS segments was interrogated against each point in this matrix. The heat map in Figure 3A indicates the magnitude and direction of the relationship between each EEG power/time locus in the matrix and the rate of decline of lactate concentration in the cerebral cortex during NREMS. The data demonstrate that EEG power in frequencies <10 Hz associates directly with the rate at which lactate concentration declines during NREMS. The rate of decline is greater during NREMS segments with high EEG power at frequencies <10 Hz relative to those NREMS segments with low EEG power at frequencies <10 Hz. For instance, the rate at which relative lactate concentration declines across the 25% of segments in which 1–4-Hz power is highest (“Highest 25%” in Fig. 3B) is greater than the rate at which relative lactate concentration declines across the 25% of segments in which 1–4-Hz power is lowest (“Lowest 25%” in Fig. 3B). ANOVA yielded a significant epoch × 1–4-Hz EEG power interaction affecting relative lactate concentration (F5,30= 22.53, P< 0.001; Fig. 3B). The rate of decline of relative lactate concentration was not significantly affected by EEG power in the 8–11 Hz range (F5,30= 0.11.53, P= 0.988; Fig. 3C). The relationship between EEG power and relative lactate concentration was inverted at EEG spectral frequencies >10 Hz. The rate at which relative lactate concentration declined across the 25% of segments in which 15–18-Hz power was lowest (Lowest 25% in Fig. 3D) was greater than the rate at which relative lactate concentration declined across the 25% of segments in which 15–18-Hz power was highest (Highest 25% in Fig. 3D). ANOVA yielded a significant epoch × 15–18-Hz EEG power interaction affecting relative lactate concentration (F5,30= 2.55, P= 0.049; Fig. 3B). These data are compatible with the concept that EEG oscillations drive changes in cortical lactate concentration. More specifically, slow EEG oscillations promote the decline in lactate concentration that occurs during NREMS, while faster oscillations attenuate this decline. The magnitude of EEG effects on lactate concentration was slightly higher when EEG power was calculated from 1-min windows 10–30 s prior to relative lactate concentration (Fig. 3A). Changes in lactate concentration measured at the sensor may therefore be an integrative measure of both prior and current neuronal activity.
Optogenetic Stimulation Causes Global EEG Changes
Optogenetic stimulation was used to manipulate the cerebral cortical EEG in Thy1/ChR2-eYFP transgenic mice. The application of blue light to the cerebral cortex via a fiber optic probe resulted in an increase in EEG power at the frequency of stimulation (Fig. 4). A 2-min bilateral EEG recording demonstrates the effect of a 10-s train of 10-Hz stimulation (1.5-ms pulse duration) with 1.2-mW blue light on the waking EEG-recorded contralateral (Fig. 4A) and ipsilateral (Fig. 4C) to the fiber optic probe. An intensity-response curve for blue-light stimulation was generated by 10-s application of the 10-Hz stimulus at 1-min intervals, during the first 10 s of every minute. A 5-min EEG recording from the hemisphere ipsilateral to the optogenetic stimulus demonstrated an intensity-proportionate response to 10-Hz stimulation at increasing light intensities (Fig. 4E). ANOVA yielded a significant stimulus intensity × EEG frequency interaction for both the ipsilateral (F76,2185= 89.83, P< 0.001) and contralateral (F76,2185= 27.30, P< 0.001) EEGs, although the intensity-response curve for 10-Hz stimulation was attenuated in the EEG contralateral to the stimulus (Fig. 4B) relative to the EEG ipsilateral to the stimulus (Fig. 4D). EEG power was affected by 10-Hz stimulation primarily in the 9–11 Hz range. Sixty-minute EEG recordings from EEGs ipsilateral to the fiber optic stimulus probe demonstrate sustained responsiveness to continuous optogenetic stimulation over an interval of 30 min, whether the stimulus was delivered at 10 (Fig. 4F) or 1 Hz (Fig. 4G).
Ten-seconds segments of data collected at 500 Hz were used to calculate event-triggered EEG fluctuations produced by 1 and 10 Hz blue-light pulse trains. Repeated-measures ANOVA with frequency of stimulation as a grouping factor and time relative to stimulation as a within-subjects measure yielded a significant effect for the time (F499,18 962= 8.51, P< 0.001) and time × stimulus frequency interaction (F499,18 962= 5.87, P< 0.001). Event-triggered average EEG traces illustrate the effect of optogenetic stimulation at 1 or 10 Hz (Fig. 5); stimulus-induced EEG depolarization triggered by 1-Hz stimulation (onset at ∼100 ms in Fig. 5) was followed by a protracted hyperpolarization (at ∼250 ms). This wave was disrupted by the subsequent stimulus when stimulation occurred at 10 Hz. Although wake was much more common during optogenetic stimulation, we observed instances of both wake (Fig. 6A,C) and NREMS (Fig. 6B,D) episodes that appeared to continue throughout 10-s intervals of stimulation at both 1 and 10 Hz.
Experimentally Induced 1-Hz EEG Activity Drives a Decline in Cerebral Cortex Lactate Concentration During Wakefulness
Animals instrumented for simultaneous optogenetic stimulation and relative lactate concentration measurement underwent sleep/wake cycles, while the EEG was manipulated optogenetically. To isolate the effects of the stimulation from those of state transitions, only data from those 30-s optogenetic stimulus trains preceded and followed by 30 s of a uniform state classification were subjected to analysis. Because the timing of stimulus trains was preset and sleep episodes are of short duration in mice, instances of 30-s optogenetic stimulus trains preceded and followed by uniform NREMS or REMS states were infrequent. Only 3 of 7 animals exhibited at least one 1-Hz stimulus train preceded and followed by 3 epochs of NREMS. Only 2 of 7 animals exhibited at least one 10-Hz stimulus train preceded and followed by 3 epochs of NREMS. Statistical analysis did not indicate significant effects of optogenetic stimulation on EEG SWA or lactate concentration during NREMS. No animals exhibited a single stimulus train of either class preceded and followed by 3 epochs of REMS. This observation is likely to stem from the fact that REMS episodes of ≥90 s are exceedingly rare in mice. By contrast, all animals exhibited stimulus trains preceded and followed by 3 epochs of wake. ANOVA on averaged curves for stimulus trains applied during wake indicated significant effects of stimulation at 1 Hz on EEG SWA (Fig. 7A; F1,71= 21.34, P< 0.001). ANOVA also indicated significant effects of stimulation at 1 Hz on relative lactate concentration (Fig. 7A; F1,71= 7.30, P= 0.009). Lactate concentration was significantly lower at the third epoch of 1-Hz stimulation relative to wake immediately prior to stimulation. Ten-Hz stimulation did not significantly modulate either EEG SWA or relative lactate concentration (Fig. 7B).
Discussion
Changes in sleep/wake state are accompanied by changes in neuronal activity and cerebral metabolism. The current report complements previous studies by demonstrating that the concentration of lactate, a measure of aerobic glycolysis in the brain, declines in association with sleep SWA. It was previously known that the concentration of lactate in the brain is reduced during sleep relative to wake (Van den Noort and Brine 1970; Shram et al. 2002; Kalinchuk et al. 2003; Wigren et al. 2009). However, it had not been possible to directly link SWA to changes in lactate concentration due to technological hurdles. The techniques used to measure glycolytic intermediates in the brain lacked the temporal resolution necessary to track changes across sleep/wake states in animal models. Lactate in brain tissues can be measured reliably by high performance liquid chromatography only at intervals of several minutes (Wigren et al. 2009). Voltammetric methods increased the temporal resolution to one sample for every 3 min (Shram et al. 2002). During spontaneous sleep in rodents, sleep-state transitions can occur in a matter of seconds (such as brief awakenings from sleep; Franken et al. 1991; Wisor et al. 2006); SWA during NREMS varies on a minute-by-minute time scale (Wisor and Clegern 2011). This discrepancy explains why it has been necessary to study glycolytic intermediates in enforced wakefulness conditions lasting hours rather than in spontaneous sleep (Kalinchuk et al. 2003; Wigren et al. 2009). Enzyme-based real-time measurement of lactate concentration has allowed us to overcome these limitations of previous studies and demonstrates a relationship between 10-s epoch-by-epoch EEG dynamics and relative lactate concentration.
Brain ATP concentration (or at least the stability of ATP concentration in brain extracts; Heller 2010) declines during sustained wakefulness (Van den Noort and Brine 1970) and increases during sleep after sustained wakefulness (Dworak et al. 2010). The change in ATP concentration with sleep is likely to be due in part to reduced demand for ATP as a cellular energetic source. However, ATP production is also regulated by the relative contributions of oxidative respiration and aerobic glycolysis to carbohydrate metabolism. One possible explanation for the surge in ATP levels during sleep (Dworak et al. 2010) is a shift from aerobic glycolysis to oxidative respiration. Oxidative respiration produces more molecules of ATP per molecule of glucose via the citric acid cycle (Nelson and Cox 2008). Collectively, the increase in lactate concentration and decrease in ATP concentration during sustained wakefulness may indicate a relative increase in dependence on aerobic glycolysis in association with wakefulness. That sleep states impact the rate of glycolysis is further supported by observations at the molecular level. The previously documented increase in hexokinase activity in the brain during SD (Thakkar and Mallick 1993; Ramanathan et al. 2010), collectively with the increase in lactate concentration, is an indication that sleep/wake states affect the processing of glycolytic intermediates in the cerebral cortex.
This is not the first report to demonstrate that direct manipulations of cerebral cortical neuronal activity can induce widespread changes in cortical potential resembling sleep SWA. Similar effects have been demonstrated through electrical stimulation of the rodent cortex (Vyazovskiy, Faraguna et al. 2009) and transcranial stimulation of the human cortex (Marshall et al. 2006). The current report is novel in its assessment of metabolic consequences of cortical stimulation in this manner. The data demonstrate a shift in cerebral energetics in association with slow waves in the cerebral cortex: During both slow-wave sleep and induced 1-Hz oscillations, the brain exhibits a reduction in lactate production relative to wakefulness. However, optogenetically induced waves differ from physiological slow waves in several senses. They are not predicated on the withdrawal of depolarizing neuromodulators characteristic of NREMS onset. They do not occur in synchrony with subcortically driven changes in thalamocortical neuron excitability, or in the stereotyped temporal relationship of physiological slow waves to other sleep-related oscillations (Crunelli and Hughes 2010). Additional work will be necessary to determine whether any functional consequences of physiological SWA such as changes in excitatory postsynaptic potentials (Liu et al. 2010) and slow-wave homeostasis (Franken et al. 1991) are mimicked by optogenetic stimulation.
The real-time measurement of lactate, a readout of glycolytic metabolism, allowed us to establish statistical relationships between cerebral metabolism and the moment-to-moment dynamics of EEG oscillations. However, lactate concentration measured in isolation provides limited information. The concentration of glucose itself is, in contrast to lactate, elevated in the brains of spontaneously sleeping rats relative to sleep-deprived rats (Van den Noort and Brine 1970; Netchiporouk et al. 2001). The differential changes of glucose and lactate during sleep likely reflect reduced hexokinase activity during sleep relative to wake. Hexokinase, which initiates glycolysis by converting glucose to glucose-6 phosphate, is rate limiting as it exhibits the lowest Vmax among glycolytic enzymes measured in brain tissue (Clarke and Sokoloff 1998). Hexokinase activity is reduced in the brain during spontaneous sleep relative to enforced wake in both hypoxic (Ramanathan and Siegel 2011) and normoxic conditions (Ramanathan et al. 2010). This reduction provides a possible explanation for the simultaneous increase in glucose concentration and decrease in lactate concentration during sleep. Therefore, the novelty of the current report lies not in the reduction in glucose utilization during sleep, but rather the statistical linkage of SWA to the moment-by-moment dynamics of lactate concentration that was made possible by real-time measurement. Ultimately, it will be necessary to measure in real-time the impacts of SWA and optogenetic stimuli on glycolytic enzyme activity and other glycolytic intermediates to ascertain the mechanisms by which SWA impacts on glucose utilization.
The data presented here establish that lactate concentration is a biochemical covariate of sleep-related oscillations in the cerebral cortex. Whether lactate is a sleep regulatory substance is, however, not known. SWA during NREMS increases in proportion to the duration of prior waking and decreases in proportion to the duration of prior NREMS (Dijk 1995; Borbely and Achermann 2004). Exposure of neonatally derived neurons in vitro to lactate hyperpolarizes membrane potential (Holmgren et al. 2011). Hyperpolarization of membrane potential in corticothalamic-thalamocortical circuits is a trigger for slow oscillations during NREMS (Crunelli and Hughes 2010). Lactate may therefore be a NREMS-promoting substance: The accumulation of lactate in the cerebral cortex during wake may trigger changes in the excitability of neurons, which then promote slow oscillations. These slow oscillations then reduce lactate concentration, eliminating its hyperpolarizing effect and with it the drive for SWA. It is additionally possible that a SWA-related shift from the relatively inefficient process of aerobic glycolysis to the more efficient process of oxidative respiration frees metabolic resources for use in cellular anabolic processes, as suggested elsewhere (Dworak et al. 2010). Anabolic processes known to be facilitated in the brain by sleep include the phosphorylation of proteins that promote translation (Seibt et al. 2012) and an increased rate of protein synthesis (Ramm and Smith 1990; Nakanishi et al. 1997).
The EEG frequency intervals that associated directly with the rate of decline in lactate concentration extended beyond what is typically labeled as SWA/delta (<5 Hz) activity to include theta frequencies (5–9 Hz). While the homeostatic regulation of sleep is most strongly associated with changes in EEG power in the delta range (Borbely and Achermann 2004), in fact, the increase in EEG power that is incurred as a consequence of sleep loss extends beyond the delta range into the theta range in humans (Huber et al. 2004) and rodents (Vyazovskiy et al. 2000). Therefore, the association of theta activity, as well as delta activity, with the rate of decline in lactate concentration, does not nullify the hypothesized relationship between glycolysis and sleep homeostasis. Figure 3A,D additionally demonstrates an inverse relationship between EEG activity in the beta (14–35 Hz) range and the rate at which lactate concentration declines during NREMS. Insomnia is associated with elevated EEG beta activity relative to non-insomniacs (Perlis et al. 2001). Insomniacs report a failure to feel refreshed after a full night's sleep. This parallel between cerebral metabolism and EEG activity related to perceived poor sleep quality raises the possibility that insomnia-related beta activity disrupts regulation of cerebral glycolysis to the detriment of sleep quality.
Funding
This work was supported by Department of Defense (Defense Advanced Research Projects Agency, Young Faculty Award, grant number N66001-09-1-2117) and the National Institutes of Health (grants R15NS070734 and RO1NS078498).
Notes
Conflict of Interest: None declared.
References
- Adamantidis AR, Zhang F, Aravanis AM, Deisseroth K, de Lecea L. Neural substrates of awakening probed with optogenetic control of hypocretin neurons. Nature. 2007;450:420–424. doi: 10.1038/nature06310. doi:10.1038/nature06310. [DOI] [PMC free article] [PubMed] [Google Scholar]
- Alle H, Roth A, Geiger JR. Energy-efficient action potentials in hippocampal mossy fibers. Science. 2009;325:1405–1408. doi: 10.1126/science.1174331. doi:10.1126/science.1174331. [DOI] [PubMed] [Google Scholar]
- Aravanis AM, Wang LP, Zhang F, Meltzer LA, Mogri MZ, Schneider MB, Deisseroth K. An optical neural interface: in vivo control of rodent motor cortex with integrated fiberoptic and optogenetic technology. J Neural Eng. 2007;4:S143–S156. doi: 10.1088/1741-2560/4/3/S02. doi:10.1088/1741-2560/4/3/S02. [DOI] [PubMed] [Google Scholar]
- Arenkiel BR, Peca J, Davison IG, Feliciano C, Deisseroth K, Augustine GJ, Ehlers MD, Feng G. In vivo light-induced activation of neural circuitry in transgenic mice expressing channelrhodopsin-2. Neuron. 2007;54:205–218. doi: 10.1016/j.neuron.2007.03.005. doi:10.1016/j.neuron.2007.03.005. [DOI] [PMC free article] [PubMed] [Google Scholar]
- Attwell D, Laughlin SB. An energy budget for signaling in the grey matter of the brain. J Cereb Blood Flow Metab. 2001;21:1133–1145. doi: 10.1097/00004647-200110000-00001. doi:10.1097/00004647-200110000-00001. [DOI] [PubMed] [Google Scholar]
- Belenky G, Wesensten NJ, Thorne DR, Thomas ML, Sing HC, Redmond DP, Russo MB, Balkin TJ. Patterns of performance degradation and restoration during sleep restriction and subsequent recovery: a sleep dose-response study. J Sleep Res. 2003;12:1–12. doi: 10.1046/j.1365-2869.2003.00337.x. doi:10.1046/j.1365-2869.2003.00337.x. [DOI] [PubMed] [Google Scholar]
- Biston P, Van Cauter E, Ofek G, Linkowski P, Polonsky KS, Degaute JP. Diurnal variations in cardiovascular function and glucose regulation in normotensive humans. Hypertension. 1996;28:863–871. doi: 10.1161/01.hyp.28.5.863. doi:10.1161/01.HYP.28.5.863. [DOI] [PubMed] [Google Scholar]
- Borbely AA, Achermann P. Sleep homeostasis and models of sleep regulation. In: Kryger MH, Roth T, Dement WC, editors. Principles and practice of sleep medicine. Philadelphia: W.B. Saunders; 2004. pp. 377–390. [Google Scholar]
- Burmeister JJ, Palmer M, Gerhardt GA. L-lactate measures in brain tissue with ceramic-based multisite microelectrodes. Biosens Bioelectron. 2005;20:1772–1779. doi: 10.1016/j.bios.2004.07.003. doi:10.1016/j.bios.2004.07.003. [DOI] [PubMed] [Google Scholar]
- Buzsaki G, Kaila K, Raichle M. Inhibition and brain work. Neuron. 2007;56:771–783. doi: 10.1016/j.neuron.2007.11.008. doi:10.1016/j.neuron.2007.11.008. [DOI] [PMC free article] [PubMed] [Google Scholar]
- Clarke DD, Sokoloff L. Circulation and energy metabolism of the brain. In: Siegel GJ, Agranoff BW, Albers RW, Fisher SK, Uhler MD, editors. Basic neurochemistry. Philadelphia: Lippincott-Raven Publishers; 1998. pp. 637–670. [Google Scholar]
- Crunelli V, Hughes SW. The slow (<1 Hz) rhythm of non-REM sleep: a dialogue between three cardinal oscillators. Nat Neurosci. 2010;13:9–17. doi: 10.1038/nn.2445. doi:10.1038/nn.2445. [DOI] [PMC free article] [PubMed] [Google Scholar]
- Dash MB, Douglas CL, Vyazovskiy VV, Cirelli C, Tononi G. Long-term homeostasis of extracellular glutamate in the rat cerebral cortex across sleep and waking states. J Neurosci. 2009;29:620–629. doi: 10.1523/JNEUROSCI.5486-08.2009. doi:10.1523/JNEUROSCI.5486-08.2009. [DOI] [PMC free article] [PubMed] [Google Scholar]
- Destexhe A, Contreras D, Steriade M. Spatiotemporal analysis of local field potentials and unit discharges in cat cerebral cortex during natural wake and sleep states. J Neurosci. 1999;19:4595–4608. doi: 10.1523/JNEUROSCI.19-11-04595.1999. [DOI] [PMC free article] [PubMed] [Google Scholar]
- Dijk DJ. EEG slow waves and sleep spindles: windows on the sleeping brain. Behav Brain Res. 1995;69:109–116. doi: 10.1016/0166-4328(95)00007-g. doi:10.1016/0166-4328(95)00007-G. [DOI] [PubMed] [Google Scholar]
- Dworak M, McCarley RW, Kim T, Kalinchuk AV, Basheer R. Sleep and brain energy levels: ATP changes during sleep. J Neurosci. 2010;30:9007–9016. doi: 10.1523/JNEUROSCI.1423-10.2010. doi:10.1523/JNEUROSCI.1423-10.2010. [DOI] [PMC free article] [PubMed] [Google Scholar]
- Franken P, Dijk DJ, Tobler I, Borbely AA. Sleep deprivation in rats: effects on EEG power spectra, vigilance states, and cortical temperature. Am J Physiol. 1991;261:R198–R208. doi: 10.1152/ajpregu.1991.261.1.R198. [DOI] [PubMed] [Google Scholar]
- Gradinaru V, Thompson KR, Zhang F, Mogri M, Kay K, Schneider MB, Deisseroth K. Targeting and readout strategies for fast optical neural control in vitro and in vivo. J Neurosci. 2007;27:14231–14238. doi: 10.1523/JNEUROSCI.3578-07.2007. doi:10.1523/JNEUROSCI.3578-07.2007. [DOI] [PMC free article] [PubMed] [Google Scholar]
- Heiss WD, Pawlik G, Herholz K, Wagner R, Wienhard K. Regional cerebral glucose metabolism in man during wakefulness, sleep, and dreaming. Brain Res. 1985;327:362–366. doi: 10.1016/0006-8993(85)91537-9. doi:10.1016/0006-8993(85)91537-9. [DOI] [PubMed] [Google Scholar]
- Heller HC. Repeatability is not the same as accuracy. Sleep. 2010;34:839. doi: 10.5665/SLEEP.1108. [DOI] [PMC free article] [PubMed] [Google Scholar]
- Holmgren CD, Mukhtarov M, Malkov AE, Popova IY, Bregestovski P, Zilberter Y. Energy substrate availability as a determinant of neuronal resting potential, GABA signaling and spontaneous network activity in the neonatal cortex in vitro. J Neurochem. 2011;112:900–912. doi: 10.1111/j.1471-4159.2009.06506.x. doi:10.1111/j.1471-4159.2009.06506.x. [DOI] [PubMed] [Google Scholar]
- Hu Y, Wilson GS. A temporary local energy pool coupled to neuronal activity: fluctuations of extracellular lactate levels in rat brain monitored with rapid-response enzyme-based sensor. J Neurochem. 1997;69:1484–1490. doi: 10.1046/j.1471-4159.1997.69041484.x. doi:10.1046/j.1471-4159.1997.69041484.x. [DOI] [PubMed] [Google Scholar]
- Huber R, Ghilardi MF, Massimini M, Tononi G. Local sleep and learning. Nature. 2004;430:78–81. doi: 10.1038/nature02663. doi:10.1038/nature02663. [DOI] [PubMed] [Google Scholar]
- Institute of Laboratory Animal Resources NRC. Guide for care and use of laboratory animals. Washington, DC: National Academy Press; 1996. [Google Scholar]
- Kalinchuk AV, Urrila AS, Alanko L, Heiskanen S, Wigren HK, Suomela M, Stenberg D, Porkka-Heiskanen T. Local energy depletion in the basal forebrain increases sleep. Eur J Neurosci. 2003;17:863–869. doi: 10.1046/j.1460-9568.2003.02532.x. doi:10.1046/j.1460-9568.2003.02532.x. [DOI] [PubMed] [Google Scholar]
- Kennedy C, Gillin JC, Mendelson W, Suda S, Miyaoka M, Ito M, Nakamura RK, Storch FI, Pettigrew K, Mishkin M, et al. Local cerebral glucose utilization in non-rapid eye movement sleep. Nature. 1982;297:325–327. doi: 10.1038/297325a0. doi:10.1038/297325a0. [DOI] [PubMed] [Google Scholar]
- Liu ZW, Faraguna U, Cirelli C, Tononi G, Gao XB. Direct evidence for wake-related increases and sleep-related decreases in synaptic strength in rodent cortex. J Neurosci. 2010;30:8671–8675. doi: 10.1523/JNEUROSCI.1409-10.2010. doi:10.1523/JNEUROSCI.1409-10.2010. [DOI] [PMC free article] [PubMed] [Google Scholar]
- Maquet P. Sleep function(s) and cerebral metabolism. Behav Brain Res. 1995;69:75–83. doi: 10.1016/0166-4328(95)00017-n. doi:10.1016/0166-4328(95)00017-N. [DOI] [PubMed] [Google Scholar]
- Marshall L, Helgadottir H, Molle M, Born J. Boosting slow oscillations during sleep potentiates memory. Nature. 2006;444:610–613. doi: 10.1038/nature05278. doi:10.1038/nature05278. [DOI] [PubMed] [Google Scholar]
- Mukovski M, Chauvette S, Timofeev I, Volgushev M. Detection of active and silent states in neocortical neurons from the field potential signal during slow-wave sleep. Cereb Cortex. 2007;17:400–414. doi: 10.1093/cercor/bhj157. doi:10.1093/cercor/bhj157. [DOI] [PubMed] [Google Scholar]
- Nakanishi H, Sun Y, Nakamura RK, Mori K, Ito M, Suda S, Namba H, Storch FI, Dang TP, Mendelson W, et al. Positive correlations between cerebral protein synthesis rates and deep sleep in Macaca mulatta. Eur J Neurosci. 1997;9:271–279. doi: 10.1111/j.1460-9568.1997.tb01397.x. doi:10.1111/j.1460-9568.1997.tb01397.x. [DOI] [PubMed] [Google Scholar]
- Naylor E, Aillon DV, Gabbert S, Harmon H, Johnson DA, Wilson GS, Petillo PA. Real-time measurement of EEG/EMG and L-glutamate in mice: a biosensor study of neuronal activity during sleep. J Electroanal Chem. 2011;656:106–113. doi: 10.1016/j.jelechem.2010.12.031. doi:10.1016/j.jelechem.2010.12.031. [DOI] [PMC free article] [PubMed] [Google Scholar]
- Nelson DL, Cox MM. Lehninger Principles of Biochemistry. New York: W.H. Freeman and Company; 2008. Glycolysis, gluconeogenesis and the pentose phosphate pathway; pp. 520–568. [Google Scholar]
- Netchiporouk L, Shram N, Salvert D, Cespuglio R. Brain extracellular glucose assessed by voltammetry throughout the rat sleep-wake cycle. Eur J Neurosci. 2001;13:1429–1434. doi: 10.1046/j.0953-816x.2001.01503.x. doi:10.1046/j.0953-816x.2001.01503.x. [DOI] [PubMed] [Google Scholar]
- Nir Y, Staba RJ, Andrillon T, Vyazovskiy VV, Cirelli C, Fried I, Tononi G. Regional slow waves and spindles in human sleep. Neuron. 2011;70:153–169. doi: 10.1016/j.neuron.2011.02.043. doi:10.1016/j.neuron.2011.02.043. [DOI] [PMC free article] [PubMed] [Google Scholar]
- Perlis ML, Smith MT, Andrews PJ, Orff H, Giles DE. Beta/Gamma EEG activity in patients with primary and secondary insomnia and good sleeper controls. Sleep. 2001;24:110–117. doi: 10.1093/sleep/24.1.110. [DOI] [PubMed] [Google Scholar]
- Ramanathan L, Hu S, Frautschy SA, Siegel JM. Short-term total sleep deprivation in the rat increases antioxidant responses in multiple brain regions without impairing spontaneous alternation behavior. Behav Brain Res. 2010;207:305–309. doi: 10.1016/j.bbr.2009.10.014. doi:10.1016/j.bbr.2009.10.014. [DOI] [PMC free article] [PubMed] [Google Scholar]
- Ramanathan L, Siegel JM. Sleep deprivation under sustained hypoxia protects against oxidative stress. Free Radic Biol Med. 2011;51:1842–1848. doi: 10.1016/j.freeradbiomed.2011.08.016. doi:10.1016/j.freeradbiomed.2011.08.016. [DOI] [PMC free article] [PubMed] [Google Scholar]
- Ramm P, Smith CT. Rates of cerebral protein synthesis are linked to slow wave sleep in the rat. Physiol Behav. 1990;48:749–753. doi: 10.1016/0031-9384(90)90220-x. doi:10.1016/0031-9384(90)90220-X. [DOI] [PubMed] [Google Scholar]
- Seibt J, Dumoulin MC, Aton SJ, Coleman T, Watson A, Naidoo N, Frank MG. Protein synthesis during sleep consolidates cortical plasticity in vivo. Curr Biol. 2012;22:676–682. doi: 10.1016/j.cub.2012.02.016. doi:10.1016/j.cub.2012.02.016. [DOI] [PMC free article] [PubMed] [Google Scholar]
- Shram N, Netchiporouk L, Cespuglio R. Lactate in the brain of the freely moving rat: voltammetric monitoring of the changes related to the sleep-wake states. Eur J Neurosci. 2002;16:461–466. doi: 10.1046/j.1460-9568.2002.02081.x. doi:10.1046/j.1460-9568.2002.02081.x. [DOI] [PubMed] [Google Scholar]
- Thakkar M, Mallick BN. Rapid eye movement sleep-deprivation-induced changes in glucose metabolic enzymes in rat brain. Sleep. 1993;16:691–694. [PubMed] [Google Scholar]
- Van den Noort S, Brine K. Effect of sleep on brain labile phosphates and metabolic rate. Am J Physiol. 1970;218:1434–1439. doi: 10.1152/ajplegacy.1970.218.5.1434. [DOI] [PubMed] [Google Scholar]
- Vyazovskiy V, Borbely AA, Tobler I. Unilateral vibrissae stimulation during waking induces interhemispheric EEG asymmetry during subsequent sleep in the rat. J Sleep Res. 2000;9:367–371. doi: 10.1046/j.1365-2869.2000.00230.x. doi:10.1046/j.1365-2869.2000.00230.x. [DOI] [PubMed] [Google Scholar]
- Vyazovskiy VV, Faraguna U, Cirelli C, Tononi G. Triggering slow waves during NREM sleep in the rat by intracortical electrical stimulation: effects of sleep/wake history and background activity. J Neurophysiol. 2009;101:1921–1931. doi: 10.1152/jn.91157.2008. doi:10.1152/jn.91157.2008. [DOI] [PMC free article] [PubMed] [Google Scholar]
- Vyazovskiy VV, Olcese U, Lazimy YM, Faraguna U, Esser SK, Williams JC, Cirelli C, Tononi G. Cortical firing and sleep homeostasis. Neuron. 2009;63:865–878. doi: 10.1016/j.neuron.2009.08.024. doi:10.1016/j.neuron.2009.08.024. [DOI] [PMC free article] [PubMed] [Google Scholar]
- Wigren HK, Rytkonen KM, Porkka-Heiskanen T. Basal forebrain lactate release and promotion of cortical arousal during prolonged waking is attenuated in aging. J Neurosci. 2009;29:11698–11707. doi: 10.1523/JNEUROSCI.5773-08.2009. doi:10.1523/JNEUROSCI.5773-08.2009. [DOI] [PMC free article] [PubMed] [Google Scholar]
- Wisor JP, Clegern WC. Quantification of short-term slow wave sleep homeostasis and its disruption by minocycline in the laboratory mouse. Neurosci Lett. 2011;490:165–169. doi: 10.1016/j.neulet.2010.11.034. doi:10.1016/j.neulet.2010.11.034. [DOI] [PubMed] [Google Scholar]
- Wisor JP, Clegern WC, Schmidt MA. Toll-like receptor 4 is a regulator of monocyte and electroencephalographic responses to sleep loss. Sleep. 2011;34:1335–1345. doi: 10.5665/SLEEP.1274. [DOI] [PMC free article] [PubMed] [Google Scholar]
- Wisor JP, Dement WC, Aimone L, Williams M, Bozyczko-Coyne D. Armodafinil, the R-enantiomer of modafinil: wake-promoting effects and pharmacokinetic profile in the rat. Pharmacol Biochem Behav. 2006;85:492–499. doi: 10.1016/j.pbb.2006.09.018. doi:10.1016/j.pbb.2006.09.018. [DOI] [PubMed] [Google Scholar]
- Wisor JP, Schmidt MA, Clegern WC. Evidence for neuroinflammatory and microglial changes in the cerebral response to sleep loss. Sleep. 2011;34:261–272. doi: 10.1093/sleep/34.3.261. [DOI] [PMC free article] [PubMed] [Google Scholar]
- Zhang J, Laiwalla F, Kim JA, Urabe H, Van Wagenen R, Song YK, Connors BW, Zhang F, Deisseroth K, Nurmikko AV. Integrated device for optical stimulation and spatiotemporal electrical recording of neural activity in light-sensitized brain tissue. J Neural Eng. 2009;6:55007. doi: 10.1088/1741-2560/6/5/055007. doi:10.1088/1741-2560/6/5/055007. [DOI] [PMC free article] [PubMed] [Google Scholar]