Background: DNA methylation contributes to the heritable regulation of gene expression.
Results: Chemical inhibitors of DNA methyltransferase (DNMT) enzymes were identified.
Conclusion: Several inhibitors nonspecifically inhibited multiple methyltransferases through generation of H2O2, but one compound showed selective inhibition of DNMT1 independent of the production of H2O2.
Significance: Selective DNMT1 inhibitors will allow for more precise elucidation of the role of this enzyme in gene regulation.
Keywords: DNA Methylation, DNA Methyltransferase, Gene Regulation, High Throughput Screening (HTS), Reactive Oxygen Species (ROS), Scintillation Proximity Assay
Abstract
A novel scintillation proximity high throughput assay (SPA) to identify inhibitors of DNA methyltransferases was developed and used to screen over 180,000 compounds. The majority of the validated hits shared a quinone core and several were found to generate the reactive oxygen species, H2O2. Inhibition of the production of H2O2 by the addition of catalase blocked the ability of this group of compounds to inhibit DNA methyltransferase (DNMT) activity. However, a related compound, SW155246, was identified that existed in an already reduced form of the quinone. This compound did not generate H2O2, and catalase did not block its ability to inhibit DNA methyltransferase. SW155246 showed a 30-fold preference for inhibition of human DNMT1 versus human or murine DNMT3A or -3B, inhibited global methylation in HeLa cells, and reactivated expression of the tumor suppressor gene RASSF1A in A549 cells. To our knowledge, this work represents the first description of selective chemical inhibitors of the DNMT1 enzyme.
Introduction
Heritable regulation of gene expression in mammals can be encoded directly within DNA sequences (genetic) or carried in modifications to the DNA or the nucleosomal histones used to package the DNA in the chromatin (epigenetic). The most well characterized DNA modification is the addition of a methyl group to the C5 position of cytosine, typically within the context of a CpG sequence (reviewed in Ref. 1). In normal mammalian cells, the majority of CpGs are methylated except CpG islands. Because of the increased frequency by which methylcytosines mutate to TpG, CpGs are under-represented in the whole genome (2). However, regions of unmethylated CpGs, defined by a minimum observed/expected CpG ratio of 0.65 and a GC content >55% over a distance of 500 bp, are known as CpG islands (3). Over 37% of these islands are located in the promoters of genes and ∼70% of known genes have a CpG island within a region 2 kb upstream and 1 kb downstream of the start site of transcription (4). Methylated cytosines serve as binding sites for the methyl-CpG binding domain proteins, MeCP2, MBD1, MBD2, MBD3, MBD4 (5), and Kaiso (6). These proteins, in turn, interact with other chromatin remodeling enzymes and cause methylated DNA to be compacted into a chromatin environment repressive for transcription (7).
Mammalian genomes encode three active DNA methyltransferases (DNMT):4 the de novo methyltransferases DNMT3A and DNMT3B and the maintenance methyltransferase DNMT1 (1). The genes encoding all three of these enzymes are essential for development, with the earliest lethality seen in Dnmt1 knock-out embryos (8). DNMT3A and -3B are able to act on unmethylated DNA to establish methylation patterns imposed during embryogenesis and gametogenesis (9). DNMT1 generally shows preference for hemimethylated DNA and is responsible for transmission of lineage-specific DNA methylation patterns during replication, but some evidence suggests the clear separation of target specificity may be an oversimplification (1). DNMT1 may contribute to both de novo and maintenance methylation in certain regions of the genome alone or in collaboration with DNMT3A and DNMT3B (10, 11).
DNA methylation is known to regulate gene imprinting, X-chromosome inactivation, and transcriptional silencing of repetitive elements during normal development (1). However, DNA methylation patterns are frequently distorted in cancer cells leading to aberrant gene expression. For example, hypomethylation of intergenic regions can occur, leading to activation of transposable elements and increased genomic instability. Likewise, hypermethylation of the promoters of many tumor suppressor genes, such as retinoblastoma gene 1, E-cadherin, and RASSF1A often lead to loss of tumor suppressor function in certain cancer cells and tumors (12). Because DNMT1 and DNMT3B are overexpressed and amplified in numerous cancers, there has been considerable interest in the development of selective inhibitors. At present there are two approved compounds known to affect DNA methylation, 5-azacytidine/VIDAZA (5-AZA) and 5-aza-2′-deoxycytidine/DACOGEN (5-DAC) (13). Both are cytidine analogs that, upon cellular import, are converted to the activated triphosphate 5-aza-dCTP and subsequently incorporated into DNA. The nitrogen at the 5-position of 5-AZA causes an irreversible covalent complex to be formed between the carbon at position 6 in the incorporated altered nucleobase and the DNMT enzyme and triggers its proteosome-mediated degradation (14). In recent years both compounds have shown promise in acute myeloid leukemia and myelodysplastic syndrome as investigators have shifted from using high amounts of drug based on maximum tolerated doses to lower doses that are more effective at decreasing DNA methylation and show less direct cytotoxicity (15, 16).
Despite the clinical utility of 5-AZA and 5-DAC there is a need for inhibitors that do not rely on DNA incorporation for activity, and that show improved stability and selectivity. Selective DNMT inhibitors may allow targeting of diseases driven by a particular DNMT enzyme with reduced off-target effects. Such chemicals might also serve as useful tool compounds to better understand the biological roles of individual DNA methyltransferases. Knockdown of DNMT3B, for example, has been shown to selectively induce apoptosis of tumor versus normal cells and selectively reactivates methylation-silenced gene expression without causing global or juxtracentrameric satellite demethylation (17). Conversely, it has been reported that partial deficiency of DNMT1 prevented intestinal polyp formation in Apcmin mice (18), whereas cre-mediated deletion of the Dnmt1 gene in fibroblasts from mice expressing a conditional Dnmt1 allele caused global demethylation and uniform p53-dependent apoptosis (19).
The present report describes the identification of several DNA methyltransferase inhibitors using a novel scintillation proximity (SPA)-based high throughput assay. Whereas the majority of the identified compounds showed activity against both the maintenance methyltransferase, DNMT1, and the de novo methyltransferases, DNMT3A, at least one chemical inhibitor was identified as having a 30-fold preference toward DNMT1. Experiments that validate the capacity of this latter compound to inhibit global methylation in living cells are presented.
EXPERIMENTAL PROCEDURES
Cloning and Purification of DNMTs
Human DNMT1 (hDNMT1) was produced and purified as described previously (20). However, in the construct utilized, the amino-terminal 580 amino acids (Δ1–580) were absent (21). The truncated enzyme was expressed in Spodoptera frugiperda (Sf-9) cells using a baculovirus expression system and purified by intein-CBD affinity chromatography. Human DNMT3B and DNMT3L (hDNMT3B + 3L) and murine DNMT3A (mDNMT3A; amino acids 220–908) were expressed from the pET28 vector in Escherichia coli strain BL21(DE3). Purification was carried out using nickel affinity column chromatography (22). Protein concentrations were determined by Bradford assay (23).
Biochemical DNMT Assay and High Throughput Screen (HTS)
DNA methylation assays were carried out in a mixture of reaction buffer (50 mm Tris-HCl, pH 7.8, 1 mm EDTA, 1 mm DTT, 10% glycerol), BSA (2.5 μg), [3H]S-adenosylmethionine (AdoMet) (3.35 nmol, PerkinElmer Life Sciences), hemimethylated DNA substrate (5.45 ng), and varying amounts of purified enzyme in a total reaction volume of 25 μl. The DNA substrate used consisted of hemimethylated oligo #1 (5′-Biotin-Biotin-GATCGGATCCGG(5mC)GG(5mC)GG(5mC)GG(5mC)GG(5mC)GG(5mC)GG(5mC)GG(5mC)GG(5mC)GG(5mC)GG(5mC)GG(5mC)GGAGATCTCTAG-3′) annealed to unmethylated oligo #2 (5′-CTAGAGATCTCCGCCGCCGCCGCCGCCGCCGCCGCCGCCGCCGCCGCCGGATCCGA-3′). Both oligos were synthesized by Midland Certified Reagent Co. (Midland, TX). After 3.5 h at 37 °C, the reaction was stopped by the addition of cold AdoMet and streptavidin PVT SPA beads (GE Healthcare).
For the biochemical DNMT HTS, mDNMT3A (0.375 μg/reaction) was screened in a 384-well format using the assay described above with the first column of each plate reserved for the positive control sinefungin (Sigma) at a final concentration of 10 μm. Columns 2 and 23 were used for a neutral control (DMSO alone). The University of Texas Southwestern chemical library used for this screen consisted of ∼180,000 compounds from commercial sources (ChemDiv, ChemBridge, TimTek, Prestwich, and NIH collections) and ∼2,000 compounds synthesized by chemists at The University of Texas Southwestern all of which passed 48 structure-based filters that are designed to remove compounds with undesirable properties (e.g. reactive and/or undesirable functional groups) and that satisfy a relaxed version of Lipinski's rules for good oral bioavailability.
After addition of cold AdoMet (100 μm) and the SPA bead (0.03 mg/well) mixture, the plate was covered and shaken at RT for 15 min. The plate was then left at RT overnight to let the beads settle and each sample was read with a Wallac1450 MicroBeta Trilux (PerkinElmer Life Sciences) the following day. Assay quality on each plate was assessed with the Z′ metric (24) using the neutral and positive controls. Plates with a Z′ value <0.45 were deemed failed plates and repeated. The average Z′ value for all plates in the screen was 0.76. Test wells containing The University of Texas Southwestern chemical library (columns 3–22) were normalized using a row-average normalization method that outputs a normalized activity on a scale of 0–1.
For the biochemical DNMT filter-binding assay, after reactions were completed and frozen, they were thawed and then blotted onto a DE81 filter mat. The filter mats were washed 3 times for 5 min with ice-cold 0.2 m ammonium carbonate, rinsed with cold dH2O, rinsed with cold EtOH, and dried in a microwave. The processed samples were then put in a sealed plastic bag with scintillation fluid and read on the MicroBeta counter using a filter mat cassette. When a more limited number of compounds were assayed, the reactions were individually blotted onto separate pieces of DE81 filter paper. They were processed as before and put in vials with 10 ml of scintillation fluid and read on a traditional scintillation counter. Data were plotted in GraphPad Prism 6 and a nonlinear sigmoidal dose-response curve fitted to the data to determine IC50 values.
Secondary screening consisted of the following assays: a biochemical mDNMT3A SPA assay performed in triplicate on active compounds cherry picked from the library (1472 of ∼180,000 compounds, Z-score ≤ −3.86, row-averaged normalized activity ≤0.7); an assay designed to remove nonspecifically active colored compounds (Color Assay), which was performed in triplicate in the same manner as the biochemical SPA, except the compound was added after the 3.5-h incubation and before the addition of SPA beads; a biochemical SPA assay measuring activity of the RNA methyltransferase TrmA (5.55 μl of 4.5 μm RNA substrate: 5′-biotin-CGCUGUGUUCGAUCCACAGCG-3′, 2.925 μg TrmA/reaction, 0.1 mg of SPA beads/reaction); a biochemical SPA assay with hDNMT1 Δ581 (0.106 μg/reaction); and a biochemical SPA assay with Spiroplasma sp. strain MQ-1 (M.SssI) methyltransferase. The above secondary screening biochemical assays were normalized using a dimethyl sulfoxide control-average normalization method that also outputs a normalized activity on a scale of 0–1. The remaining compounds were also tested for DNA intercalation ability by one or both of the following methods. The first method was a high-throughput 384-well plate format utilizing deoxyribonucleic acid (4.8 μg/ml) from calf thymus DNA as a competitive inhibitor and ethidium bromide as a fluorescent dye indicator. Fluorescence was measured using an excitation of 320 nm and emission of 590 nm on the Wallac EnVision 2104 Multilabel Reader (PerkinElmer). Daunorubicin hydrochloride (5 μm) from Sigma was used as a positive control and compounds were tested at 5 μm. The second method used the DNA Unwinding Kit from TopoGen, Inc. (Port Orange, FL) and results were visualized on a 1% agarose, 1× TPE, 0.2 μg/ml of chloroquine gel.
Redox Assays
Hydrogen peroxide generation was measured using a colorimetric assay based on the ability of horseradish peroxidase to catalyze the oxidation of phenol red and produce a change in absorbance at 610 nm after reaction termination as previously described (25). To determine the redox effects in the biochemical DNMT assay using hDNMT1 Δ581 (0.188 μg/reaction), the filter method was utilized but with the addition of varying concentrations of hydrogen peroxide and/or 50 units of catalase where appropriate.
Cell Culture
A549 and HeLa cells (ATCC, Manassas, VA) were cultured in RPMI 1640 (Invitrogen) supplemented with 10% FBS (Gemini Bio Products, West Sacramento, CA), 100 units of penicillin, 100 μg of streptomycin, 2 mm l-glutamine, 0.1 mm minimal essential medium-non-essential amino acids, and 0.1 mm minimal essential medium-sodium pyruvate (all from Invitrogen) at 37 °C and 5% CO2. HBEC30KT cells, a kind gift of Dr. John Minna, were cultured in ACL4 media supplemented with 2% FBS at 37 °C and 5% CO2. Cell viability was determined by counting viable cells after trypan blue staining. Cells were seeded in 96-well plates in triplicate at a density of 4,000 cells/well and treated with varying doses of different compounds for 72 h. The compound was added at time 0 and again at 48 h with a media change for cell based assays measuring toxicity and in vivo methylation. Cell viability was evaluated by measuring ATP levels with CellTiter-Glo from Promega (Madison, WI) according to the manufacturer's protocol. Treated/control values were plotted in GraphPad Prism and IC50 values were determined from a nonlinear log(inhibitor) versus response-variable slope (four parameter) fit of the data.
Intracellular Reactive Oxygen Species Assay
Reactive oxygen species was measured by a fluorimetric assay using carboxy-H2DCFDA as the probe. A549 cells were plated at a density of 5,000 cells per well into a black 384-well plate (Corning, Tewksbury, MA) and incubated overnight. Cells were then washed once with PBS and treated with 50 μm carboxy-H2DCFDA for 1 h. After washing three times with PBS, cells were treated with increasing concentrations of compound or 100 μm H2O2 as a positive control. After 4 h incubation, fluorescence was measured using excitation wavelength of 480 nm and emission of 520 nm on the EnVision Multilabel Reader.
Global DNA Methylation
Genomic DNA from HeLa cells treated with compound for 72 h was isolated and purified using the Promega Wizard SV genomic DNA purification system. 5-AZA (6 μm) was used as a positive control. Global methylation levels were determined, following DNA hydrolysis, by an LC-MS/MS method as described previously (26).
RASSF1A Expression
RNA from A549 cells treated with compound for 72 h was isolated and purified using a Qiagen RNeasy Mini Kit. 5-AZA (6 μm) was used as a positive control. cDNA was generated with 1 μg of total RNA with SuperScript III First-strand Synthesis (Invitrogen). The expression of RASSF1A was analyzed by quantitative real-time RT-PCR, as described previously with RNASE P used as an internal reference gene to normalize expression of RASSF1A (27). The expression data are shown as a ratio of 1/ΔCt mean because untreated A549 cells did not show a quantifiable amount of RASSF1A expression. To further confirm the lack of RASSF1A expression in A549 and its induction by various compounds, a set of reaction products were visualized on a 2% agarose gel stained with EtBr (supplemental “Materials”).
RASSF1A Promoter Methylation
Genomic DNA from A549 cells treated with compound for 72 h was isolated and purified using Promega Wizard SV genomic DNA purification system. 5-AZA (6 μm) was used as a positive control. The DNA was deaminated as previously described (28). After bisulfite treatment, the RASSF1A promoter sequence was amplified from the deaminated DNA samples using forward primer 5′-GGGTTTTATAGTTTTTGTATTTAGGTTTTT-3′ and reverse primer 5′-CAACTCAATAAACTCAAACTCCCCC-3′ with M13 sites and a hot start DNA Taq Polymerase. After amplification, the promoter sequence was purified and transformed into TOP10 cells using the TOPO TA Cloning Kit for Sequencing from Invitrogen. Colonies were tested for the RASSF1A promoter insert using colony PCR. DNA was isolated from positive clones using the PureLink Quick Plasma DNA Miniprep Kit from Invitrogen. Plasmid DNA was then submitted for Big Dye Terminator sequencing at the McDermott DNA Sanger Sequencing Core Facility at the University of Texas Southwestern Medical Center using vector primer T3. Sequence readouts were then aligned and compared using Sequencher 5.0 software. The analyzed CpG sites are named according to RASSF1A (Homo sapiens) GenBankTM accession NM_007182 with the start codon notated.
Synthesis and Structure-Activity Relationship of SW155246 Analogs
A limited number of SW155246 analogs were generated to evaluate the role of the hydroxyl group on the 1-position of the naphthyl ring (see supplemental “Materials”). SW155246-1 lacks the hydroxyl on the 1-position of the naphthyl ring, whereas SW155246-2 possesses an O-methyl group at the same position. These compounds were subjected to the filter method for the biochemical DNMT assay using hDNMT1 Δ581 (0.153 μg/reaction).
DNMT1 Western Blot
HeLa and A549 cells were treated with 10 μm SW155246 or 4 μm 5-AZA for 3 days, with the compound replaced on day 2. The cells were trypsinized and washed twice with 5 ml of PBS. The cell pellet was lysed on ice with 200 μl of RIPA buffer with 10 mm PMSF and 2 μl of 100× proteinase inhibitor mixture (Calbiochem, San Diego, CA). The cell mixture was pipetted several times to ensure cells were mixed well with buffer, then drawn into a 1-ml syringe with a 25-gauge needle 10 times to shear DNA. The BCA method was used to calculate the total protein concentration, and BSA was used as the standard. The cell lysates were mixed 1:1 with 2× Laemmli loading buffer and stored at −20 °C prior to use in the Western blot. Samples (25 μg/lane) were run on an SDS-polyacrylamide gel (4% stacking and 8% separation gel) and transferred to nitrocellulose membrane (Bio-Rad) at 80 V for 1.5 h. The blot was blocked in 5% nonfat milk and DNMT1 was probed with a 1:300 dilution of an anti-DNMT1 antibody (sc-207011, Santa Cruz Biotechnology), and β-actin with a 1:200 dilution of an anti-actin antibody (sc-47778; Santa Cruz) overnight at 4 °C. A 1:2500 dilution of a rabbit IgG-HRP secondary antibody, (GTX213110–01 GeneTex, Irvine, CA) was used for DNMT1, and a 1:2500 dilution of a mouse IgG-HRP (Santa Cruz) was used for β-actin. After washing, the blot was incubated with ECL solution (Thermo Pierce Scientific) for 1 min and exposed to x-ray film.
RESULTS
High Throughput Assay
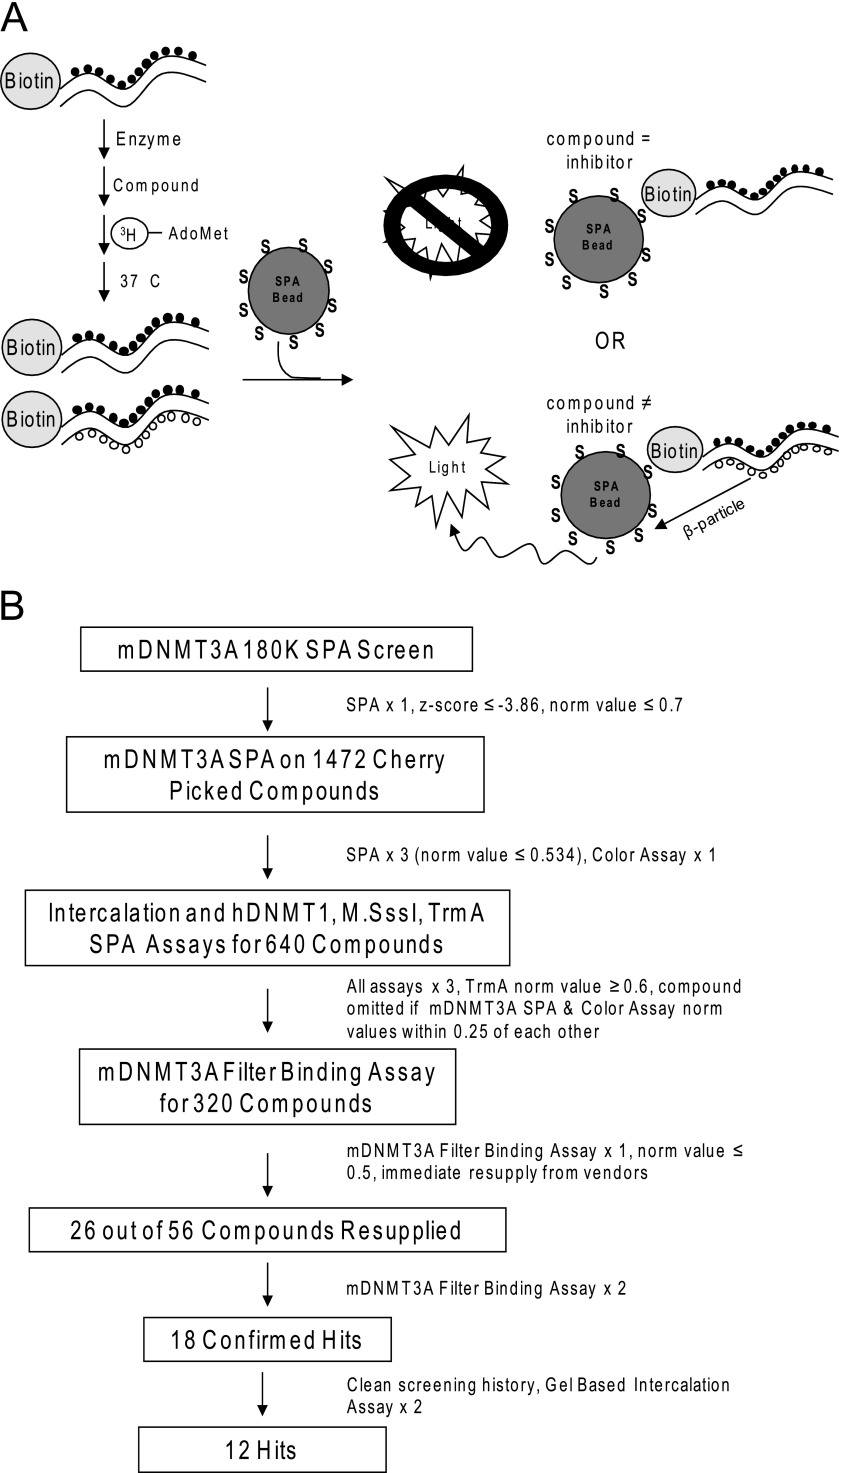
A SPA was used to conduct a high throughput screen for inhibitors of DNA methyltransferases. Although the screening was conducted using mDNMT3A, a hemimethylated DNA template consisting of a biotinylated 58-mer with 12 methylated CpG sites annealed to an antisense 58-mer without biotinylation or methylation was utilized for the substrate so that subsequent secondary assays could evaluate compound specificity for the maintenance methyltransferase DNMT1 versus the de novo methyltransferases DNMT3A and -3B (Fig. 1A). Briefly, DNA template and enzyme were mixed together in 384-well plates in a buffer containing DTT to keep the enzymatic site of the methyltransferase reduced. Compounds were added and the reaction initiated by addition of tritiated AdoMet. In the absence of inhibitors, mDNMT3A methylated the available CpG sites with tritiated AdoMet. After a 3.5-h incubation, streptavidin-labeled PVT scintillation proximity beads were added. Oligos containing labeled CpG sites were brought into sufficiently close proximity to the SPA bead via the biotin-streptavidin interaction and light was produced. Wells containing putative inhibitors showed reduced light generation. Sinefungin, a AdoMet analog originally isolated from S. griseolus (29), was utilized as a control and routinely resulted in >90% inhibition at 10 μm.
FIGURE 1.
SPA used for HTS of DNMT inhibitors. A, schematic of assay used to screen for DNMT3A inhibitors. Two custom oligos were utilized as the substrate. One was a 58-mer oligo, biotinylated (Biotin) on the 5′ end and methylated at 12 CpG sites (black circles). The other oligo was an antisense 58-mer without biotinylation or methylation. The two oligos were annealed to produce a biotinylated, hemi-methylated double-stranded oligo template. Assay components were mixed and the reaction initiated by the addition of tritiated S-adenosylmethionine ([3H]AdoMet). If the compound inhibited the reaction, the double-stranded oligo should remain hemimethylated. If the compound did not inhibit the reaction, the double-stranded oligo would be methylated and AdoMet incorporated. Addition of streptavidin-coated PVT (dark gray SPA beads) allows for light production when bound to double-stranded oligos with [3H]AdoMet incorporated. B, screening strategy for DNMT inhibitors. See text describing the HTS assay under “Experimental Procedures” and “Results” for more details. Norm, normalized.
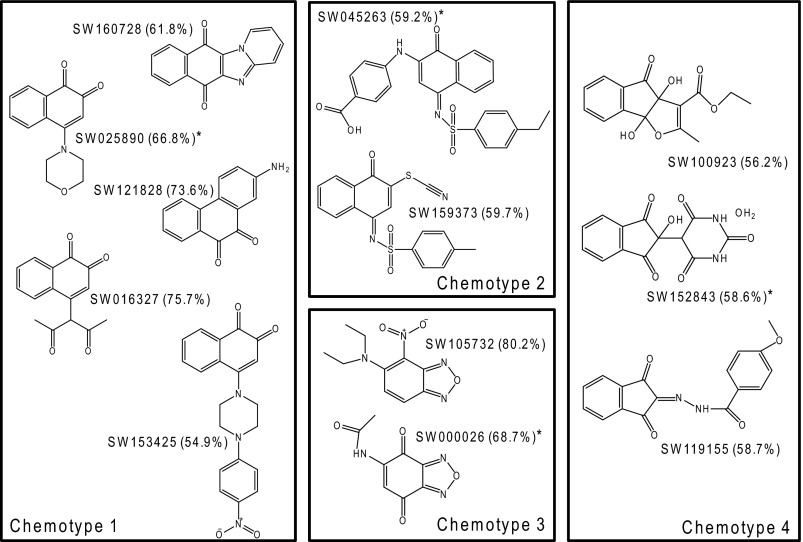
Approximately 180,000 compounds were screened in singlet at a concentration of 10 μm in this assay (Fig. 1b). Using a Z-score of <−3.86 and a normalization value of <0.7 (30% inhibition), 1472 compounds were selected and subsequently cherry picked for further analysis. These compounds were re-screened in the SPA assay in triplicate. Using a more stringent normalized cutoff value of <0.534 (50% inhibition), 640 positive compounds remained (43% validation rate). Compounds were subsequently screened in secondary assays designed to eliminate DNA intercalators, colored compounds that nonspecifically inhibited light transmission from the SPA beads, and compounds that showed greater than 40% inhibition of the TrmA RNA methyltransferase. Approximately 320 compounds were discarded using this screening strategy. The remaining 320 compounds were screened in a final filter-binding assay to validate the results obtained by SPA. The filter assay was identical to the SPA assay except that, instead of adding SPA beads, the completed reaction was blotted onto a DE81 filter mat that was washed prior to reading in a scintillation counter. This evaluation yielded 56 compounds showing greater than 50% inhibition of mDNMT3A in the filter-binding assay (27% validation rate). The explanation for this relatively low validation rate is not completely understood, although a subsequent direct comparison of IC50 values obtained for validated hits from both screens has indicated that the SPA assay is approximately 2–4-fold more sensitive in identifying inhibitors (data not shown). Of the validated hits, 26 compounds were available for immediate re-supply and re-screened in the filter-binding assay. Eighteen of 26 hits were confirmed (69% validation rate) and subjected to a final gel-based intercalation assay to remove any intercalators that were not previously removed by the fluorescent HTS intercalation assay. In addition, hits were checked for a clean screening history in assays run to that date in the University of Texas Southwestern HTS core. A final hit list of 12 compounds was generated and is shown in Fig. 2, along with the percent inhibition of mDNMT3A activity noted in the final filter-binding assay. As is evident from the structures, four major chemotypes are represented. The first chemotype consisted of napthoquinones. The second group represented a specific subset of napthoquinone imines. The third chemotype consisted of compounds with an oxadiazole core, and the final group contained ninhydrin derivatives. A representative compound from each chemotype was screened against hDNMT1 and mDNMT3a in the filter-binding assay at two concentrations (supplemental Fig. S1). All four chemotypes demonstrated similar activity against both DNMT enzymes, although chemotypes 1 and 3 demonstrated a slight preference for hDNMT1.
FIGURE 2.
Screening hits grouped in chemotypes. The % mDNMT3A inhibition when treated with 10 μm compound for 3.5 h and processed using the high throughput filter-binding method is in parentheses. An asterisk indicates the representative compound from each chemotype chosen for further analysis.
Role of Reactive Oxygen Species in Compound Activity
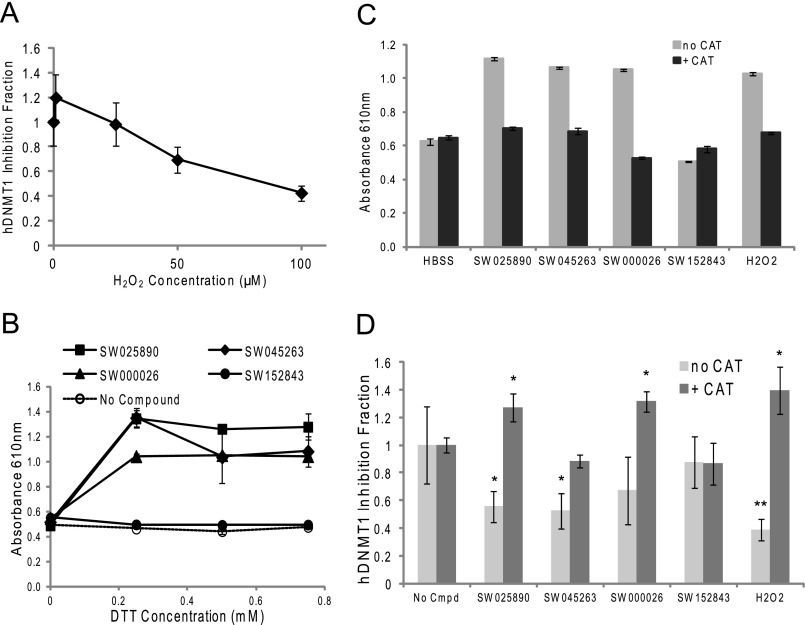
As reported by Johnston and colleagues (25) a number of HTS assays that have utilized a reducing agent in the assay and/or in storage buffers have resulted in identification of several false positive hits because the compounds generated H2O2 by redox cycling in reducing agents that could indirectly modulate the activity of susceptible targets. In fact, addition of H2O2, albeit at relatively high concentrations, to the biochemical filter-based methyltransferase assay, inhibited methyltransferase activity (Fig. 3A). The quinone moiety present in chemotypes 1, 2, and 3 has the potential to generate such reactive oxygen species. Production of H2O2 was therefore monitored upon addition of 10 μm of a representative compound from each of the chemotypes using a colorimetric assay. As shown in Fig. 3B, compounds SW025890 (chemotype 1), SW045263 (chemotype 2), and SW000026 (chemotype 3) generated a change in absorbance equivalent to the addition of 100 μm H2O2. The shift in absorbance by the quinone-containing compounds could be blocked by the addition of catalase to the assay buffer (Fig. 3C). Significantly, the ability of compounds representing chemotypes 1, 2, and 3 to inhibit hDNMT1 activity in vitro could be blocked by the addition of catalase (Fig. 3D), suggesting the mechanism of action of these classes of compounds was through generation of the reactive oxygen species, namely H2O2, which may be oxidizing the catalytic cysteine in the DNMT enzyme. Compounds with an oxidized quinone core were therefore not considered further here due to the lack of specificity in their mode of action. Although the representative chemotype 4 compound (SW152843) did not appear capable of generating reactive oxygen in these assays, subsequent testing of the chemical stability of compounds representing this structural type by LC-MS/MS revealed significant instability in media only (data not shown). This was manifest by the poor repeatability of its ability to inhibit DNMT1 activity (e.g. Fig. 3D). Thus, continued evaluation of this structural class was also not warranted.
FIGURE 3.
Compound redox analysis. A, hDNMT1 Δ580 filter-binding assay shows inhibition generated by H2O2. Each point represents averages from two independent experiments. B, 384-well assay to determine whether hydrogen peroxide is generated by the redox cycling of compounds SW025890 (chemotype 1), SW045263 (chemotype 2), SW000026 (chemotype 3), and SW152843 (chemotype 4) in the presence of varying concentrations of a reducing agent. All compounds were tested at 10 μm. Positive control was 100 μm H2O2 with no DTT, which produced an absorbance at 610 nm of ∼1.3. Buffer only with varying concentrations of DTT had an absorbance range at 610 nm of 0.4 to 0.5. Each point represents the average absorbance of triplicate wells. Conditions are described under “Experimental Procedures.” C, similar to B except the enzyme catalase (CAT) was added at 100 units and DTT was utilized at a single concentration of 0.5 mm in the presence of test compounds. Each bar represents the average absorbance of triplicate wells. D, inhibition of hDNMT1 Δ580 activity was measured using the filter-binding assay in the presence and absence of catalase (CAT, 50 units). Each bar represents averages from three independent experiments. Asterisks indicate statistical significance for a compound sample when compared with the no compound control as calculated by an unpaired t test (*, p < 0.05; **, p < 0.01; ***, p < 0.001). Conditions for all assays are described under “Experimental Procedures.” All compounds were tested at 20 μm except SW000026, which was utilized at 5 μm and H2O2, which was tested at 100 μm.
Compound SAR and Identification of a Novel DNMT1 Selective Inhibitor
In reviewing the original screening data, it was observed that a number of additional hits belonging to chemotype 2 were not selected for further evaluation because they failed to inhibit mDNMT3A by >50% in the filter-binding assay. In an effort to identify hits with a more specific mode of action, these compounds were further screened against hDNMT1. Interestingly, several of these compounds showed quite potent activity for hDNMT1 Δ581, at least in the SPA, and several represented already reduced forms of the quinone. One of these compounds, SW155246, was tested in a dose-response curve for the ability to inhibit hDNMT1 and mDNMT3A in the filter-based biochemical methyltransferase assay (Fig. 4A). Significantly, as shown in Fig. 4B, SW155246 demonstrated a 30-fold preference for hDNMT1 Δ581 (IC50 = 1.2 μm) versus mDNMT3A (IC50 = 38 μm). The AdoMet analog singefungin was used as a positive control. Activity against hDNMT3B + 3L was similar to that observed against mDNMT3a (data not shown). This compound, unlike the original hits from chemotype 2, failed to generate H2O2 as measured using the colorimetric assay (Fig. 4C) and unlike SW045263 and SW025890, the ability of SW155246 to inhibit DNA methyltransferase activity in the biochemical assay was not inhibited by the addition of catalase (Fig. 4D), suggesting a more specific mode of action for this compound.
FIGURE 4.
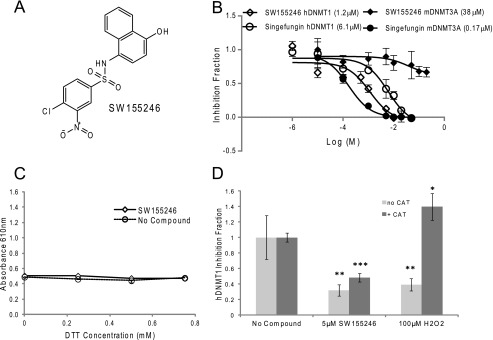
Identification of the DNMT1 selective inhibitor SW155246. A, chemical structure of compound SW155246. B, varying concentrations of SW155246 were submitted to filter-binding assays to obtain activity curves for hDNMT1 and mDNMT3A. Data were plotted in GraphPad Prism 6 and a nonlinear sigmoidal dose-response curve fitted to the data to determine IC50 values, which are shown in parentheses in the graph legend. The AdoMet analog, sinefungin, was used as a positive control. C, 384-well assay to determine whether hydrogen peroxide is generated by the redox cycling of 10 μm SW155246 in the presence of varying concentrations of a reducing agent. Each point represents the average absorbance of triplicate wells. Conditions are described under “Experimental Procedures.” D, inhibition of hDNMT1 Δ580 activity was measured using the filter-binding assay in the presence and absence of catalase (CAT, 50 units). Each bar represents averages from three independent experiments. Asterisks indicate statistical significance for a compound sample when compared with the no compound control as calculated by an unpaired t test (*, p < 0.05; **, p < 0.01; ***, p < 0.001). Conditions for all assays are described under “Experimental Procedures.”
Compound Effects on Cell Viability
Prior to ascertaining whether SW155246 was effective at inhibiting the DNMT enzymes in a cell-based assay, it was first necessary to determine its effects on cellular viability because knockdown of DNMT enzymes by genetic approaches has been shown to affect cell growth and health (17, 19, 30, 31). SW155246 was thus evaluated for activity against two tumor cell lines, HeLa and A549, and one normal immortalized human bronchial epithelial line, HBEC30KT (supplemental Fig. S2) in comparison to the known pan-DNMT inhibitor, 5-AZA. Cell viability was monitored using Cell Titer Glo, which measures the amount of ATP produced. SW155246 showed a variable degree of cell-growth inhibition, with IC50 values ranging from 8 to 20 μm. 5-AZA was a more potent cytotoxin with IC50 values ranging from 3 to 6 μm.
Compound Effects on in Vivo Methylation
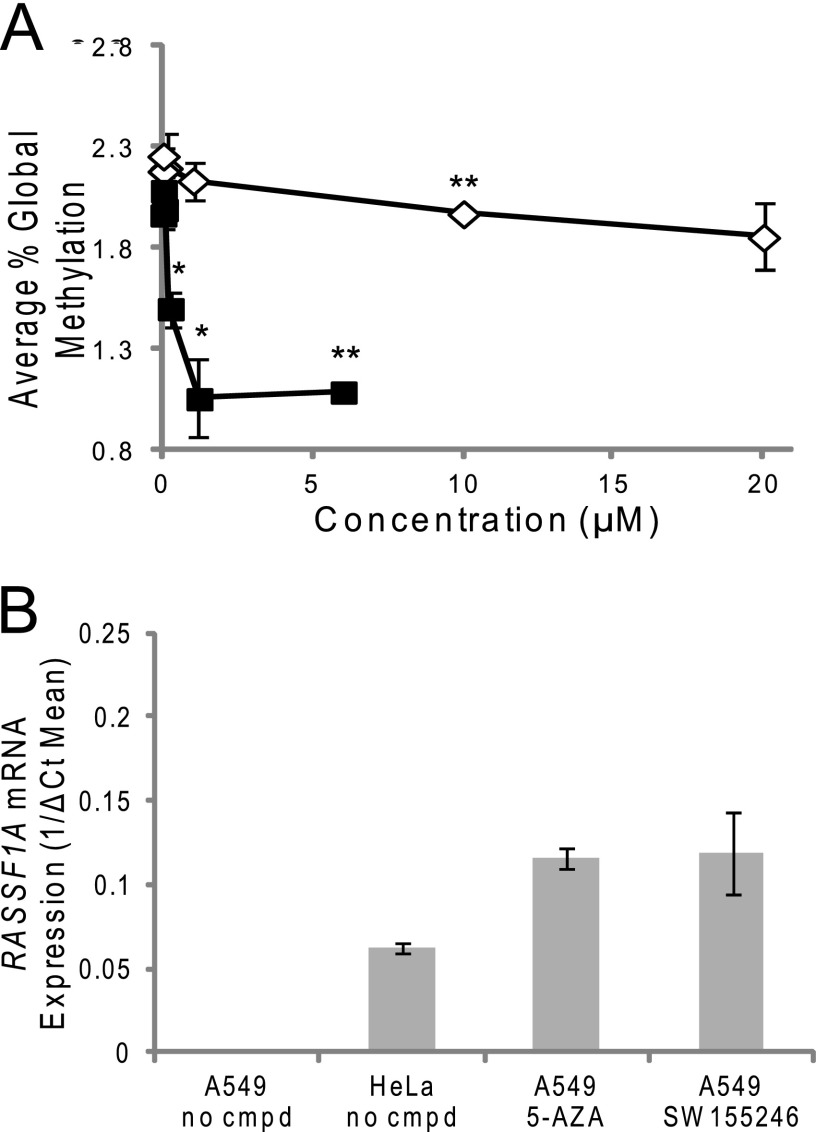
Using the cell viability data as a guide, effects of SW155246 in comparison to 5-AZA on global genomic methylation in HeLa cells was evaluated at concentrations that would not be expected to result in significant cell death. An LC-MS/MS-based genomic methylation assay was employed (26). This assay relies on acid hydrolysis of DNA to yield free cytosine and 5-methylcytosine followed by separation on a C18 reversed phase column using the ion-pairing agent nonafluoropentanoic acid and quantification using stable isotope dilution. Using this assay, the basal level of methylcytosine in HeLa cells was found to be 2.2% of all cytosines. Previous studies utilizing genetic means of blocking either DNMT1 or DNMT3A have demonstrated changes in global DNA methylation upon inhibition of either enzyme (19, 32). Several concentrations of compounds were evaluated with the top concentration chosen to be at or below the cell viability IC50. SW155246 was able to inhibit genomic methylation in HeLa cells at concentrations of 10 μm and higher (Fig. 5A) below its IC50 of 18.6 μm for cell viability. By comparison, treatment with 5-AZA resulted in much more significant effects on global methylation. It is hypothesized that the ability of 5-AZA to inhibit both DNMT1 and DNMT3A/3B and thus both maintenance and de novo methyltransferase activity accounts for its more potent effects on global DNA methylation.
FIGURE 5.
Effects of SW155246 on in vivo methylation. A, HeLa cells were treated with varying concentrations of compound SW155246 for 72 h. The cells were then harvested and genomic DNA was obtained. The genomic DNA was hydrolyzed and samples were run on a Sciex 3200 Qtrap LC-MS/MS to quantify the amount of unmethylated cytosine and methylated cytosine as compared with labeled standards of each. Each point represents averages from two independent experiments. Asterisks denote a statistically significant difference compared with the untreated HeLa cells. Statistical significance was calculated by the unpaired t test (*, p < 0.05; **, p < 0.01). Conditions and calculations are described under “Experimental Procedures.” B, RASSF1A mRNA expression in cells by real-time RT PCR. A549 and HeLa cells were treated with 6 μm 5-AZA or 10 μm SW155246 for 72 h, with fresh addition of compound at 48 h. The cells were then harvested, RNA was extracted, and cDNA was synthesized. Real-time RT-PCR was performed. Each sample was normalized to RNASE P expression. The experiment was performed in biological triplicate with real-time RT-PCR of samples also done in triplicate. Error bars represent the mean ± S.E. for each sample. Conditions and calculations are described under “Experimental Procedures.”
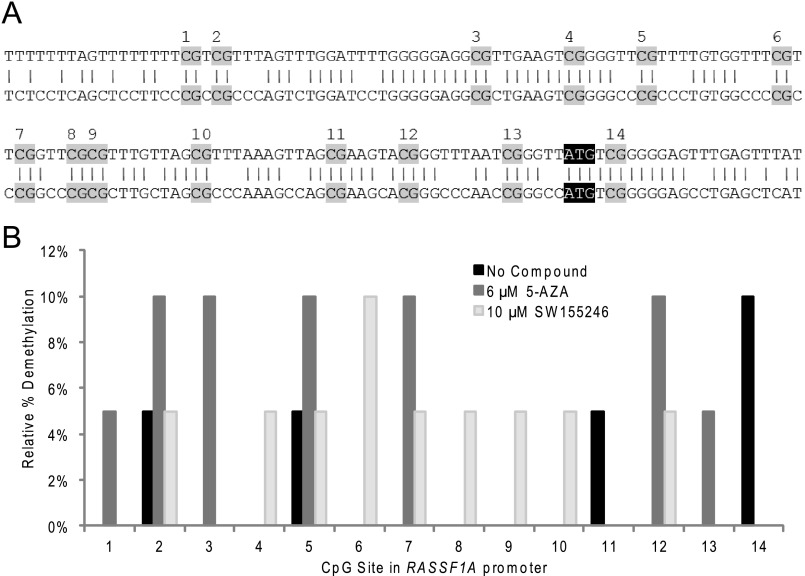
To carry the analysis of SW155246 further, the ability of this compound to specifically affect promoter methylation and subsequent gene expression for a tumor suppressor gene known to be regulated by methylation was tested. RASSF1A is a known tumor suppressor gene that is not expressed in A549 cells due to promoter methylation. Addition of 10 μm SW155246 resulted in re-expression of this gene as measured both by real-time PCR (Fig. 5b) and a gel-based analysis (supplemental Fig. S3), albeit at lower levels than those induced by 5-AZA. Analysis of the RASSF1A promoter showed a loss of methylation at low frequency at several CpG sites after treatment with 10 μm SW155246 (Fig. 6). Notably, two of these sites are the same as those altered after treatment of A549 cells with 6 μm 5-AZA and are fully methylated in untreated A549 cells.
FIGURE 6.
RASSF1A promoter methylation sequencing treated A549 cells. A, the hRASSF1A promoter sequence (NM 007182.4) is shown. The top sequence is deaminated DNA with possible methylation sites, highlighted in gray and numbered, aligned with the endogenous sequence on the bottom. ATG start site is highlighted in black with white text. B, A549 cells were treated with 10 μm SW155246 or 6 μm 5-azacytidine for 72 h, with fresh addition of compound at 48 h. The cells were then harvested and genomic DNA was obtained. The genomic DNA was deaminated and the RASSF1A promoter was amplified through PCR. The PCR products were cloned into E. coli and insert DNA was checked using colony PCR. Plasmid DNA was isolated from positive clones and sequenced using Big Dye Terminator chemistry. Sequences were analyzed using Analyst Software. The DNA was confirmed to have complete deamination. Data from 20 clones of each are shown. Conditions and calculations are described under “Experimental Procedures.”
SW155246 Mode of Action Studies and SAR
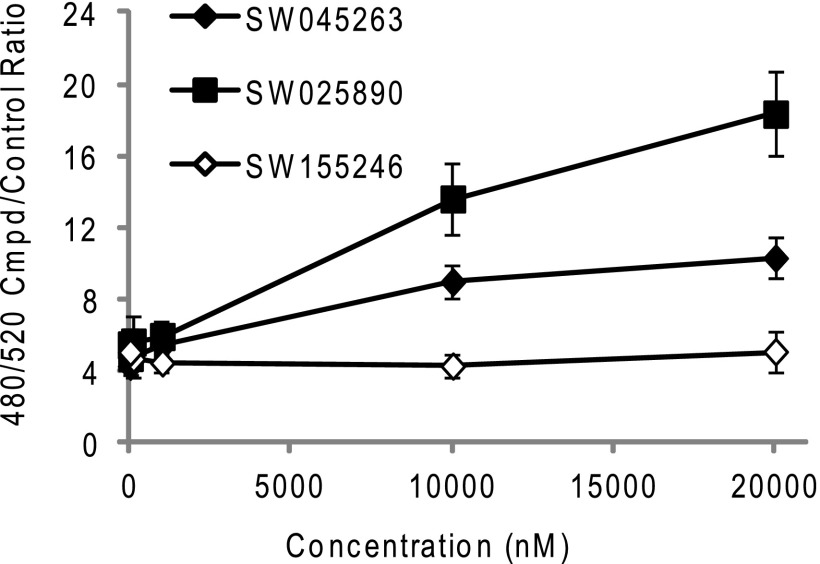
To confirm that the ability of SW155246 to inhibit hDNMT1 activity in vivo was not through generation of reactive oxygen species, compound was added to A549 cells at 10 μm. As controls, two of the original chemotype 1 and 2 hits that were found to generate H2O2 in vitro were also evaluated. Both SW045263 and SW025890 when used at 10 μm generated H2O2 in A549 cells as measured by addition of 50 μm of the sensor dye, carboxy-H2DCFDA, whereas SW155246 failed to show a shift in absorbance indicative of the production of H2O2 (Fig. 7). Similarly, catalase did not affect cell viability of SW155246-treated cells (supplemental Fig. S4), suggesting a redox-insensitive mechanism is responsible for the loss in cell viability.
FIGURE 7.
Compound in vivo redox analysis. A 384-well assay to determine whether reactive oxygen species is generated by compounds SW045263 (chemotype 1), SW025890 (chemotype 2), and SW155246 in A549 cells was performed. Compounds were titrated with 5000 cells/well. Carboxy-H2DCFDA (50 μm) was used as an indicator and fluorescence was read at excitation 480 and emission of 520 4 h after addition of compound. Readings were normalized to no compound samples. Each point represents the average reading of triplicate wells. Conditions for all assays are described under “Experimental Procedures.”
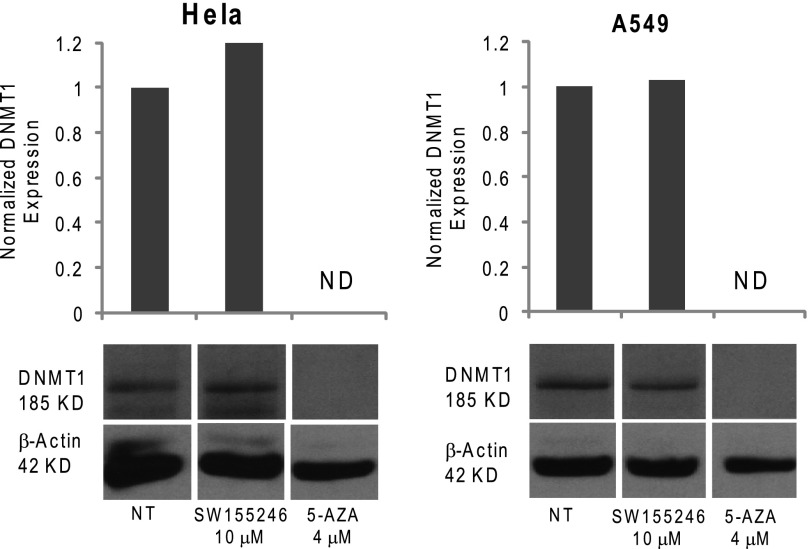
Because 5-AZA is known to affect stability of the DNMT proteins, the effects of SW155246 on stability of hDNMT1 was evaluated (Fig. 8). Although 4 μm 5-AZA clearly resulted in degradation of the DNMT1 protein, as would be expected, up to 10 μm SW155246 had no effect. Thus, SW155246 inhibits the activity of the DNMT1 enzyme without affecting protein levels or generating reactive oxygen species.
FIGURE 8.
Effects of SW155246 and 5-AZA on DNMT1 protein levels. HeLa and A549 cells were treated with 10 μm SW155246 and 4 μm 5-AZA for 72 h, with fresh addition of compound at 48 h and lysed for DNMT1 Western blot analysis. Samples were electrophoresed on a 8% SDS-polyacrylamide gel and probed with DNMT1 antibody. The Western blots were scanned and analyzed with ImageJ. The DNMT1 signal was normalized to β-actin. The normalized expression value is indicated in the bar graph above each blot. NT, non-treated cells; ND, not detectable.
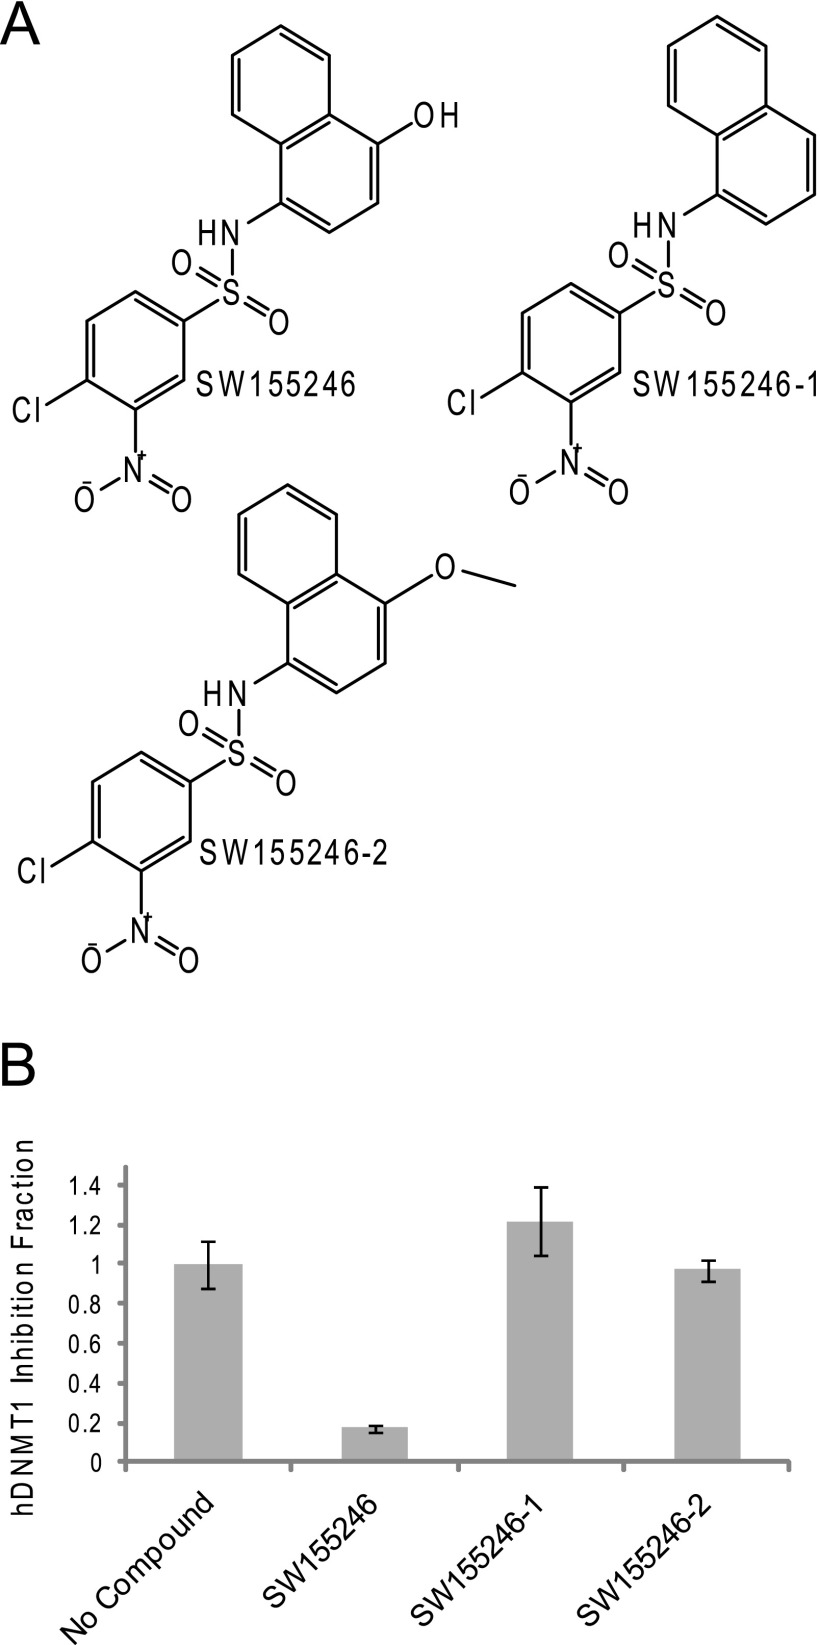
A limited SAR analysis was conducted and demonstrated that loss of the hydroxyl group (SW155246-1) or addition of a methylated oxygen on the 1-position of the naphthyl ring (SW155246-2) completely abolished the ability of this compound to inhibit hDNMT1 Δ581 activity in vitro and reduced cell-based cytotoxicity (Fig. 9 and supplemental Fig. S5). Furthermore, mining of the original mDNMT3A HTS data revealed that: 1) compounds with a bulky substituent at the 2-position on the napthyl ring, such as that observed in SW045263, failed to show specificity for DNMT1 versus 3A and 2) equally potent activity was observed for compounds like SW155246 that were already reduced and compounds that were quinones (supplemental Table S1.).
FIGURE 9.
Compound SW155246 SAR. A, chemical structures of compound SW155246 and analogs are shown. SW155246-1 has had the hydroxyl group removed and SW155246-2 has had a methyl group added to the oxygen at the 1-position of the naphthyl ring. B, hDNMT1 filter-binding assay with 10 μm of each compound is shown. Each bar represents the average of three independent experiments. Conditions are described under “Experimental Procedures.”
DISCUSSION
The most widely used DNA methyltransferase inhibitors are the cytidine analogs, 5-AZA and 5-DAC. These compounds are imported into cells and subsequently incorporated into DNA. A covalent complex is formed between the DNMT enzyme and the carbon at position 6 in the altered nucleobase due to the nitrogen at position 5. This triggers proteosome-mediated DNMT1 degradation (13, 14). At high doses these compounds lose their potent hypomethylation activity due to the appearance of cytotoxicity unrelated to DNA methylation (33). More recent use of these compounds employing low dose strategies have demonstrated clinical efficacy in myelodysplastic syndrome and acute myeloid leukemia. Despite their advantages, significant challenges arise from the instability of 5-AZA and 5-DAC in aqueous solutions as well as in vivo deamination. Current studies are focused on improving the stability and delivery of these agents. A number of additional compounds that function as reversible inhibitors of methyltransferase activity have been identified over the years (reviewed in Ref. 14) but there has been difficulty in many cases in validating their role as methyltransferase inhibitors. Thus, there is a need for potent, selective DNA methyltransferase inhibitors, both as tool compounds and as potential therapeutics.
The data presented herein represent the first identification of a semi-selective DNMT1 inhibitor with low micromolar efficacy in a biochemical assay measuring DNA methyltransferase activity. SW155246 shows a 30-fold selectivity for inhibition of hDNMT1 versus mDNMT3A. Although 2-fold more mDNMT3A enzyme (∼147 nm) was used relative to hDNMT1 (∼60 nm) in the biochemical assays, the amount of compound is far in excess of this; thus, the differential specificity cannot be explained by differences in enzyme abundance. The SAR represented by the screening data indicates that bulky groups at the 2-position of the naphthyl ring diminish interaction of the compounds with DNMT1, whereas small groups or no substitution at this position promote inhibition of DNMT1; however, this remains to be more fully explored. It may be that compounds with the bulky substituent form only weak interactions with both DNMT3A and DNMT1 and their ability to produce H2O2 allows for modest inhibition of both enzymes. Smaller compounds lacking this bulky substituent, such as SW155246, however, may form a tighter interaction with DNMT1 that allows for potent and specific inhibition of this enzyme not dependent on generation of H2O2. SW155246 also demonstrated the ability to demethylate cytosines in vivo in a cell-based assay and induced re-expression of the tumor suppressor gene, RASSF1A. The change in expression was correlated with an increased frequency of demethylation of specific CpG sites within the RASSFIA promoter. This activity was not as pronounced as that observed using the known DNA methytransferase inhibitor 5-AZA, possibly due to the broader activity of 5-AZA for both maintenance and de novo methyltransferases. In addition, SW155246 showed only a 4-h half-life in the presence of the HeLa cells used in this assay (data not shown) as measured by LC-MS/MS. As compound was added only at the beginning of the 3-day incubation and again on day 2, the amount of active compound available to affect in vivo methylation was likely lower than represented by the amount added. Thus, there is potential for more potent in vivo activity if issues with compound stability can be resolved.
Although a definitive mode of action for SW155246 against DNMT1 was not identified, the results described herein demonstrate a number of important features of its activity. First, a gel-based intercalation assay indicated that it does not intercalate DNA (data not shown). Additional screening data using SPA for measuring methyltransferase activity showed poor activity of this compound in inhibiting both the bacterial methyltransferase M.SssI (22% inhibition at 10 μm), the RNA methyltransferase TrmA (37% inhibition at 10 μm), and murine DNMT3A (55% inhibition at 10 μm) but potent activity against human DNMT1 (90% inhibition at 10 μm). Subsequent dose-response studies indicated a 30-fold difference in IC50 values for DNMT3A versus DNMT1, demonstrating the selectivity of this compound for DNMT1. Unlike most of the hits identified here, SW155246 does not act to inhibit DNMT1 through generation of reactive oxygen nor does it act like 5-AZA by causing degradation of the DNMT enzymes. Based on its specificity and potency, further studies are warranted to define its precise mode of action.
Several of the identified compounds, as typified by SW045263 and SW025890, potently inhibited both the maintenance and de novo methyltransferases, but suffered from the nonspecific ability to generate H2O2 in both the biochemical methyltransferase assay and in cells. The addition of exogenous catalase blocked the generation of H2O2 by these compounds but also blocked their ability to inhibit methyltransferase activity, suggesting that the H2O2 generated may have oxidized the catalytic cysteine in the active site of DNA methyltransferases. It is intriguing that a number of recently identified DNMT inhibitors are either quinones like nanaomycin (34) or dichlone (35) or are capable of generating H2O2 (epigallocatechin-3-gallate (36)) These results, although raising questions regarding the utility of these types of inhibitors as potential therapeutics due to off target toxicity, do suggest a possible role for the cellular oxidation state in regulating methylation. The role of oxidative stress in modulating generation of glutathionine versus AdoMet is well known (37). Homocysteine, which is generated as a by-product of DNA methylation, is at the cross-roads of generation of either methionine or cysteine depending on cellular needs. It may be processed through the transulfation pathway to generate cysteine and GSH or be recycled to methionine and subsequently contribute to AdoMet pools through betaine homocysteine methyltransferase, which is expressed primarily in liver and kidney, or methionine synthase, which is broadly expressed. Studies to date indicate that the modulation of AdoMet pools have broad effects on epigenetic marks (37). Although H2O2 has been shown to have a direct effect in modulating the activity of histone deacetylases (38), this is one of the first demonstrations of a direct role of reactive oxygen species in modulating the activity of DNA methyltransferase enzymes.
Supplementary Material
Acknowledgment
We thank Steven McKnight for support and advice throughout the conduct of this research and critical reading of the manuscript.
This work was supported, in whole or in part, by National Institutes of Health Grant P01 CA095471 (to S. L. McKnight).

This article contains supplemental “Materials,” Figs. S1–S5, and Table S1.
- DNMT
- DNA methyltransferase
- SPA
- scintillation proximity assay
- HTS
- high throughput screen
- 5-AZA
- 5-azacytidine/VIDAZA
- 5-DAC
- 5-Aza-2′-deoxycytidine/DACOGEN
- AdoMet
- S-adenosylmethionine
- LC-MS/MS
- liquid chromatography tandom mass spectrometry
- CAT
- catalase
- SAR
- structure-activity relationship
- H2DCFDA
- 2′,7′-dichlorodihydrofluorescein diacetate.
REFERENCES
- 1. Jurkowska R. Z., Jurkowski T. P., Jeltsch A. (2011) Structure and function of mammalian DNA methyltranserases. Chembiochem. 12, 206–222 [DOI] [PubMed] [Google Scholar]
- 2. Pfeifer G. P., Tang M., Denissenko M. F. (2000) Mutation hotspots and DNA methylation. Curr. Top. Microbiol. Immunol. 249, 1–19 [DOI] [PubMed] [Google Scholar]
- 3. Tazi J., Bird A. (1990) Alternative chromatin structure at CpG islands. Cell 60, 909–920 [DOI] [PubMed] [Google Scholar]
- 4. Takai D., Jones P. A. (2002) Comprehensive analysis of CpG islands in human chromosomes 21 and 22. Proc. Natl. Acad. Sci. U.S.A. 99, 3740–3745 [DOI] [PMC free article] [PubMed] [Google Scholar]
- 5. Dhasarathy A., Wade P. A. (2008) The MBD protein family. Reading an epigenetic mark? Mutat. Res. 647, 39–43 [DOI] [PMC free article] [PubMed] [Google Scholar]
- 6. Prokhortchouk A., Hendrich B., Jørgensen H., Ruzov A., Wilm M., Georgiev G., Bird A., Prokhortchouk E. (2001) The p120 catenin partner Kaiso is a DNA methylation-dependent transcriptional repressor. Genes Dev. 15, 1613–1618 [DOI] [PMC free article] [PubMed] [Google Scholar]
- 7. Bird A. P., Wolffe A. P. (1999) Methylation induced repression-belts, braces, and chromatin. Cell 99, 451–454 [DOI] [PubMed] [Google Scholar]
- 8. Li E., Bestor T. H., Jaenisch R. (1992) Targeted mutation of the DNA methyltransferase gene results in embryonic lethality. Cell 69, 915–926 [DOI] [PubMed] [Google Scholar]
- 9. Okano M., Bell D. W., Haber D. A., Li E. (1999) DNA methyltransferases Dnmt3a and Dnmt3b are essential for de novo methylation and mammalian development. Cell 99, 247–257 [DOI] [PubMed] [Google Scholar]
- 10. Jair K. W., Bachman K. E., Suzuki H., Ting A. H., Rhee I., Yen R. W., Baylin S. B., Schuebel K. E. (2006) De novo CpG island methylation in human cancer cells. Cancer Res. 66, 682–692 [DOI] [PubMed] [Google Scholar]
- 11. Liang G., Chan M. F., Tomigahara Y., Tsai Y. C., Gonzales F. A., Li E., Laird P. W., Jones P. A. (2002) Cooperativity between DNA methyltransferases in the maintenance methylation of repetitive elements. Mol. Cell. Biol. 22, 480–491 [DOI] [PMC free article] [PubMed] [Google Scholar]
- 12. McCabe M. T., Brandes J. C., Vertino P. M. (2009) Cancer DNA methylation. Molecular mechanisms and clinical implications. Clin. Cancer Res. 15, 3927–3937 [DOI] [PMC free article] [PubMed] [Google Scholar]
- 13. Jones P. A., Taylor S. M. (1980) Cellular differentiation, cytidine analogs and DNA methylation. Cell 20, 85–93 [DOI] [PubMed] [Google Scholar]
- 14. Foulks J. M., Parnell K. M., Nix R. N., Chau S., Swierczek K., Saunders M., Wright K., Hendrickson T. F., Ho K. K., McCullar M. V., Kanner S. B. (2012) Epigenetic drug discovery. Targeting DNA methyltransferases. J. Biomol. Screen. 17, 2–17 [DOI] [PubMed] [Google Scholar]
- 15. Silverman L. R., McKenzie D. R., Peterson B. L., Holland J. F., Backstrom J. T., Beach C. L., Larson R. A. (2006) Further analysis of trials with azacitidine in patients with myelodysplastic syndrome. Studies 8421, 8291, and 9221 by the Cancer and Leukemia Group B. J. Clin. Oncol. 24, 3895–3903 [DOI] [PubMed] [Google Scholar]
- 16. Kantarjian H., Issa J. P., Rosenfeld C. S., Bennett J. M., Albitar M., DiPersio J., Klimek V., Slack J., de Castro C., Ravandi F., Helmer R., 3rd., Shen L., Nimer S. D., Leavitt R., Raza A., Saba H. (2006) Decitabine improves patient outcomes in myelodysplastic syndromes. Results of a phase III randomized study. Cancer 106, 1794–1803 [DOI] [PubMed] [Google Scholar]
- 17. Beaulieu N., Morin S., Chute I. C., Robert M. F., Nguyen H., MacLeod A. R. (2002) An essential role for DNA methyltransferase DNMT3B in cancer cell survival. J. Biol. Chem. 277, 28176–28181 [DOI] [PubMed] [Google Scholar]
- 18. Eads C. A., Nickel A. E., Laird P. W. (2002) Complete genetic suppression of polyp formation and reduction of CpG-island hypermethylation in Apc(Min/+) DNMT-hypomorphic mice. Cancer Res. 62, 1296–1299 [PubMed] [Google Scholar]
- 19. Jackson-Grusby L., Beard C., Possemato R., Tudor M., Fambrough D., Csankovszki G., Dausman J., Lee P., Wilson C., Lander E., Jaenisch R. (2001) Loss of genomic methylation causes p53-dependent apoptosis and epigenetic deregulation. Nat. Genet. 27, 31–39 [DOI] [PubMed] [Google Scholar]
- 20. Pradhan S., Bacolla A., Wells R. D., Roberts R. J. (1999) Recombinant human DNA (cytosine-5) methyltransferase. I. Expression, purification, and comparison of de novo and maintenance methylation. J. Biol. Chem. 274, 33002–33010 [DOI] [PubMed] [Google Scholar]
- 21. Pradhan S., Estève P. O. (2003) Allosteric activator domain of maintenance human DNA (cytosine-5) methylatransferase and its role in methylation spreading. Biochemistry 42, 5321–5332 [DOI] [PubMed] [Google Scholar]
- 22. Jia D., Jurkowska R. Z., Zhang X., Jeltsch A., Cheng X. (2007) Structure of Dnmt3a bound to Dnmt3L suggests a model for de novo DNA methylation. Nature 449, 248–251 [DOI] [PMC free article] [PubMed] [Google Scholar]
- 23. Bradford M. M. (1976) Rapid and sensitive method for the quantitation of microgram quantities of protein utilizing the principle of protein-dye binding. Anal. Biochem. 72, 248–254 [DOI] [PubMed] [Google Scholar]
- 24. Zhang J. H., Chung T. D., Oldenburg K. R. (1999) A simple statistical parameter for use in evaluation and validation of high throughput screening assays. J. Biomol. Screen. 4, 67–73 [DOI] [PubMed] [Google Scholar]
- 25. Johnston P. A., Soares K. M., Shinde S. N., Foster C. A., Shun T. Y., Takyi H. K., Wipf P., Lazo J. S. (2008) Development of a 384-well colorimetric assay to quantify hydrogen peroxide generated by the redox cycling of compounds in the presence of reducing agents. Assay Drug Dev. Technol. 6, 505–518 [DOI] [PMC free article] [PubMed] [Google Scholar]
- 26. Kok R. M., Smith D. E., Barto R., Spijkerman A. M., Teerlink T., Gellekink H. J., Jakobs C., Smulders Y. M. (2007) Global DNA methylation measured by liquid chromatography-tandem mass spectrometry. Analytical technique, reference values and determinants in health subjects. Clin. Chem. Lab. Med. 45, 903–911 [DOI] [PubMed] [Google Scholar]
- 27. Suzuki M., Sunaga N., Shames D. S., Toyooka S., Gazdar A. F., Minna J. D. (2004) RNA interference-mediated knockdown of DNA methyltransferase 1 leads to promoter demethylation and gene re-expression in human lung and breast cancer cells. Cancer Res. 64, 3137–3143 [DOI] [PubMed] [Google Scholar]
- 28. Kilgore J. A., Hoose S. A., Gustafson T. L., Porter W., Kladde M. P. (2007) Single-molecule and population probing of chromatin structure using DNA methyltransferases. Methods 41, 320–332 [DOI] [PMC free article] [PubMed] [Google Scholar]
- 29. Schluckebier G., Kozak M., Bleimling N., Weinhold E., Saenger W. (1997) Differential binding of S-adenosylmethionine S-adenosylhomocysteine and Sinefungin to the adenine-specific DNA methyltransferase M.Taql. J. Mol. Biol. 265, 56–67 [DOI] [PubMed] [Google Scholar]
- 30. Chen T., Hevi S., Gay F., Tsujimoto N., He T., Zhang B., Ueda Y., Li E. (2007) Complete inactivation of DNMT1 leads to mitotic catastrophe in human cancer cells. Nat. Genet. 39, 391–396 [DOI] [PubMed] [Google Scholar]
- 31. Zhao Z., Wu Q., Cheng J., Qiu X., Zhang J., Fan H. (2010) Depletion of DNMT3A suppressed cell proliferation and restored PTEN in hepatocellular carcinoma cell. J. Biomed. Biotechnol. 10.1155/2010/737535 [DOI] [PMC free article] [PubMed] [Google Scholar]
- 32. Chen T., Ueda Y., Dodge J. E., Wang Z., Li E. (2003) Establishment and maintenance of genomic methylation patterns in mouse embryonic stem cells by Dnmt2a and Dnmt3b. Mol. Cell Biol. 23, 5594–5605 [DOI] [PMC free article] [PubMed] [Google Scholar]
- 33. Hollenbach P. W., Nguyen A. N., Brady H., Williams M., Ning Y., Richard N., Krushel L., Aukerman S. L., Heise C., MacBeth K. J. (2010) A comparison of azacitidine and decitabine activities in acute myeloid leukemia cell lines. PLoS One 5, e9001. [DOI] [PMC free article] [PubMed] [Google Scholar]
- 34. Kuck D., Caulfield T., Lyko F., Medina-Franco J. L. (2010) Nanaomycin A selectively inhibits DNMT3B and reactivates silenced tumor suppressor genes in human cancer cells. Mol. Cancer Ther. 9, 3015–3023 [DOI] [PubMed] [Google Scholar]
- 35. Ceccaldi A., Rajavelu A., Ragozin S., Sénamaud-Beaufort C., Bashtrykov P., Testa N., Dali-Ali H., Maulay-Bailly C., Amand S., Guianvarc'h D., Jeltsch A., Arimondo P. B. (2013) Identification of novel inhibitors of DNA methylation by screening of a chemical library. ACS Chem. Biol. 8, 543–548 [DOI] [PubMed] [Google Scholar]
- 36. Min N. Y., Kim J. H., Choi J. H., Liang W., Ko Y. J., Rhee S., Bang H., Ham S. W., Park A. J., Lee K. H. (2012) Selective death of cancer cells by preferential induction of reactive oxygen species in response to (−)-epigallocatechin-3-gallate. Biochem. Biophys. Res. Commun. 421, 91–97 [DOI] [PubMed] [Google Scholar]
- 37. Cyr A. R., Domann F. E. (2011) The redox basis of epigenetic modifications. From mechanisms to functional consequences. Antioxid. Redox Signal. 15, 551–589 [DOI] [PMC free article] [PubMed] [Google Scholar]
- 38. Ito K., Hanazawa T., Tomita K., Barnes P. J., Adcock I. M. (2004) Oxidative stress reduces histone deacetylase 2 activity and enhances IL-8 gene expression. Role of tyrosine nitration. Biochem. Biophys. Res. Commun. 315, 240–245 [DOI] [PubMed] [Google Scholar]
Associated Data
This section collects any data citations, data availability statements, or supplementary materials included in this article.


