Abstract
♦ Background: Several studies have reported benefits for human peritoneal mesothelial cell function of a neutral-pH dialysate low in glucose degradation products (GDPs). However, the effects of low-GDP solution on ultrafiltration (UF), transport of solutes, and control of body water remain elusive. We therefore investigated the effect of low-GDP solution on UF, solute transport, and control of body water.
♦ Methods: Among 79 new continuous ambulatory peritoneal dialysis (CAPD) patients, 60 completed a 12-month protocol (28 in a lactate-based high-GDP solution group, 32 in a lactate-based low-GDP solution group). Clinical indices—including 24-hour UF volume (UFV), 24-hour urine volume (UV), residual renal function, and dialysis adequacy—were measured at months 1, 6, and 12. At months 1, 6, and 12, UFV, glucose absorption, 4-hour dialysate-to-plasma (D/P) creatinine, and 1-hour D/P Na+ were assessed during a modified 4.25% peritoneal equilibration test (PET). Body composition by bioelectric impedance analysis was measured at months 1 and 12 in 26 CAPD patients.
♦ Results: Daily UFV was lower in the low-GDP group. Despite similar solute transport and aquaporin function, the low-GDP group also showed lower UFV and higher glucose absorption during the PET. Factors associated with UFV during the PET were lactate-based high-GDP solution and 1-hour D/P Na+. No differences in volume status and obesity at month 12 were observed, and improvements in hypervolemia were equal in both groups.
♦ Conclusions: Compared with the high-GDP group, the low-GDP group had a lower UFV during a PET and a lower daily UFV during the first year after peritoneal dialysis initiation. Although the low-GDP group had a lower daily UFV, no difficulties in controlling edema were encountered.
Key words: Low-GDP solution, ultrafiltration, solute transport
Peritoneal dialysis (PD) is thought to be a safe and effective treatment in the short term for end-stage renal disease patients. A limitation to long-term PD has been alterations to peritoneal membrane structure and function over time, which cause significant technique failure (1).
Glucose, a widely used osmotic agent in PD, is easily absorbed and therefore associated with a variety of metabolic consequences such as acute hyperglycemia, hyperinsulinemia, dyslipidemia, and eventually weight gain (2). During PD, human peritoneal mesothelial cells (HPMCs) are consistently exposed to bioincompatible dialysate with an acidic pH, high glucose, high osmolarity, and glucose degradation products (GDPs). In animal and in vitro studies, chronic exposure to glucose-based dialysate induced vascular endothelial growth factor and transforming growth factor β, which can cause peritoneal neoangiogenesis and fibrosis (3-7). High glucose, acidic pH, and GDPs in dialysate inhibit phagocytosis of bacteria and other bactericidal activities related to bioincompatibility, further negatively influencing the defense mechanisms of the peritoneum (8). Bioincompatible dialysates cause abnormalities in peritoneal structure in the long term, resulting in loss of peritoneal function. Therefore, to increase biocompatibility, dialysates with a neutral pH and low GDPs have been developed (9,10).
Previous studies have demonstrated that a neutral-pH dialysate low in GDPs allows for preservation of the peritoneum, but investigations into the effects of low-GDP dialysate on ultrafiltration (UF), solute transport, and body fluid management have been limited (9,11,12). To address that issue, we conducted a prospective study to analyze the clinical consequences of low-GDP dialysate with respect to UF, solute transport, and body fluid.
Methods
Patients
Our prospective randomized open-label study enrolled 79 new incident continuous ambulatory PD patients from Yeungnam University Hospital and Kyungpook National University Hospital from April 2001 to December 2003. All patients gave informed consent to participate in the study. The study protocol was approved by the local hospital ethics committees. Exclusion criteria included severe systemic diseases such as liver cirrhosis, systemic lupus erythematosus, rheumatoid arthritis, inflammatory bowel disease, vasculitis, and malignancy.
The patients were randomized into either a lactate-based low-GDP fluid group [Stay•Safe Balance: Fresenius Medical Care, Bad Homburg, Germany (pH 7.0, n = 37)] or a lactate-based high-GDP group [Stay•Safe: Fresenius Medical Care (pH 5.5, n = 42)]. There were no volume or compositional differences between the two dialysis solutions except for the amount of GDPs and the acidity. All patients used the same type of dialysis solution from PD start until month 12. This 12-month protocol was completed by 60 patients (32 in the low-GDP group, 28 in the high-GDP group). Patients were dropped from the analysis mostly because of protocol violations (1 in the low-GDP group, 5 in the high-GDP group), death (2 in the low-GDP group, 8 in the high-GDP group), transfer to hemodialysis (0 in the low-GDP group, 1 in the high-GDP group), or transfer to other centers (2 in the low-GDP group, 0 in the high-GDP group; Figure 1). No patients had any record of peritonitis or exit-site infection in the 4 weeks before the annual biochemical measurements. Secondary end-points included effluent biomarkers of peritoneal membrane inflammation and HPMC mass, and changes in body composition.
Figure 1.
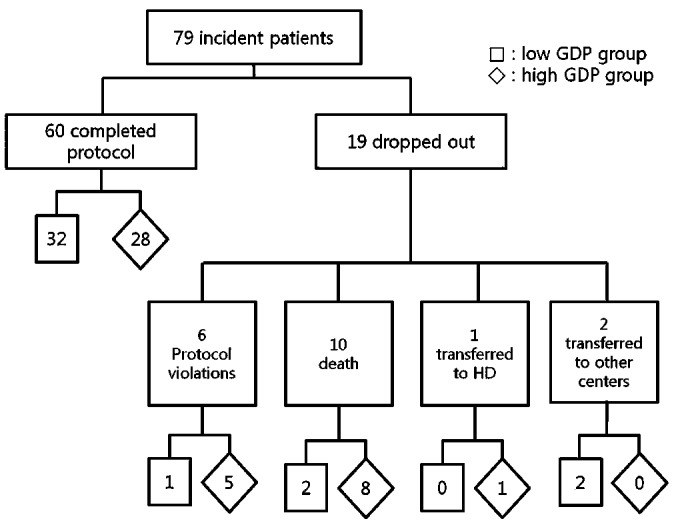
— Summary of patient flow through the study.
Protocol
Clinical indices—including daily urinary volume (UV), daily UF volume (UFV), daily peritoneal glucose absorption, residual renal function (RRF), dialysis adequacy, modified 4.25% peritoneal equilibration test (PET), laboratory blood chemistry, cancer antigen 125 (CA125), and interleukin-6 (IL-6) in overnight effluent—were measured at months 1, 6, and 12 after PD initiation. Body composition was measured by bioelectric impedance analysis (BIA) at months 1 and 12. After blind trocar insertion of a Tenckhoff catheter by a nephrologist, patients had a 1-week break-in period, followed by an increase in the dose of PD from 300 mL to 2000 mL at each dwell 3 times daily for the subsequent week. Results at week 2 after PD initiation were therefore used as the baseline. Patients who did not finish the protocol (except for the BIA exam) were defined as being in violation of the protocol and were therefore excluded from the analysis.
Daily UV, UFV, and Peritoneal Glucose Absorption
The daily 24-hour UV was collected and measured. We also collected 24-hour drained effluent and poured the entire volume into a pre-weighed container. The daily 24-hour UFV was measured as the weight of the drained effluent minus the weight of the container. The daily 24-hour peritoneal glucose absorption was calculated as the infused dialysate volume and glucose concentration during the 24-hour period minus the directly measured volume and glucose concentration of the 24-hour drained effluent.
Calculations of Dialysis Adequacy and Urea Kinetics
Weekly Kt/V urea was calculated from the 24-hour collection of dialysate and urine. The distribution volume of urea, generally assumed to be equal to total body water (TBW), was calculated as V, estimated using the Watson equation (13). Residual renal function was assessed using the urine collection over the same 24-hour period during which effluent was collected; RRF was calculated as the mean of the values for creatinine and urea clearance (14). Dietary protein intake was estimated from the protein equivalent of nitrogen appearance (PNA) using this equation (15):
 |
The urea appearance rate and protein losses were determined from the measured urea and protein excretion in effluent and urine. The daily PNA was normalized (nPNA) to actual body weight (grams per kilogram of body weight).
PET
The modified 4.25% PET (16) was performed with the patient sitting. The previous dwell was drained for 20 minutes, and then with the patient supine, 2.0 L of 4.25% dialysis solution was infused for 10 minutes. The patient rolled from side to side after each quarter of the solution was infused. The time at which the infusion was complete was considered the “zero” dwell time. At 0, 60, and 120 minutes, 200 mL effluent was drained into the effluent bag and mixed by inversion 2 - 3 times, and then, using aseptic technique, a 10-mL sample was withdrawn from the medication port. The remaining 190 mL of effluent was re-infused into the patient. At 240 minutes, with the patient in the sitting position, the effluent was drained for 20 minutes, the bag was mixed by inversion 2 - 3 times, and a 20-mL effluent sample was withdrawn from the medication port. Effluent samples were sent for measurements of glucose, urea, creatinine, and sodium. Venous blood samples drawn at 0, 120, and 240 minutes were assayed for glucose, urea, and creatinine. Creatinine measurements were corrected for the presence of glucose (11).
At the completion of the 4-hour dwell, the dialysate-to-plasma ratio of creatinine (D/P4Cr) was measured. At 1 hour, the dialysate-to-plasma concentration ratio of sodium (D/P1Na) was also measured. Peritoneal glucose absorption during the PET was calculated from the infused dialysate volume and glucose concentration during the PET, minus the directly measured volume and glucose concentration of the drained dialysate.
During the PET, UFV was measured. Before being connected to the patient, the full dialysis bag to be instilled was weighed as the instillation volume. After the complete drain at 4 hours, the drain bag was weighed as the drainage volume, with the flush in and with no compensation for the flush volume. The UFV was calculated as the drain volume minus the instillation volume (11).
Laboratory Blood Chemistry
After an overnight fast, blood samples for analysis of urea, creatinine, glucose, albumin, and C-reactive protein were taken and analyzed.
IL-6 and CA125 in Overnight Dialysate Effluent
The overnight dialysate effluent was collected and assayed for IL-6, a cytokine secreted from HPMCs, and CA125, a factor representative of the volume of HPMCs.
Bioimpedance Analysis
Measurement of body composition by BIA was performed at months 1 and 12 in 26 patients. The BIA measurements were carried out using a segmental multi-frequency bioelectric impedance analyzer (Inbody 2.0/4.0: Biospace, Seoul, Korea), with 8 skin electrodes placed on the patient’s hands and feet, with the patient in the standing position. The analyzer measures body impedance at 6 frequencies ranging from 1 kHz to 1000 kHz. Body weight, TBW, extracellular fluid, lean body mass, and fat mass were measured after the dialysate was drained. To avoid the effect of dialysate in the peritoneal cavity on the results, the BIA was always performed after final drainage in the 4.25% modified PET.
Statistical Analysis
Changes over time were compared using the paired t-test, and differences between the groups were compared using the independent t-test, repeated measures analysis of variance, and the Fisher exact test (SPSS version 17.0: SPSS, Chicago, IL, USA). Factors affecting the dependent variables were assessed by multiple regression analysis. Values are presented as mean ± standard deviation, and p values below 0.05 were considered significant.
Results
Baseline Characteristics
Of the 60 analyzed patients, 28 (47%) were women, and 29 (48%) had diabetes. Mean age at study entry was 51.4 ± 13.1 years. At week 2 of dialysis (baseline), there were no differences in parameters between the groups (Table 1). Also at week 2 in the study, we included 2 anuric patients in the high-GDP group. At baseline, the numbers of patients using diuretics and angiotensin converting-enzyme inhibitors (ACEIs) or angiotensin II receptor blockers (ARBs) at week 2 were not significantly different between the groups [26 (81.3%) vs 22 (76.6%), and 31 (96.9%) vs 26 (92.9%) respectively, Table 1].
TABLE 1.
Clinical and Demographic Characteristics at Week Two (Baseline)
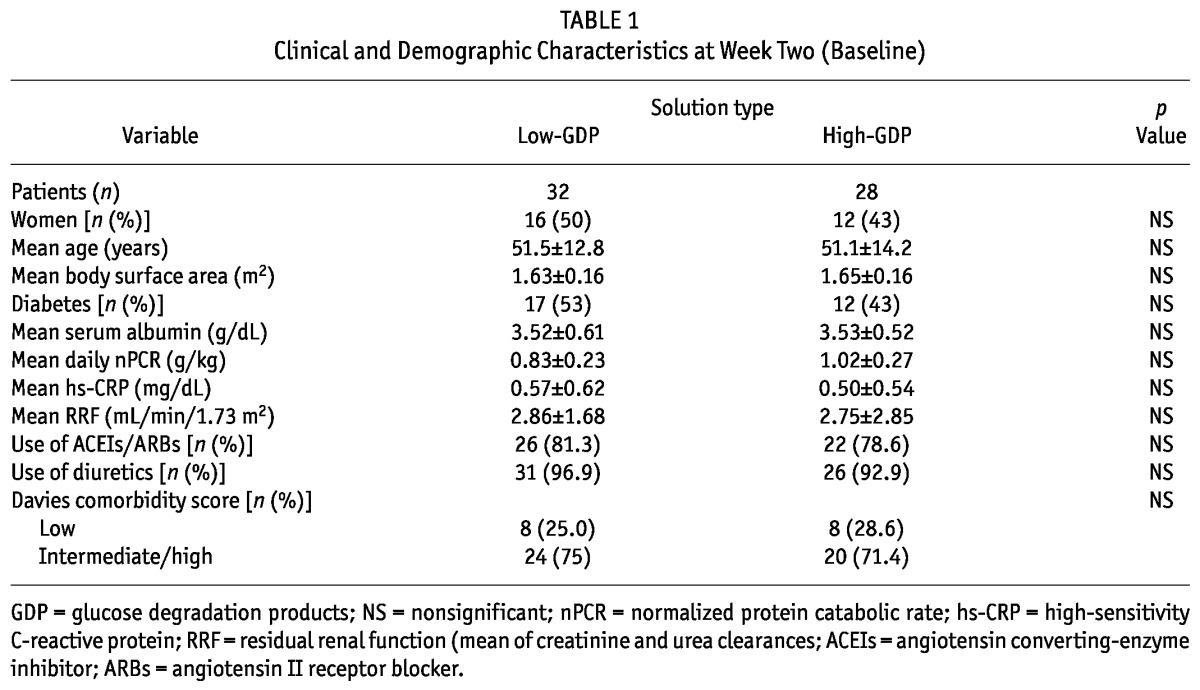
We observed no differences between the low-GDP group and the high-GDP group in glomerular filtration rate (3.08 ± 2.88 mL/min/1.73 m2 vs 2.49 ± 1.72 mL/min/1.73 m2) and serum creatinine (7.16 ± 2.37 mg/dL vs 7.03 ± 2.36 mg/dL) before initiation of PD.
Dialysis Adequacy, Urea Kinetics, and Clinical Indices
Table 2 shows results for dialysis adequacy, urea kinetics, and clinical indices.
TABLE 2.
Comparison of Clinical Indices Between the Study Groupsa
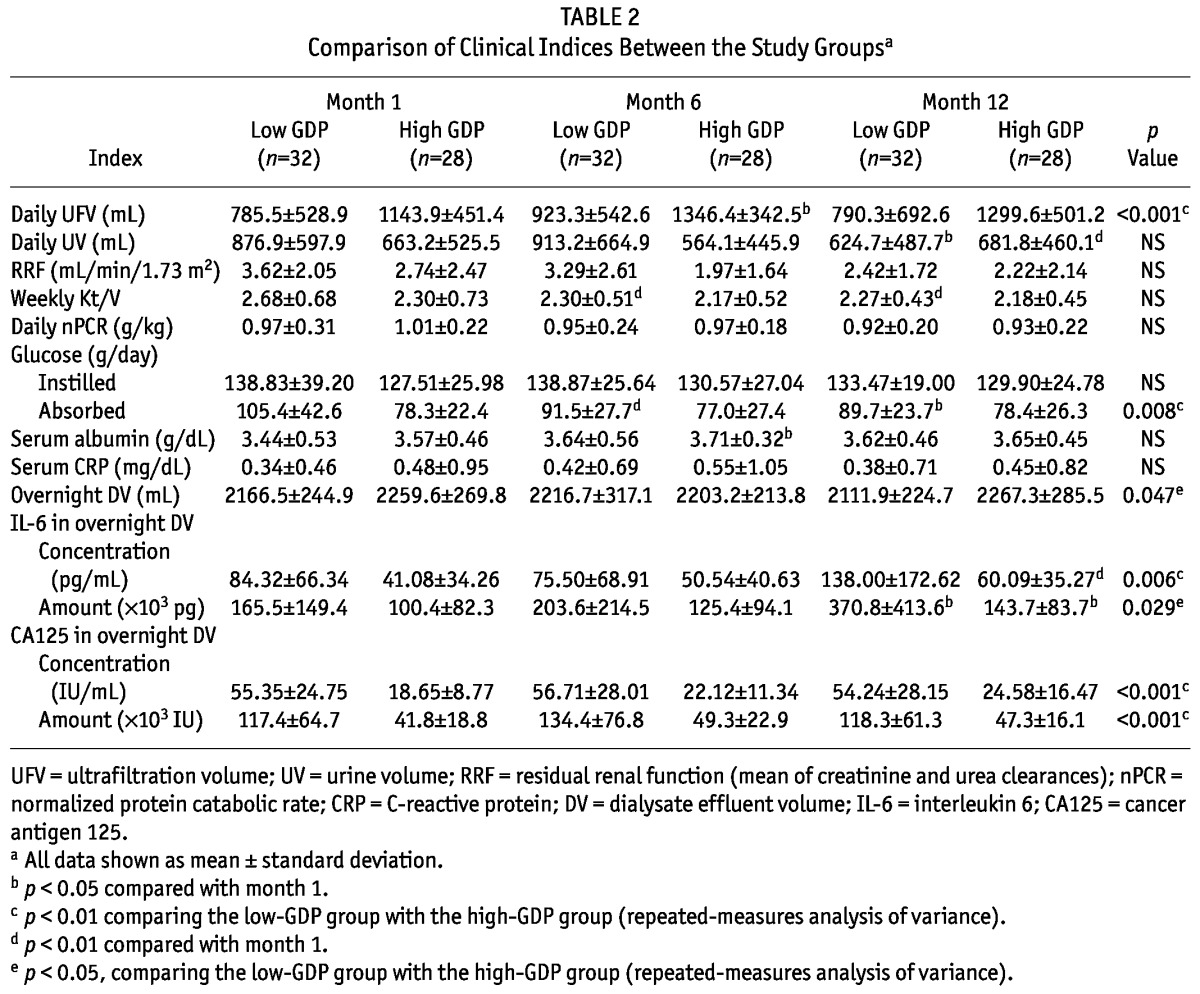
Compared with the high-GDP group, the low-GDP group showed a tendency toward a higher RRF, but the difference did not reach statistical significance except at month 6. The low-GDP group had a higher daily UV at month 6. At months 1, 6, and 12, the daily UFV was higher in the high-GDP group than in the low-GDP group. The daily UFV increased over time by about 14% in the high-GDP group; it did not change in the low-GDP group.
Compared with the high-GDP group, the low-GDP group showed a tendency toward a higher daily total amount of glucose in instilled dialysate, but the difference did not reach statistical significance. Over time, the daily total amount of glucose in instilled dialysate increased slightly in the high-GDP group; in the low GDP group, it decreased slightly. At months 1, 6, and 12, the low-GDP group (compared with the high GDP group) showed a higher amount of daily peritoneal glucose absorption. The amount of daily peritoneal glucose absorption declined significantly over time by about 15% in the low-GDP group; glucose absorption did not change in the high-GDP group.
No differences in nPCR were observed between the groups.
PET
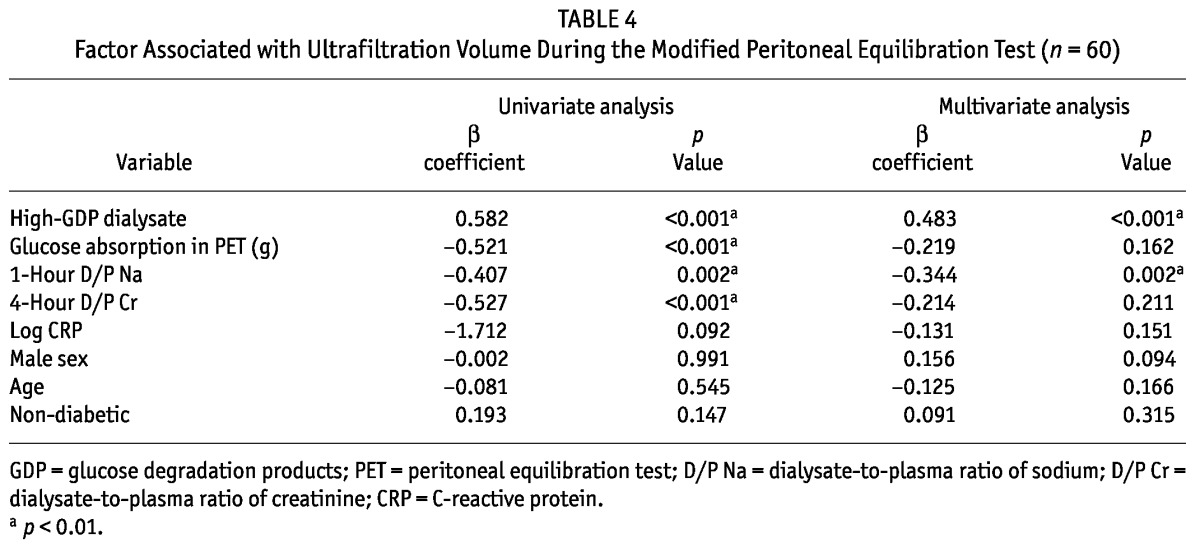
No differences were evident between the groups in the D/P4Cr and D/P1Na during the PET at months 1 and 6 (Table 3). However, during the PET, the drained dialysate volume was lower by 7%, 7.6%, and 6.5% in the low-GDP group than in the high-GDP group at months 1, 6, and 12 respectively {Table 3, Figure 2(A); calculation: [drained dialysate volumehigh-GDP (mL) - drained dialysate volumelow-GDP (mL)] × 100 /drained dialysate volumehigh-GDP (mL)}. During the PET, glucose absorption was higher by 8%, 8.1% and 7.1% in the low-GDP group than in the high-GDP group at months 1, 6, and 12 respectively {Table 3, Figure 2(B); calculation: [glucose absorptionlow-GDP (g) - glucose absorptionhigh-GDP (g)] × 100 / glucose absorptionlow-GDP (g)}. During the PET, UFV increased in both groups over time, but without statistical significance [Table 3, Figure 2(A)]. Also, UFV during the PET was negatively correlated with glucose absorption, D/P1Na, and IL-6 concentration in effluent. In the multiple regression analysis, the factors associated with UFV during a PET were high-GDP dialysate and D/P1Na in effluent (Table 4).
TABLE 3.
Results During the Modified Peritoneal Equilibration Test for the Study Groupsa
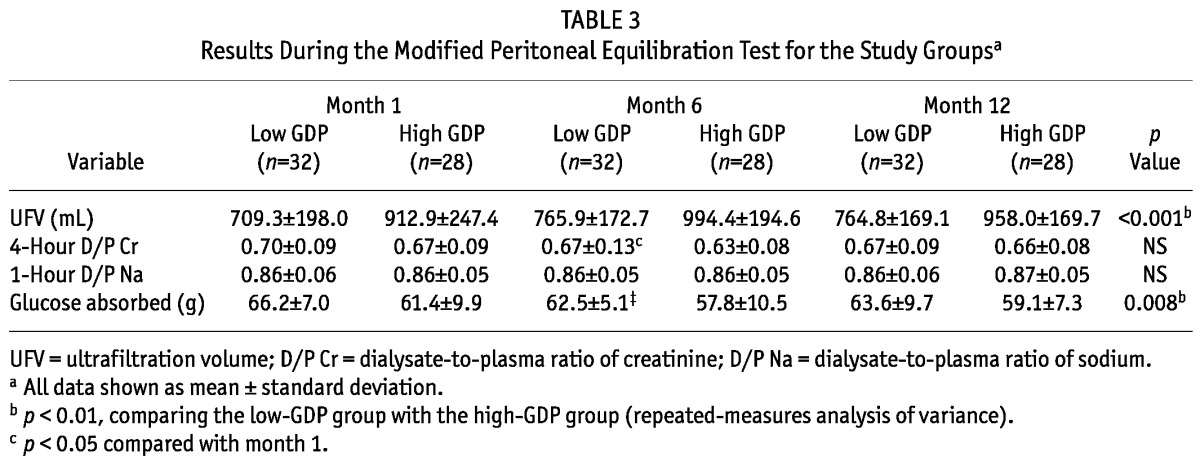
Figure 2.
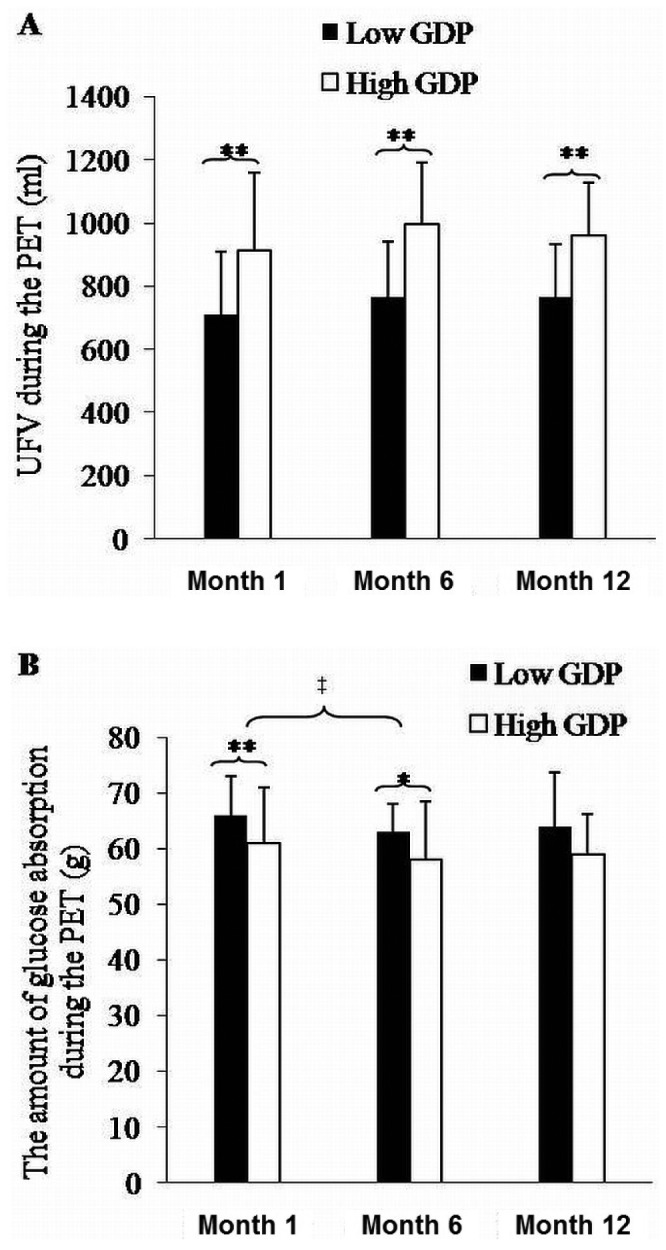
— Data from the modified peritoneal equilibration test (PET) for the low-glucose degradation product [GDP (filled bars, n = 32)] and high-GDP groups (open bars, n = 28). (A) Ultrafiltration volume (UFV) during the modified PET. (B) Glucose absorption during the modified 4.25% PET. * p < 0.05 and ** p < 0.01 comparing the low-GDP group with the high-GDP group. ‡ p < 0.01 compared with month 1.
TABLE 4.
Factor Associated with Ultrafiltration Volume During the Modified Peritoneal Equilibration Test (n = 60)
Blood Chemistry, IL-6, and CA125 in Overnight Effluent
Table 2 shows results for blood chemistry, IL-6, and CA125 in overnight effluent. We observed no differences in serum albumin and C-reactive protein between the groups. The concentration of IL-6 in overnight effluent at months 1 and 12 was higher in the low-GDP group than in the high-GDP group. The concentration of CA125 in overnight effluent at months 1, 6, and 12 was higher in the low-GDP group than in the high-GDP group. There were no differences between the groups in overnight effluent volume.
BIA
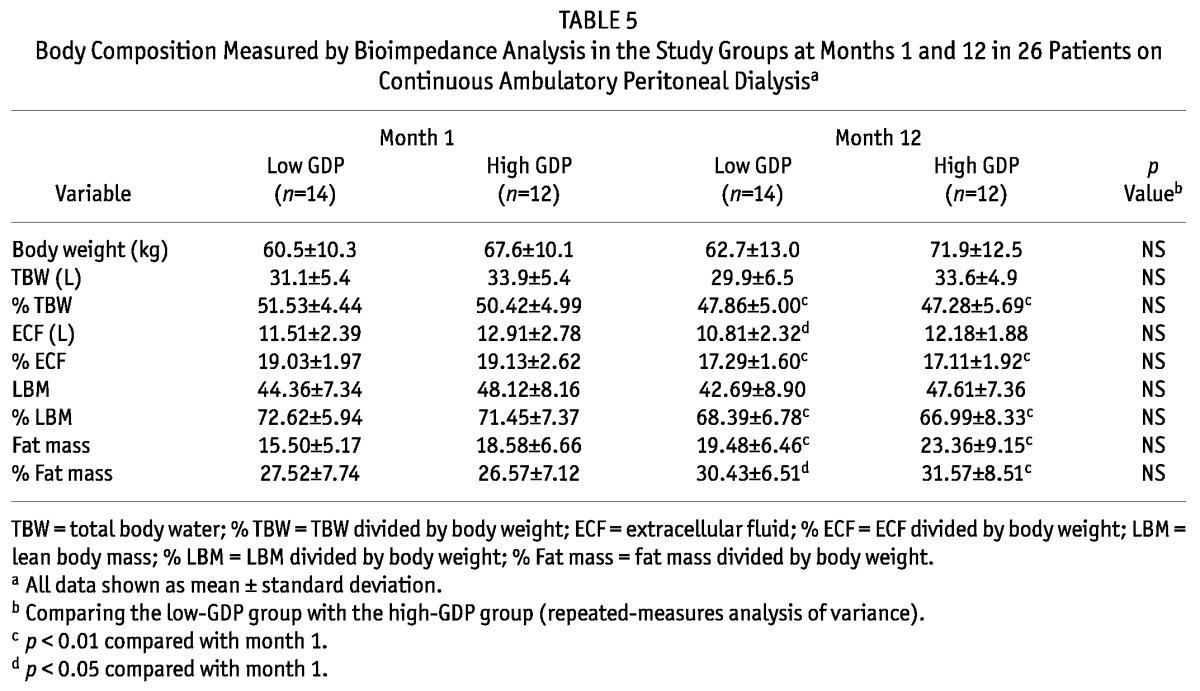
Table 5 shows results for the BIA examinations. No significant differences were evident in body weight, TBW, percentage TBW, extracellular fluid volume, percentage extracellular fluid volume, lean body mass, percentage lean body mass, fat mass, and percentage fat mass between the groups. Compared with the high-GDP group, the low-GDP group showed lower body weight, fat mass, and percentage fat mass, but the differences did not reach statistical significance. Fat mass and percentage fat mass increased over time in both groups. Percentage TBW and percentage lean body mass declined over time in both groups. Hypervolemia similarly improved over time in both groups.
TABLE 5.
Body Composition Measured by Bioimpedance Analysis in the Study Groups at Months 1 and 12 in 26 Patients on Continuous Ambulatory Peritoneal Dialysisa
The Use of ACEIS/ARBS and Diuretics
Among patients who were initially prescribed ACEIs or ARBs, the number whose dose of ACEI or ARB increased over time was not significantly different between the low-GDP group and the high-GDP group [n = 1 (3.8%) vs n = 4 (18.2%)]. Also, among patients who initially used diuretics, the number whose dose of diuretics increased over time was not different between the groups [n = 5 (16.1%) vs n = 8 (30.8%)].
Discussion
Glucose degradation products, which are produced during heat sterilization and storage of PD solution, can lead to peritoneal membrane damage by promoting the formation of advanced glycation end-products in the peritoneum (17).
Some debate surrounds the effect of biocompatible PD solutions on the peritoneal solute transport rate and peritoneal UF (18). Williams et al. (9) reported that transport of small molecules, represented by the D/P Cr, increased in a low-GDP group (Stay•Safe Balance). It has been suggested that vasoactive substances may influence blood flow or the permeability of the peritoneal vascular bed (9,19,20). Fang et al. (11) reported that, compared with a high-GDP exchange, a single exchange of low-GDP solution (Physioneal: Baxter Healthcare Corporation, Deerfield, IL, USA) resulted in a lower UFV and similar solute transport during a 2.5% glucose PET. Kim et al. (18) reported that an increased D/P Cr (and consequently, a lower UFV) in a low-GDP group (Stay•Safe Balance) might provide a lower risk of intravascular volume depletion and a higher probability of RRF preservation. In contrast, during a 1-year period, Fan et al. (21) reported observing no significant differences between a low-GDP (Physioneal and Stay•Safe Balance) and a high-GDP group [Dianeal (Baxter Healthcare) and Stay•Safe] for UFV and solute transport (D/P4Cr) in a prospective randomized controlled study. During a 1-year period in randomized incident PD patients, Szeto et al. (12) also reported observing no differences between a low-GDP (Stay•Safe Balance) and a high-GDP group (Stay•Safe) in daily UFV, daily UV, and dialysis adequacy indices. We demonstrated a lower daily UFV and a higher daily glucose absorption in the low-GDP group. Although the D/P4Cr and D/P1Na during the PET were not different between the groups in the present study, the amount of peritoneal glucose absorption was higher and the UFV during the PET was lower in the low-GDP group than in the high-GDP group. We speculate that, in the low-GDP group, more fluid and glucose (6% - 8%) are moved from the peritoneal cavity by another pathway. The difference in the lymphatic absorption rate may have caused the lower UFV in the low-GDP group in our study. However, a limitation of our study is that we did not measure free water transport and the amount of lymphatic absorption. Further investigation is necessary to verify the mechanism of the differences in UFV during the PET.
A few studies have reported that low-GDP dialysis solution may help to preserve RRF, but the underlying mechanism remains unclear (22,23). During PD, GDPs also may be absorbed through the peritoneal membrane into the systemic circulation, promoting apoptosis in the renal tubular epithelial cells (24). Several studies have suggested that, by reduction of GDPs and advanced glycation end-products in the systemic circulation, low-GDP solution better preserves RRF in continuous ambulatory PD patients (18,25,26). Excessive UF also may play a causative role in the decline of RRF by provoking intravascular volume depletion (27,28). However, a few studies reported no benefit for RRF preservation with low-GDP solution in PD patients during a 1-year period (12,21). Our data showed a higher tendency of RRF maintenance in the low-GDP group than in the high-GDP group, but that tendency did not reach statistical significance except at month 6 (Table 2).
In the present study, fat mass and percentage fat mass increased over time in both groups. Also, body weight and percentage fat mass showed a higher—but not statistically significant—increasing trend in the high-GDP group in than the low GDP group during year 1. Hypervolemia was equally improved in both groups over time. Compared with the high-GDP group, the low-GDP group also had a higher daily UV at month 6. The lack of a difference in edema control can be explained by the fact that UV or the use of high glucose dialysate was well maintained, although the low-GDP group had a lesser daily UFV.
Generally, neutral-pH dialysates low in GDPs are known to contribute to the survival and proliferation of HPMCs (29,30). Pecoits-Filho et al. (31) reported that various cytokines such as IL-6 and vascular endothelial growth factor are secreted by HMPCs. The increase of IL-6 in effluent is related to the increase in vascular endothelial growth factor, and peritoneal transport increases via those cytokines (31). During the peritoneal inflammatory response, the intraperitoneal action of IL-6 is particularly regulated by HPMCs (32). Several studies have reported that the intraperitoneal cellular responses to low-GDP solution lead to lower effluent levels of IL-6 that are seen with high-GDP solution, suggesting a reduced inflammatory response (33). On the other hand, Kim et al. (18) reported observing no differences in effluent IL-6 levels between two such groups. The present study also demonstrated higher IL-6 and CA125 concentrations and a low daily UFV in a low-GDP group compared with a high-GDP group, indicating that, as the number of HPMCs in the low-GDP group increased, secretion of IL-6 increased as well. Szeto et al. (12) also reported that the use of low-GDP solution resulted in a lower degree of systemic inflammation. The speculation is that IL-6 could have a proinflammatory role, but also an anti-inflammatory role.
In the current study, we observed no difference in serum C-reactive protein between the groups over time.
Conclusions
In the present study, the high-GDP group (compared with a low-GDP group) showed a higher daily UFV and higher daily peritoneal glucose absorption even with lower total daily glucose in the instilled dialysate. This situation could potentially lead to relative hypovolemia with higher daily UFV in the high-GDP group, especially in the early period of PD initiation. Although the low-GDP group had lower daily UFV, controlling edema was not a problem. Further study to elucidate the mechanism underlying the difference in UFV during PETs with a similar D/P4Cr and D/P1Na is warranted.
Disclosures
The authors declare that they have no financial conflicts of interest.
References
- 1. Chaudhary K, Khanna R. Biocompatible peritoneal dialysis solutions: do we have one? Clin J Am Soc Nephrol 2010; 5:723–32 [DOI] [PubMed] [Google Scholar]
- 2. Grodstein GP, Blumenkrantz MJ, Kopple JD, Moran JK, Coburn JW. Glucose absorption during continuous ambulatory peritoneal dialysis. Kidney Int 1981; 19:564–7 [DOI] [PubMed] [Google Scholar]
- 3. Leung JC, Chan LY, Tam KY, Tang SC, Lam MF, Cheng AS, et al. Regulation of CCN2/CTGF and related cytokines in cultured peritoneal cells under conditions simulating peritoneal dialysis. Nephrol Dial Transplant 2009; 24:458–69 [DOI] [PubMed] [Google Scholar]
- 4. Mandl-Weber S, Cohen CD, Haslinger B, Kretzler M, Sitter T. Vascular endothelial growth factor production and regulation in human peritoneal mesothelial cells. Kidney Int 2002; 61:570–8 [DOI] [PubMed] [Google Scholar]
- 5. Washida N, Wakino S, Tonozuka Y, Homma K, Tokuyama H, Hara Y, et al. Rho-kinase inhibition ameliorates peritoneal fibrosis and angiogenesis in a rat model of peritoneal sclerosis. Nephrol Dial Transplant 2011; 26:2770–9 [DOI] [PubMed] [Google Scholar]
- 6. Kang DH, Hong YS, Lim HJ, Choi JH, Han DS, Yoon KI. High glucose solution and spent dialysate stimulate the synthesis of transforming growth factor β1 of human peritoneal mesothelial cells: effect of cytokine costimulation. Perit Dial Int 1999; 19:221–30 [PubMed] [Google Scholar]
- 7. Margetts PJ, Kolb M, Galt T, Hoff CM, Shockley TR, Gauldie J. Gene transfer of transforming growth factor-β1 to the rat peritoneum: effects on membrane function. J Am Soc Nephrol 2001; 12:2029–39 [DOI] [PubMed] [Google Scholar]
- 8. Sitter T, Sauter M. Impact of glucose in peritoneal dialysis: saint or sinner? Perit Dial Int 2005; 25:415–25 [PubMed] [Google Scholar]
- 9. Williams JD, Topley N, Craig KJ, Mackenzie RK, Pischetsrieder M, Lage C, et al. The Euro-Balance Trial: the effect of a new biocompatible peritoneal dialysis fluid (Balance) on the peritoneal membrane. Kidney Int 2004; 66:408–18 [DOI] [PubMed] [Google Scholar]
- 10. Lee HY, Park HC, Seo BJ, Do JY, Yun SR, Song HY, et al. Superior patient survival for continuous ambulatory peritoneal dialysis patients treated with a peritoneal dialysis fluid with neutral pH and low glucose degradation product concentration (Balance). Perit Dial Int 2005; 25:248–55 [PubMed] [Google Scholar]
- 11. Fang W, Mullan R, Shah H, Mujais S, Bargman JM, Oreopoulos DG. Comparison between bicarbonate/lactate and standard lactate dialysis solution in peritoneal transport and ultrafiltration: a prospective, crossover single-dwell study. Perit Dial Int 2008; 28:35–43 [PubMed] [Google Scholar]
- 12. Szeto CC, Chow KM, Lam CW, Leung CB, Kwan BC, Chung KY, et al. Clinical biocompatibility of a neutral peritoneal dialysis solution with minimal glucose-degradation products—a 1-year randomized control trial. Nephrol Dial Transplant 2007; 22:552–9 [DOI] [PubMed] [Google Scholar]
- 13. Watson PE, Watson ID, Batt RD. Total body water volumes for adult males and females estimated from simple anthropometric measurements. Am J Clin Nutr 1980; 33:27–39 [DOI] [PubMed] [Google Scholar]
- 14. Kim SG, Kim S, Hwang YH, Kim K, Oh JE, Chung W, et al. Could solutions low in glucose degradation products preserve residual renal function in incident peritoneal dialysis patients? A 1-year multicenter prospective randomized controlled trial (Balnet Study). Perit Dial Int 2008; 28(Suppl 3):S117–22 [PubMed] [Google Scholar]
- 15. Bergström J, Heimbürger O, Lindholm B. Calculation of the protein equivalent of total nitrogen appearance from urea appearance. Which formulas should be used? Perit Dial Int 1998; 18:467–73 [PubMed] [Google Scholar]
- 16. Mujais S, Nolph K, Gokal R, Blake P, Burkart J, Coles G, et al. Evaluation and management of ultrafiltration problems in peritoneal dialysis. International Society for Peritoneal Dialysis Ad Hoc Committee on Ultrafiltration Management in Peritoneal Dialysis. Perit Dial Int 2000; 20(Suppl 4):S5–21 [PubMed] [Google Scholar]
- 17. Millar DJ, Holmes C, Faict D, Dawnay A. Comparison of in vitro AGE formation between standard PD fluid and a novel bicarbonate/lactate formulation. Adv Perit Dial 1998; 14:191–4 [PubMed] [Google Scholar]
- 18. Kim S, Oh J, Kim S, Chung W, Ahn C, Kim SG, et al. Benefits of biocompatible PD fluid for preservation of residual renal function in incident CAPD patients: a 1-year study. Nephrol Dial Transplant 2009; 24:2899–908 [DOI] [PubMed] [Google Scholar]
- 19. Combet S, Miyata T, Moulin P, Pouthier D, Goffin E, Devuyst O. Vascular proliferation and enhanced expression of endothelial nitric oxide synthase in human peritoneum exposed to long-term peritoneal dialysis. J Am Soc Nephrol 2000; 11:717–28 [DOI] [PubMed] [Google Scholar]
- 20. Steinhauer HB, Schollmeyer P. Prostaglandin-mediated loss of proteins during peritonitis in continuous ambulatory peritoneal dialysis. Kidney Int 1986; 29:584–90 [DOI] [PubMed] [Google Scholar]
- 21. Fan SL, Pile T, Punzalan S, Raftery MJ, Yaqoob MM. Randomized controlled study of biocompatible peritoneal dialysis solutions: effect on residual renal function. Kidney Int 2008; 73:200–6 [DOI] [PubMed] [Google Scholar]
- 22. Liao CT, Chen YM, Shiao CC, Hu FC, Huang JW, Kao TW, et al. Rate of decline of residual renal function is associated with all-cause mortality and technique failure in patients on long-term peritoneal dialysis. Nephrol Dial Transplant 2009; 24:2909–14 [DOI] [PubMed] [Google Scholar]
- 23. Davies SJ. Preserving residual renal function in peritoneal dialysis: volume or biocompatibility? Nephrol Dial Transplant 2009; 24:2620–2 [DOI] [PubMed] [Google Scholar]
- 24. Justo P, Sanz AB, Egido J, Ortiz A. 3,4-Dideoxyglucosone-3-ene induces apoptosis in renal tubular epithelial cells. Diabetes 2005; 54:2424–9 [DOI] [PubMed] [Google Scholar]
- 25. Schmitt CP, von Heyl D, Rieger S, Arbeiter K, Bonzel KE, Fischbach M, et al. Reduced systemic advanced glycation end products in children receiving peritoneal dialysis with low glucose degradation product content. Nephrol Dial Transplant 2007; 22:2038–44 [DOI] [PubMed] [Google Scholar]
- 26. Zeier M, Schwenger V, Deppisch R, Haug U, Weigel K, Bahner U, et al. Glucose degradation products in PD fluids: do they disappear from the peritoneal cavity and enter the systemic circulation? Kidney Int 2003; 63:298–305 [DOI] [PubMed] [Google Scholar]
- 27. Konings CJ, Kooman JP, Gladziwa U, van der Sande FM, Leunissen KM. A decline in residual glomerular filtration during the use of icodextrin may be due to underhydration. Kidney Int 2005; 67:1190–1 [DOI] [PubMed] [Google Scholar]
- 28. Konings CJ, Kooman JP, Schonck M, Gladziwa U, Wirtz J, van den Wall Bake AW, et al. Effect of icodextrin on volume status, blood pressure and echocardiographic parameters: a randomized study. Kidney Int 2003; 63:1556–63 [DOI] [PubMed] [Google Scholar]
- 29. Witowski J, Bender TO, Wisniewska-Elnur J, Ksiazek K, Passlick-Deetjen J, Breborowicz A, et al. Mesothelial toxicity of peritoneal dialysis fluids is related primarily to glucose degradation products, not to glucose per se. Perit Dial Int 2003; 23:381–90 [PubMed] [Google Scholar]
- 30. Witowski J, Korybalska K, Wisniewska J, Breborowicz A, Gahl GM, Frei U, et al. Effect of glucose degradation products on human peritoneal mesothelial cell function. J Am Soc Nephrol 2000; 11:729–39 [DOI] [PubMed] [Google Scholar]
- 31. Pecoits-Filho R, Araújo MR, Lindholm B, Stenvinkel P, Abensur H, Romão JE, Jr, et al. Plasma and dialysate IL-6 and VEGF concentrations are associated with high peritoneal solute transport rate. Nephrol Dial Transplant 2002; 17:1480–6 [DOI] [PubMed] [Google Scholar]
- 32. Pecoits-Filho R, Carvalho MJ, Stenvinkel P, Lindholm B, Heimbürger O. Systemic and intraperitoneal interleukin-6 system during the first year of peritoneal dialysis. Perit Dial Int 2006; 26:53–63 [PubMed] [Google Scholar]
- 33. Cooker LA, Luneburg P, Holmes CJ, Jones S, Topley N. on behalf of the Bicarbonate/Lactate Study Group Interleukin-6 levels decrease in effluent from patients dialyzed with bicarbonate/lactate-based peritoneal dialysis solutions. Perit Dial Int 2001; 21(Suppl 3):S102–7 [PubMed] [Google Scholar]


