Abstract
♦ Background: The Geriatric Nutritional Risk Index (GNRI) might be a useful screening tool for malnutrition in dialysis patients. However, data concerning the GNRI as a prognostic factor in peritoneal dialysis (PD) patients are scarce.
♦ Methods: We reviewed the medical records at Yeungnam University Hospital in Korea to identify all adults (>18 years) who received PD; 486 patients were enrolled in the study.
♦ Results: The initial low, middle, and high GNRI tertiles included 162, 166, and 158 patients respectively. Significant correlations were noted between the initial GNRI and body mass index, creatinine, albumin, arm circumference, fat mass index, and comorbidities. The cut-off value for the time-averaged GNRI over 1 year was 96.4, and the sensitivity and specificity for a diagnosis of a decline in lean mass were 77.1% and 40.0% respectively. A multivariate analysis adjusted for age, risk according to the Davies comorbidity index, and C-reactive protein showed that an low initial GNRI tertile was associated with mortality in PD patients.
♦ Conclusions: The GNRI is a simple method for predicting nutrition status and clinical outcome in PD patients.
Key words: Geriatric Nutritional Risk Index, prognostic factor, nutrition, lean mass
Malnutrition is one of the most common complications encountered in dialysis patients. Depending on the method used to assess nutrition status, the prevalence of malnutrition ranges from 18% to 70% in maintenance dialysis patients (1). Development of malnutrition is associated with dialysis-related factors such as bioincompatibility and unrelated factors such as comorbidities (1,2). Furthermore, studies have linked malnutrition with prognosis in dialysis patients (1-4).
The methods for evaluating nutrition status in dialysis patients involve the use of biochemical markers, creatinine kinetics, anthropometric measurements, body composition analyses, and questionnaires (1,2). Biochemical markers such as albumin are the most commonly used markers of nutrition in dialysis patients; however, those markers are affected by various conditions—for example, inflammation and hydration status (1,5). Anthropometric measurements such as body mass index (BMI) cannot distinguish between lean mass and fat or bone (6). Measurement of body composition provides an objective assessment, but it requires expensive equipment.
Bouillanne et al. (7) first reported the validity of the Geriatric Nutritional Risk Index (GNRI) for malnutrition screening in elderly patients. The GNRI has both anthropometric and biochemical components (7-9). Some studies demonstrated the usefulness of the GNRI as a new marker for malnutrition screening in dialysis patients (8,9). However, few reports have assessed the effectiveness of the GNRI as a prognostic factor in peritoneal dialysis (PD) patients. The aim of the present study was to evaluate the clinical relevance and usefulness of the GNRI as a prognostic factor in PD patients.
Methods
Selection of Patients
We reviewed the medical records at Yeungnam University Hospital in Korea and identified all adults (>18 years of age) who underwent PD between January 1997 and May 2011. All patients whose records lacked the information necessary for an evaluation of the GNRI were excluded. The remaining 486 patients were enrolled into the study, which was approved by the Institutional Review Board of Yeungnam University Hospital. The board waived the need for informed consent.
Clinical Information
The clinical and laboratory data collected 1 month after PD initiation included age, sex, underlying disease, BMI, serum creatinine, serum albumin, C-reactive protein (CRP), residual renal function (RRF), arm circumference (AC), arm muscle circumference (AMC), weekly Kt/V, lean mass index, and fat mass index. Serum albumin and CRP were measured on an Olympus AU5400 automated chemical analyzer (Olympus, Center Valley, PA, USA) using the bromocresol green method for albumin. Anthropometric measurements were obtained by two trained nurses. Multi-frequency bioimpedance analysis (In-Body 4.0; Biospace, Seoul, Korea) was also used to measure AC and AMC, calculated using regression equations. The measurements of AMC and AC were significantly correlated between the bioimpedance and anthropometric methods (r = 0.942 for AC and r = 0.909 or AMC, using data for 626 patients from Biospace).
Lean and fat masses were measured using a dual-energy X-ray absorptiometry (DEXA) apparatus (Hologic, Bedford, MA, USA). At the time of body composition measurement, the patients had no pitting or pulmonary edema and lacked symptoms and signs of dehydration on the basis of history, physical examination, and chest radiography. Patients were measured after dialysate drainage. Among the study patients, 351 underwent follow-up DEXA 12 months after PD initiation. The lean and fat mass indexes were calculated by dividing the lean or fat mass in kilograms by the patient’s height in meters squared. A significant decrease in lean mass was defined as a greater-than-10% decline from the baseline lean mass index over 1 year (10). Patients whose lean mass index was maintained or improved at 1 year compared with their initial lean mass index were defined not having a decline in lean mass index. Dialysis modality during follow-up was recorded.
The mean values of laboratory findings over 1 year were used as time-averaged (TA) data. Comorbidities were graded according to the Davies index (11): ischemic heart disease, peripheral vascular disease, left ventricular dysfunction, diabetes mellitus (DM), systemic collagen vascular disease, and other significant pathologies. As previously described, comorbidities by the Davies index were categorized as low risk (0), intermediate risk (1-2), or high risk (≥3).
The GNRI was calculated on the basis of serum albumin and body weight as follows:
 |
Ideal body weight was calculated using Lorentz equations (12). The ratio of body weight to ideal body weight was set at 1 when body weight exceeded ideal body weight (7-9). Patients were divided into groups based on tertiles of their initial GNRI scores: low tertile (<89.6), middle tertile (89.6-96.3), and high tertile (>96.3).
Statistical Analyses
The data were analyzed using the SPSS software application (version 19: SPSS, Chicago, IL, USA). The distribution of continuous variables was checked using the Kolmogorov-Smirnov test. Normally distributed variables are expressed as mean ± standard deviation and were compared using a t-test or one-way analysis of variance. Nonparametric variables are expressed as medians and ranges and were compared using the Mann-Whitney or Kruskal-Wallis test. Categorical variables are expressed as counts and percentages. A Pearson chi-square or Fisher exact test was used to analyze categorical variables. Discrimination, which is a model’s ability to differentiate between patients whose lean mass index was maintained or increased and those whose index declined, was examined using the area under the receiver operating characteristic curve (AUROC). The AUROC analysis was also performed to calculate cut-off values, sensitivity, and specificity. The cut-off risk point was defined based on the highest sensitivity (1-specificity) value in the AUROC. The AUROC was calculated using the MedCalc software application (version 11.6.1.0: Medcalc, Mariakerke, Belgium). Survival estimates were calculated using Kaplan-Meier and Cox regression analyses. The p values for the comparison of survival curves were determined by log-rank test. The level of statistical significance was set at p < 0.05.
Results
Baseline Characteristics One Month After PD Initiation
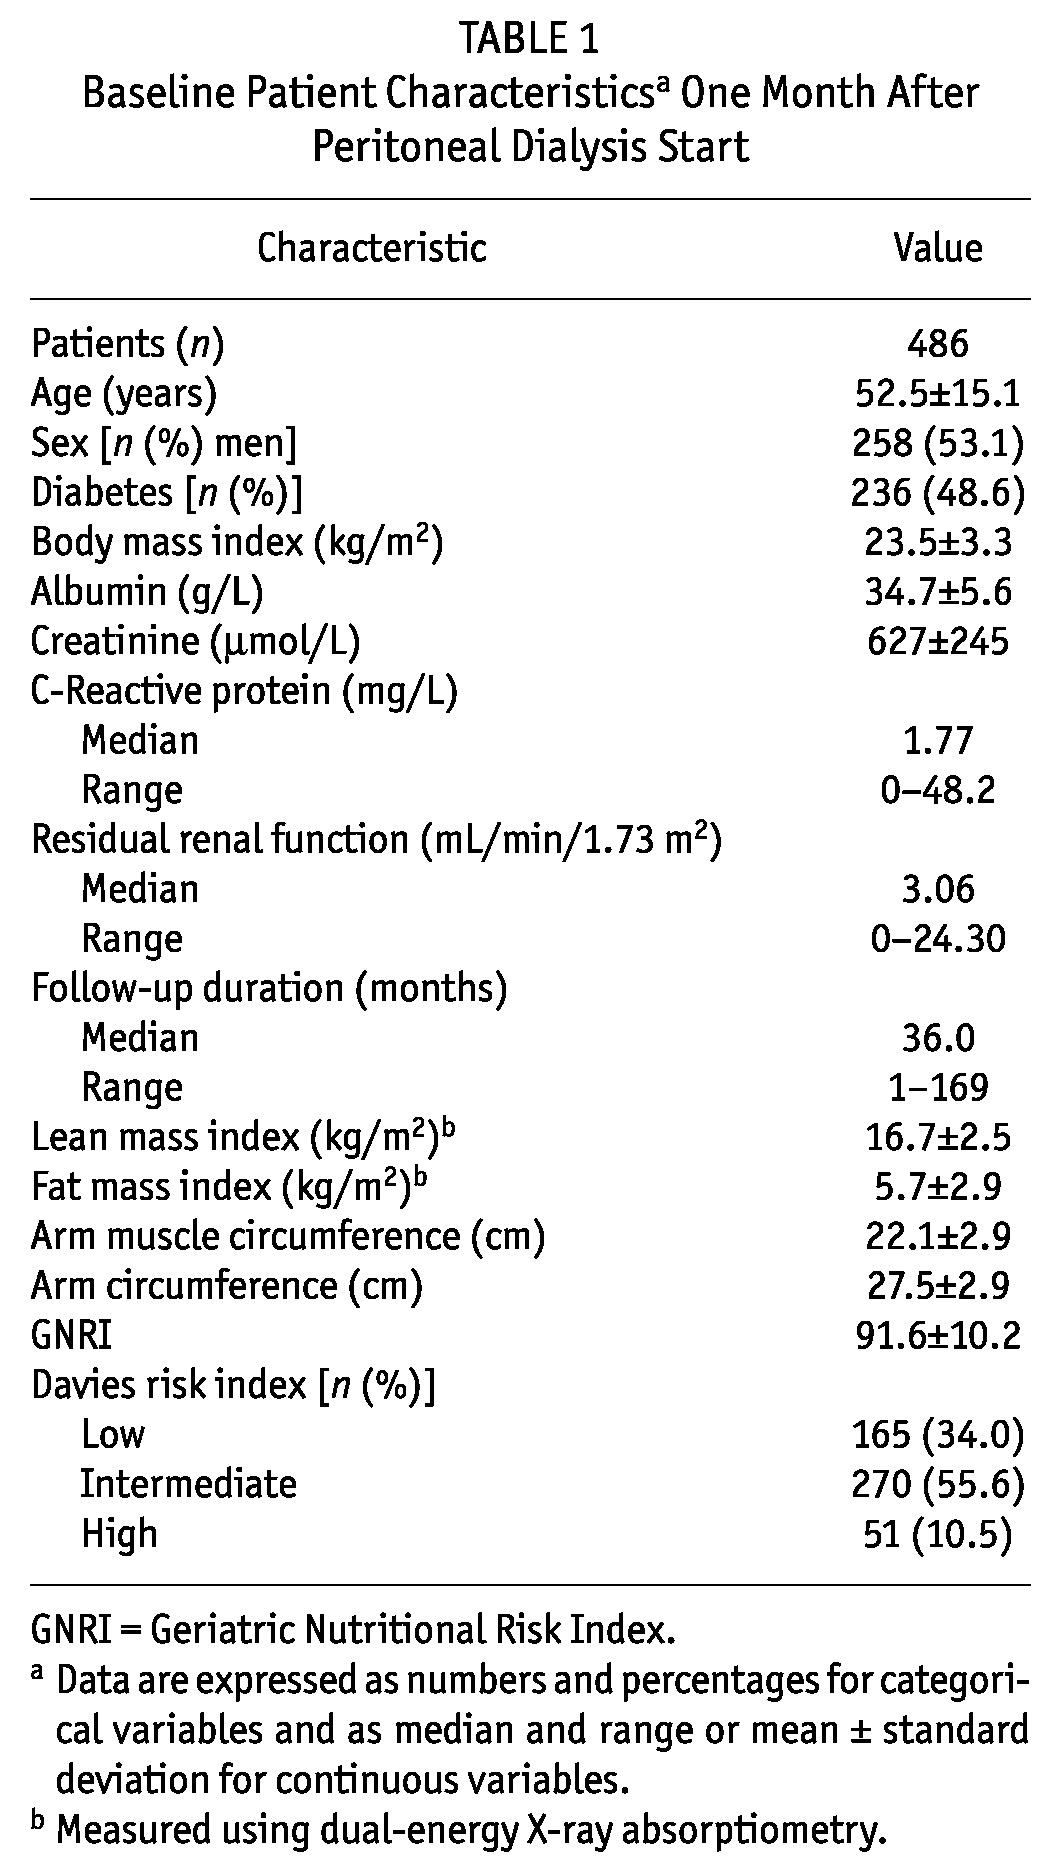
In the study cohort, mean age at PD start was 52.5 ± 15.1 years (Table 1). In the study population, men predominated (53.1%). The median follow-up was 36.0 months (range: 1 - 169 months). Diabetes mellitus was most common underlying cause of end-stage renal disease (48.6%). The mean lean mass index was 16.7 ± 2.5, and the GNRI was 91.6 ± 10.2. The Davies index was low risk for 165 patients (34.0%), intermediate risk for 270 (55.6%), and high risk for 51 (10.5%).
TABLE 1.
Baseline Patient Characteristicsa One Month After Peritoneal Dialysis Start

Comparison Between the GNRI and Markers of Nutrition
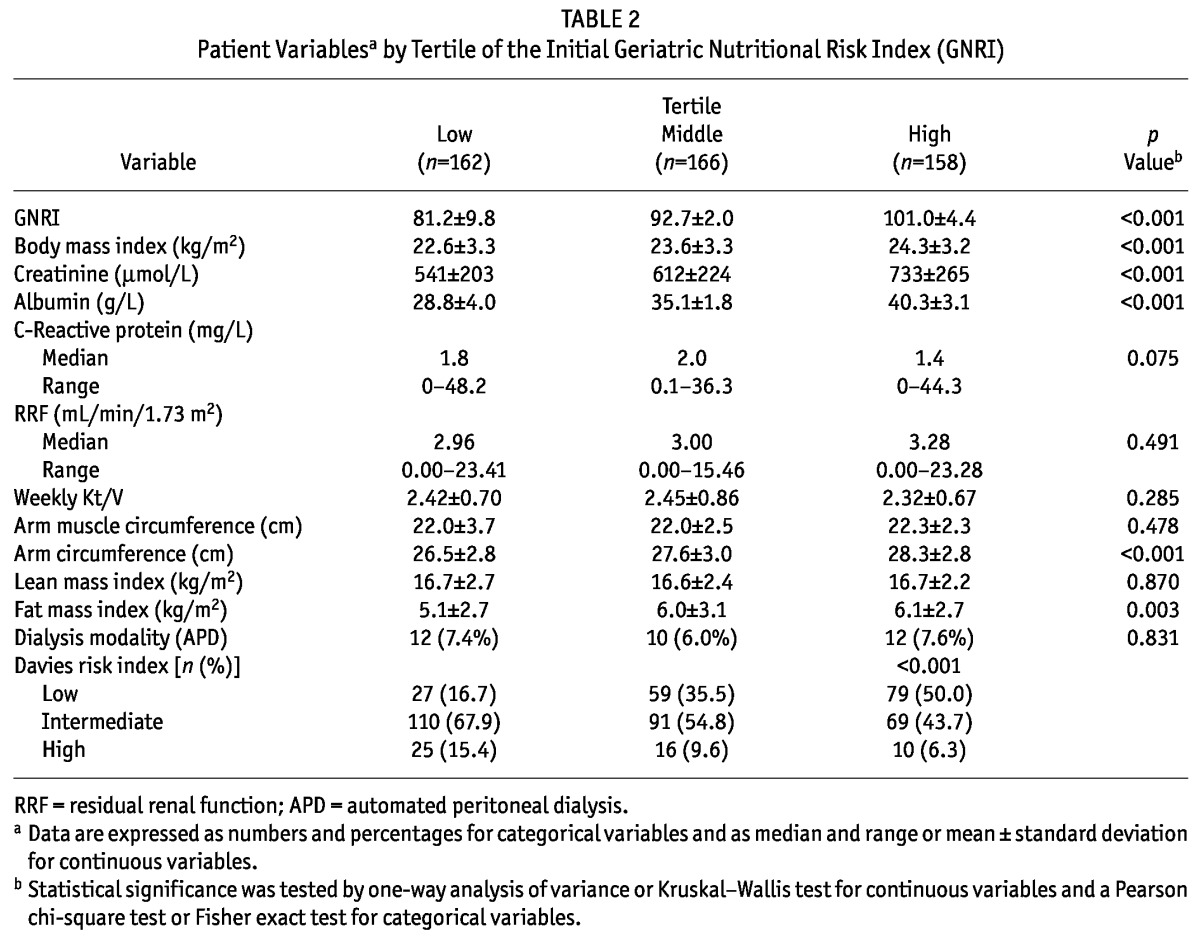
Initially, the low, middle, and high GNRI tertiles included 162, 166, and 158 patients respectively (Table 2). The mean GNRI in the low, middle, and high tertiles was 81.2 ± 9.8, 92.7 ± 2.0, and 101.0 ± 4.4 respectively (p < 0.001). Significant correlations were noted between the initial GNRI and BMI, creatinine, albumin, CRP, AC, and fat mass index. Thus, compared with patients in the lower GNRI tertiles, patients in the higher GNRI tertiles had higher values for BMI, creatinine, albumin, AC, and fat mass index. The low initial GNRI tertile was associated with a high-risk rating on the Davies index.
TABLE 2.
Patient Variablesa by Tertile of the Initial Geriatric Nutritional Risk Index (GNRI)

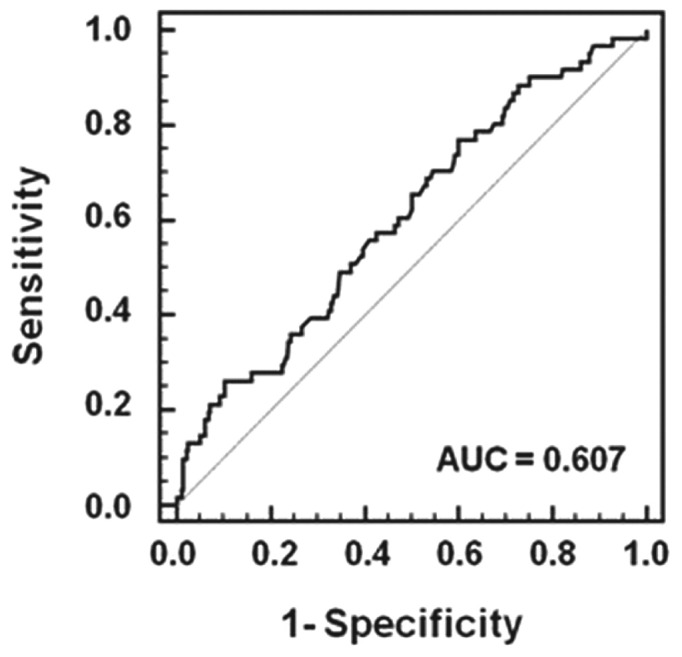
The AUROC was analyzed using the 351 patients who underwent follow-up DEXA. As shown in Figure 1, significant declines in lean mass index occurred over 1 year in the TA-GNRI scores as examined by AUROC. The cut-off value for the TA-GNRI over 1 year was 96.4; the sensitivity and specificity for a diagnosis of a significant decline in lean mass were, respectively, 77.1% (confidence interval: 64.5 to 86.8) and 40.0% (confidence interval: 34.2 to 46.0).
Figure 1.

— Receiver operating characteristic curve of the time-averaged Geriatric Nutritional Risk Index for a diagnosis of a significant decline in lean mass in 351 patients who underwent follow-up dual-energy X-ray absorptiometry. AUC = area under the curve.
Survival Analysis
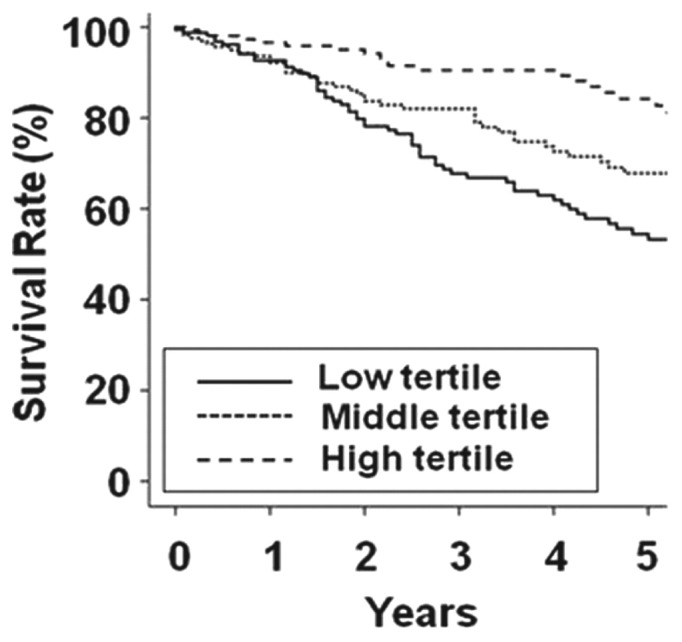
The cumulative 5-year survival rates in the low, middle, and high GNRI tertiles were 53.2%, 67.8%, and 84.2% respectively (p < 0.001, Figure 2). Univariate analysis showed that old age, high-risk rating on the Davies index, hypoalbuminemia (<38 g/L), high CRP (≥5 mg/L), and low GNRI tertile were associated with mortality in PD patients (Table 3). Multivariate analysis adjusted for age, Davies risk index rating, and CRP showed that the hazard ratios for serum albumin and GNRI tertile were 1.556 and 1.661 respectively. The hazard ratio was higher for the low GNRI tertile than for hypoalbuminemia (<38 g/L).
Figure 2.

— Kaplan-Meier survival curve according to tertile of initial score on the Geriatric Nutritional Risk Index. The 5-year survival rates in the low, middle, and high tertiles were 53.2%, 67.8%, and 84.2% respectively (p < 0.001).
TABLE 3.
Univariate and Multivariate Cox Proportional Hazards Analysis of Initial Variables for Mortality in Peritoneal Dialysis Patients

Discussion
The results of the present study show that the GNRI is related to markers of nutrition and to comorbidities in PD patients. The TA-GNRI could predict changes or declines in lean mass. Univariate and multivariate analyses revealed that an initial low GNRI tertile was associated with mortality in PD patients.
Several guidelines have introduced various indicators as markers of nutrition (1,13,14). However, the ideal marker of nutrition status in dialysis patients remains controversial. In particular, although serum albumin is partly related to nutrition, it may be more related to inflammation or hydration status (15). The ideal marker should not only be simple and objective, but should also be representative of characteristics for adjusting related components. For hospitalized patients, the European Society of Parenteral and Enteral Nutrition guidelines and the French Programme National Nutrition Santé recommend using a combination of BMI or albumin and weight loss. Bouillanne et al. (7) introduced the GNRI to predict malnutrition in elderly or hospitalized patients by using ideal body weight, body weight, and serum albumin. Two studies confirmed the applicability of their method to dialysis patients (8,9). To our knowledge, the present study is the second to validate the GNRI as a marker of nutrition in PD patients.
The present results show that an initial low GNRI tertile is associated with poor nutrition status and a higher risk rating on the Davies index. The significant associations between malnutrition, high comorbidity rates, and inflammation were confirmed in the early 2000s (1,2). Inflammation caused by dialysis-related or -unrelated factors leads to protein catabolism by multiple pathways, among them, the ubiquitin-proteasome pathway; the result is an increase in resting energy expenditure and oxidative stress (1,2,13,16). The results of the present study demonstrate that, as a marker of nutrition, a low GNRI tertile is associated with a high-risk rating on the Davies index, which accords with results from earlier studies (7,8). Although no statistical significance was detected, median CRP was lower in the high GNRI tertile than in the low or middle tertiles.
A decline in lean mass is a common and serious problem in dialysis patients. The present results show that the initial GNRI tertile is associated with markers of nutrition such as serum albumin, BMI, AC, and creatinine. The associations between the GNRI and serum albumin and BMI may be a result of mathematical coupling, because the latter variables are included in the GNRI equation. Lean mass, which is an important indicator of protein-energy wasting, is calculated by applying DEXA and anthropometric methods to measure body composition (1,10,13,17). Although lean mass estimates using anthropometric method are simple, Szeto et al. (18) showed that they are not correlated with other markers of nutrition. Measurement of lean mass by DEXA is not only the method most closely related to the reference method, but it is also highly accurate and precise (19). To avoid overestimating lean mass because of fluid accumulation, lean mass was measured by checking for evidence of edema by history, physical examination, and radiography (20,21). The results reported here show that there was no significant difference in lean mass index with respect to GNRI tertile, but that the TA-GNRI was associated with a change or decline in the lean mass index. The cut-off value of the TA-GNRI over 1 year was 96.4, and the sensitivity and specificity for predicting a significant decline in lean mass over 1 year were 77.1% and 40.0% respectively. The TA-GNRI has reliable sensitivity but limited specificity for predicting or preventing a significant decline in lean mass. Further investigations are needed to determine a more accurate cut-off value and the clinical relevance of the TA-GNRI.
Kobayashi et al. (22) reported that the GNRI was a significant predictor of mortality in 490 hemodialysis patients. However, that study evaluated only hemodialysis patients, and the duration of dialysis was different from that in the present study. Szeto et al. (8) demonstrated that the GNRI was associated with nutrition status in PD patients. Those authors compared GNRI scores with the subjective global assessment and malnutrition-inflammation scores as markers of nutrition. The sensitivity and specificity of the baseline GNRI scores for predicting malnutrition were 54.5% - 68.0% and 67.7% - 71.1% respectively. During a 1-year period, the sensitivity and specificity of the delta GNRI data for predicting malnutrition were 44.4% - 53.3% and 74.7% - 87.0% respectively. However, those findings are limited by the short-term follow-up (1 year) and the lack of a survival analysis. We compared GNRI scores with lean mass measured by DEXA as a relatively precise and objective marker of nutrition. In the present study, the sensitivity and specificity of the TA-GNRI for predicting a decline in lean mass were 77.1% and 40.0% respectively. Although the TA-GNRI and GNRI have some differences in their definitions and methods, the present data show that the TA-GNRI provides reliable sensitivity compared with the sensitivity seen in the earlier study. In addition, the follow-up duration in the present study for the survival analysis (median: 36.0 months) is longer than that in the earlier study. The present study demonstrates that an initial low GNRI score is an independent risk factor for mortality in patients on PD. The hazard ratio is higher for the GNRI than it is for serum albumin or BMI as single predictors. The criterion for low GNRI was low tertile (<89.6). Therefore, there is a need for a single definition of low GNRI.
Our study is limited by its retrospective and single-center nature. We could not evaluate differences across ethnicities. A prospective study is needed to demonstrate whether maintenance of a good GNRI can prevent a decline in lean mass in PD patients.
Conclusions
Our results demonstrate that the GNRI is a simple method for predicting nutrition status and clinical outcome in PD patients.
Disclosures
The authors report no financial conflicts of interest related to this study.
References
- 1. K/DOQI clinical practice guidelines for nutrition in chronic renal failure. Am J Kidney Dis 2000; 35(Suppl 2):S1–140 [DOI] [PubMed] [Google Scholar]
- 2. Stenvinkel P, Heimbürger O, Lindholm B, Kaysen GA, Bergström J. Are there two types of malnutrition in chronic renal failure? Evidence for relationships between malnutrition, inflammation and atherosclerosis (MIA syndrome). Nephrol Dial Transplant 2000; 15:953–60 [DOI] [PubMed] [Google Scholar]
- 3. Lowrie EG, Lew NL. Death risk in hemodialysis patients: the predictive value of commonly measured variables and an evaluation of death rate differences between facilities. Am J Kidney Dis 1990; 15:458–82 [DOI] [PubMed] [Google Scholar]
- 4. Avram MM, Goldwasser P, Erroa M, Fein PA. Predictors of survival in continuous ambulatory peritoneal dialysis patients: the importance of prealbumin and other nutritional and metabolic parameters. Am J Kidney Dis 1994; 23:91–8 [DOI] [PubMed] [Google Scholar]
- 5. Hakim RM, Levin N. Malnutrition in hemodialysis patients. Am J Kidney Dis 1993; 21:125–37 [DOI] [PubMed] [Google Scholar]
- 6. Honda H, Qureshi AR, Axelsson J, Heimbürger O, Suliman ME, Bàràny P, et al. Obese sarcopenia in patients with end-stage renal disease is associated with inflammation and increased mortality. Am J Clin Nutr 2007; 86:633–8 [DOI] [PubMed] [Google Scholar]
- 7. Bouillanne O, Morineau G, Dupont C, Coulombel I, Vincent JP, Nicolis I, et al. Geriatric Nutritional Risk Index: a new index for evaluating at-risk elderly medical patients. Am J Clin Nutr 2005; 82:777–83 [DOI] [PubMed] [Google Scholar]
- 8. Szeto CC, Kwan BC, Chow KM, Law MC, Li PK. Geriatric nutritional risk index as a screening tool for malnutrition in patients on chronic peritoneal dialysis. J Ren Nutr 2010; 20:29–37 [DOI] [PubMed] [Google Scholar]
- 9. Yamada K, Furuya R, Takita T, Maruyama Y, Yamaguchi Y, Ohkawa S, et al. Simplified nutritional screening tools for patients on maintenance hemodialysis. Am J Clin Nutr 2008; 87:106–13 [DOI] [PubMed] [Google Scholar]
- 10. Fouque D, Kalantar-Zadeh K, Kopple J, Cano N, Chauveau P, Cuppari L, et al. A proposed nomenclature and diagnostic criteria for protein-energy wasting in acute and chronic kidney disease. Kidney Int 2008; 73:391–8 [DOI] [PubMed] [Google Scholar]
- 11. Davies SJ, Phillips L, Naish PF, Russell GI. Quantifying comorbidity in peritoneal dialysis patients and its relationship to other predictors of survival. Nephrol Dial Transplant 2002; 17:1085–92 [DOI] [PubMed] [Google Scholar]
- 12. Lorentz FH. Index of the female physique [German]. Klin Wochenshr 1929; 16:734–6 [Google Scholar]
- 13. Kondrup J, Allison SP, Elia M, Vellas B, Plauth M. on behalf of the Educational and Clinical Practice Committee ESPEN guidelines for nutrition screening 2002. Clin Nutr 2003; 22:415–21 [DOI] [PubMed] [Google Scholar]
- 14. Hasselmann M, Alix E. Tools and procedures for screening for malnutrition and its associated in risks in hospital. Nutr Clin Metabol 2003; 17:218–26 [Google Scholar]
- 15. Ballmer PE. Causes and mechanisms of hypoalbuminemia. Clin Nutr 2001; 20:271–3 [DOI] [PubMed] [Google Scholar]
- 16. Stenvinkel P. Inflammation in end-stage renal disease: the hidden enemy. Nephrology (Carlton) 2006; 11:36–41 [DOI] [PubMed] [Google Scholar]
- 17. Heymsfield SB, McManus C, Stevens V, Smith J. Muscle mass: reliable indicator of protein-energy malnutrition severity and outcome. Am J Clin Nutr 1982; 35(Suppl):S1192–9 [DOI] [PubMed] [Google Scholar]
- 18. Szeto CC, Kong J, Wu AK, Wong TY, Wang AY, Li PK. The role of lean body mass as a nutritional index in Chinese peritoneal dialysis patients—comparison of creatinine kinetics method and anthropometric method. Perit Dial Int 2000; 20:708–14 [PubMed] [Google Scholar]
- 19. Woodrow G. Body composition analysis techniques in adult and pediatric patients: how reliable are they? How useful are they clinically? Perit Dial Int 2007; 27(Suppl 2):S245–9 [PubMed] [Google Scholar]
- 20. Plank LD. Dual-energy X-ray absorptiometry and body composition. Curr Opin Clin Nutr Metab Care 2005; 8:305–9 [DOI] [PubMed] [Google Scholar]
- 21. Konings CJ, Kooman JP, Schonck M, van Kreel B, Heidendal GA, Cheriex EC, et al. Influence of fluid status on techniques used to assess body composition in peritoneal dialysis patients. Perit Dial Int 2003; 23:184–90 [PubMed] [Google Scholar]
- 22. Kobayashi I, Ishimura E, Kato Y, Okuno S, Yamamoto T, Yamakawa T, et al. Geriatric Nutritional Risk Index, a simplified nutritional screening index, is a significant predictor of mortality in chronic dialysis patients. Nephrol Dial Transplant 2010; 25:3361–5 [DOI] [PubMed] [Google Scholar]


