Abstract
♦ Background: Fluid removal during peritoneal dialysis depends on modifiable factors such as tonicity of dialysis fluids and intrinsic characteristics of the peritoneal transport barrier and the osmotic agent—for example, osmotic conductance, ultrafiltration efficiency, and peritoneal fluid absorption. The latter parameters cannot be derived from tests of the small-solute transport rate. We here propose a simple test that may provide information about those parameters.
♦ Methods: Volumes and glucose concentrations of drained dialysate obtained with 3 different combinations of glucose-based dialysis fluid (3 exchanges of 1.36% glucose during the day and 1 overnight exchange of either 1.36%, 2.27%, or 3.86% glucose) were measured in 83 continuous ambulatory peritoneal dialysis (CAPD) patients. Linear regression analyses of daily net ultrafiltration in relation to the average dialysate-to-plasma concentration gradient of glucose allowed for an estimation of the osmotic conductance of glucose and the peritoneal fluid absorption rate, and net ultrafiltration in relation to glucose absorption allowed for an estimation of the ultrafiltration effectiveness of glucose.
♦ Results: The osmotic conductance of glucose was 0.067 ± 0.042 (milliliters per minute divided by millimoles per milliliter), the ultrafiltration effectiveness of glucose was 16.77 ± 7.97 mL/g of absorbed glucose, and the peritoneal fluid absorption rate was 0.94 ± 0.97 mL/min (if estimated concomitantly with osmotic conductance) or 0.93 ± 0.75 mL/min (if estimated concomitantly with ultrafiltration effectiveness). These fluid transport parameters were independent of small-solute transport characteristics, but proportional to total body water estimated by bioimpedance.
♦ Conclusions: By varying the glucose concentration in 1 of 4 daily exchanges, osmotic conductance, ultrafiltration efficiency, and peritoneal fluid absorption could be estimated in CAPD patients, yielding transport parameter values that were similar to those obtained by other, more sophisticated, methods.
Key words: Glucose, peritoneal transport, osmosis, ultrafiltration
Fluid removal is a key component of any dialysis modality. In peritoneal dialysis (PD), fluid removal is achieved by the osmotic force exerted by osmotic agents added to dialysis fluid. Glucose is the prototypical osmotic agent in PD, although other agents such as polyglucose (that is, icodextrin) and amino acids are also used alongside glucose in clinical practice in several countries (1,2). Fluid removal in PD depends on the characteristics of the dialysis fluid, especially the type and concentration of the osmotic agent, the temporal distribution of dialysis fluid exchanges, the characteristics of the peritoneal membrane, and the status of the patient. Assessment of the efficiency of fluid removal by osmosis in patients on PD is in itself a multifactorial task, and several different parameters must be applied for its holistic description (3-6). For an osmotic agent, “osmotic conductance” (OsmCond) measures the amount of fluid ultrafiltration (UF) to the peritoneal cavity induced by a unit concentration of the osmotic agent. Although a precise assessment of OsmCond for glucose and the peritoneal absorption rate (PA) can be performed using rather sophisticated clinical measurements (3,4,7), assessments that are easier to perform and that could be applied in clinical practice are needed.
It is generally agreed that, in continuous ambulatory PD (CAPD) patients, sufficient daily UF should be achieved with minimal absorption of glucose, both because a high concentration of glucose in the tissues induces neoangiogenesis and fibrosis and may result in a loss of UF capacity, and because glucose absorption contributes to various nutritional and metabolic disturbances (6,8,9). Indicators of UF efficiency, such as net UF efficiency, nUFE [defined as net UF, nUF, divided by the absorbed amount of glucose, GlAbs (10-12)], or its reciprocal, peritoneal glucose exposure, have therefore been proposed (11). However, the interpretation of those indicators is not unequivocal, because the net amount of fluid in the peritoneal cavity is a result of two components: UF to the peritoneal cavity, driven by osmosis and called sometimes “transcapillary UF,” and reabsorption of fluid from the peritoneal cavity, driven by increased hydrostatic pressure in the cavity (13,14). Those two components should therefore be separated, and UF efficiency should be estimated using daily UF instead of net fluid removal. Peritoneal absorption of fluid substantially decreases the effectiveness of dialysis and may be, per se, a reason for UF failure (15,16).
Here, we propose a simple method—a threefold peritoneal test—for estimating these three parameters related to fluid transport [OsmCond for glucose, UF efficiency of glucose, fluid absorption (FA) from the peritoneal cavity] from 24-hour dialysate collections with 3 different schedules of glucose-based dialysis fluids.
Methods
Daily dialysate collections with 3 different combinations of glucose-based dialysis fluid were carried out in 99 CAPD patients [including 46 with anuria (that is, a daily urine output less than 100 mL)] being treated at 5 PD centers in Mexico City, Mexico. The mean age of the patients (56 of whom were men) was 54 ± 13 years. According to Twardowski’s peritoneal equilibration test (PET) classification, 4 patients were slow transporters; 38, slow-average; 48, fast-average; and 8, fast transporters. (One patient was not classified because of lack of data.) More data about transport of small solutes in those patients can be found in Paniagua et al. (17).
Each patient performed 3 separate daily collections, each time using 3 daily exchanges of 1.36% glucose and then 1 night exchange of either 1.36% glucose (G1 schedule), 2.27% glucose (G2 schedule), or 3.86% glucose (G3 schedule). The infused volumes and dwell times followed individual prescriptions, except for the overnight dwell, which was standardized to 8 hours. Patients brought their own bags to the center, where nUF was measured. Infused fluid volume was registered, but not measured. A randomized order of solutions was used for the overnight exchange. Patients were told not to use flush-before-fill. A PET with 2.27% glucose was also performed in the study patients. Total body water (TBW) was measured by multi-frequency bioelectric impedance (QuadScan 4000: Bodystat, Douglas, Isle of Man, UK).
Daily nUF was calculated as the daily removed volume minus the daily infused volume, corrected for an overfill of 300 mL daily according to the local manufacturer (18,19). Absorbed glucose was estimated as the difference between the glucose infused and the glucose drained. The daily average glucose concentration gradient between dialysate and blood, avGlGrad, was estimated as the difference between the average glucose concentration in dialysate and plasma. The average glucose concentration in dialysate was calculated as the logarithmic mean of the average glucose concentration in the infused fluids (corrected for dilution in the residual peritoneal volume) and the glucose concentration in the mixed drained fluid. The OsmCond was calculated for each patient separately as the slope of linear regression between the daily nUF and the (logarithmic) avGlGrad for the three schedules (Figure 1):
 |
Figure 1.
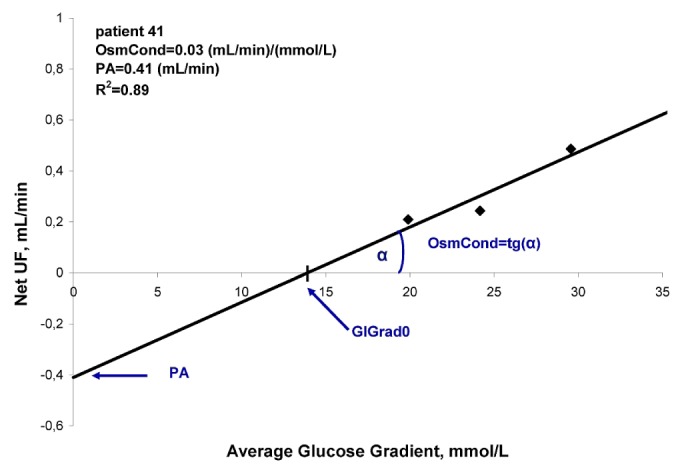
— Linear correlation between net peritoneal ultrafiltration (net UF) and average glucose gradient (GlGrad) over 24 hours, using fluid schedules G1, G2, and G3 in 1 patient. OsmCond = osmotic conductance; PA = peritoneal absorption rate.
The UF efficiency (UFE) was calculated for each patient separately as the slope of linear regression between the daily nUF and GlAbs for the three schedules:
 |
where FA is interpreted as daily fluid absorption during hypothetical exchanges with no glucose absorption (Figure 2). The GlAbs necessary to maintain zero nUF, GlAbs0, was calculated as
 |
Figure 2.
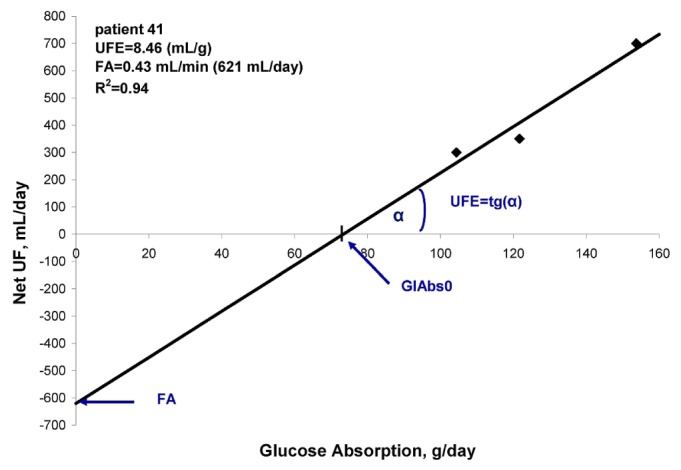
— Linear correlation between 24-hour net peritoneal ultrafiltration (net UF) and glucose absorption (GlAbs) using fluid schedules G1, G2, and G3 in 1 patient. UFE = ultrafiltration efficiency; FA = fluid absorption.
The nUFE was calculated for each patient and schedule separately as the ratio of nUF to the GlAbs.
The results presented here omit 10 patients, who were not included because of a lack of data or inconsistency in the data. Another 6 patients were excluded because of insufficient precision or problems with the estimation procedure [no linear relationship was found in 4 patients (that is, the correlation coefficient was very low, with an R between -0.1 and 0.1), the estimated OsmCond was negative in 1 patient, and the estimated values of the parameters were unusually high in another patient]. The results therefore include data for 83 patients. The data are presented as mean ± standard deviation.
Results
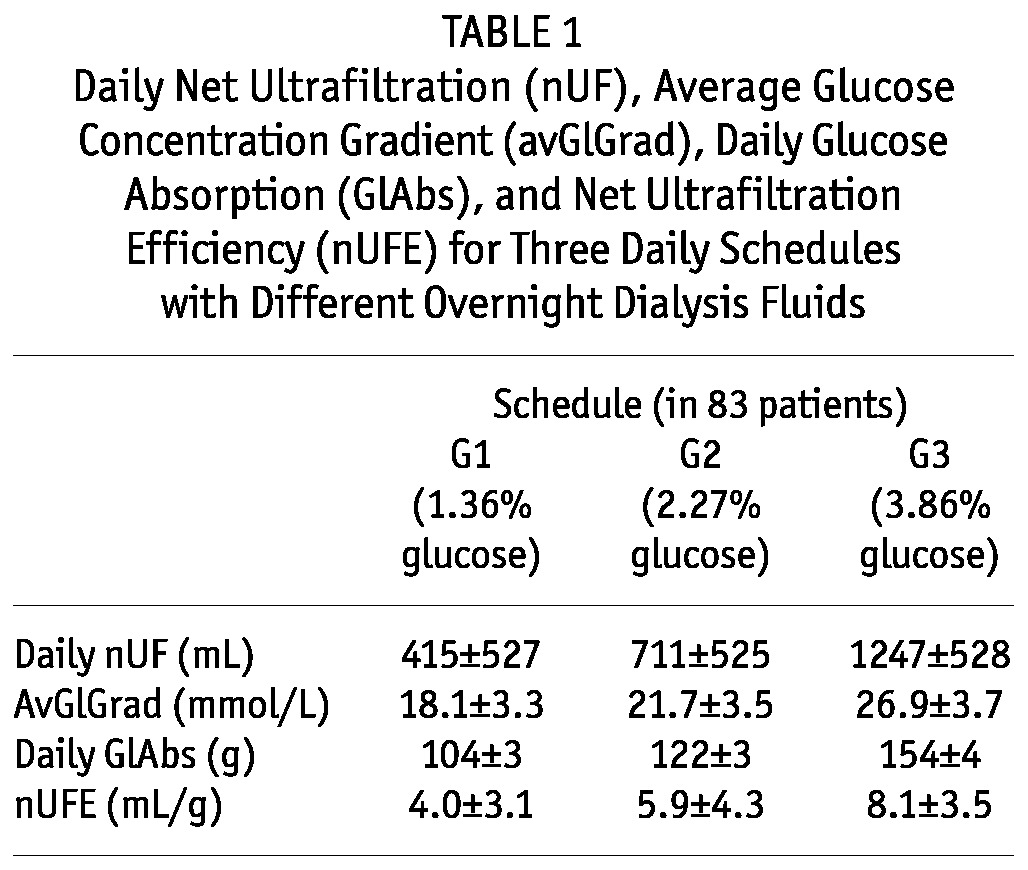
The nUF, avGlGrad, daily GlAbs, and nUFE were different for the three daily schedules, which differed only with respect to the overnight exchange (Table 1).
TABLE 1.
Daily Net Ultrafiltration (nUF), Average Glucose Concentration Gradient (avGlGrad), Daily Glucose Absorption (GlAbs), and Net Ultrafiltration Efficiency (nUFE) for Three Daily Schedules with Different Overnight Dialysis Fluids
The estimated OsmCond was 0.067 ± 0.042 (milliliters per minute divided by millimoles per milliliter) or, in alternative units, 3.47 ± 2.18 (milliliters per minute divided by millimeters Hg), and the PA was 0.94 ± 0.97 mL/min (that is, 1354 ± 1397 mL daily). The correlation coefficient for the linear regression was 0.86 ± 0.20. Using those parameters, the concentration of glucose in the infused fluid that would result in zero nUF can be estimated to be 12.4 g/L on average—a value that would be equivalent to 1.2% glucose solution.
The estimated UFE was 16.77 ± 7.97 mL per gram of absorbed glucose, the FA was 0.93 ± 0.75 mL/min (that is, 1339 ± 1080 mL daily), and the GlAbs0 was 68.27 ± 56.42 g daily. The correlation coefficient for the linear regression was 0.88 ± 0.13. Thus, for each 1-g increase in the absorbed amount of glucose, daily nUF was increased by 16.8 mL for an average patient. In contrast, when the relationship between nUF and the GlAbs was checked for each schedule separately, the correlation was negative (Figure 3):
Figure 3.
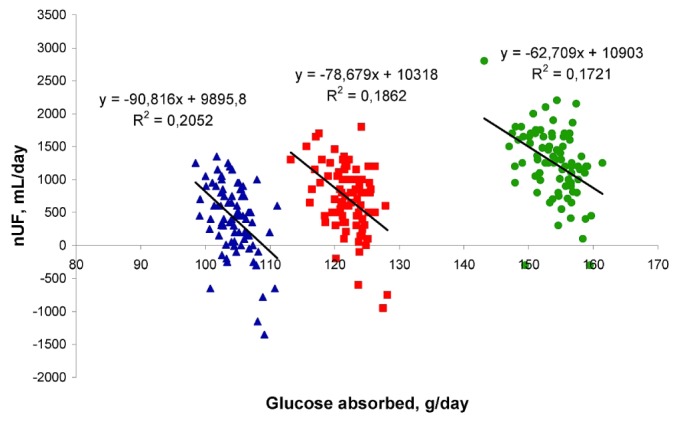
— Negative correlation between 24-hour net peritoneal ultrafiltration (nUF) and glucose absorption for each 24-hour collection, showing the G1, G2, and G3 schedules separately.
nUF = -90.82•GlAbs + 9895.8 (R = -0.46, p < 0.05) for the G1 schedule
nUF = -78.68•GlAbs + 10317.6 (R = -0.44, p < 0.05) for the G2 schedule
nUF = -62.71•GlAbs + 10902.5 (R = -0.41, p < 0.05) for the G3 schedule
Thus, with the same glucose concentration in the infused fluid, the daily nUF was lower on average by 62.7 - 90.8 mL per 1 g of GlAbs, depending on the dialysis fluid used for the night exchange. A similar negative relationship between nUF and GlAbs was found for results obtained during the PET (Figure 4; R = -0.35; p < 0.05). This negative effect was mostly attributable to the longer time with a low glucose concentration in PD fluid for patients with fast GlAbs.
Figure 4.
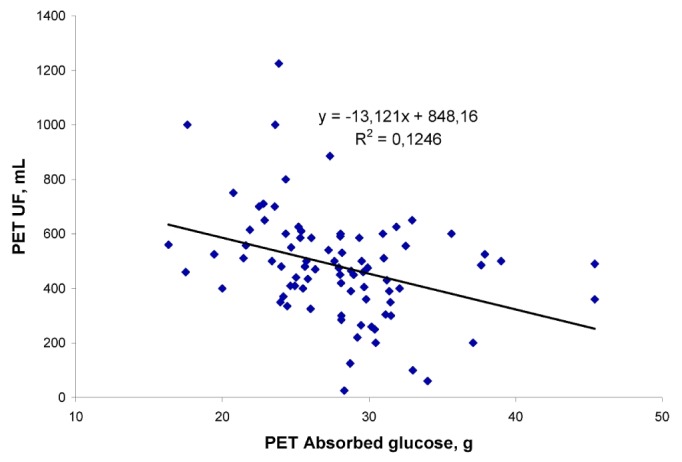
— Net peritoneal ultrafiltration (UF) as a function of glucose absorbed during a peritoneal equilibration test (PET).
As expected, a negative correlation was observed for the nUF in the three 24-hour collections and the dialysate-to-plasma (D/P) ratio of creatinine observed in the PET (R = -0.31, p = 0.004 for nUF with schedule G1; R = -0.26, p = 0.022 for nUF with schedule G2; and R = -0.40, p < 0.001 for nUF with schedule G3). In contrast, no correlation was found for OsmCond and UFE with the PET D/P creatinine (R = -0.10, p = 0.36 and R = -0.14, p = 0.20 respectively). The PA was also independent of small-solute transport status (PET D/P creatinine, R = -0.08, p = 0.497 for PA and R = 0.04, p = 0.728 for FA). Osmotic conductance correlated with UFE (R = 0.59, p < 0.001).
The fluid transport parameters correlated with TBW (R = 0.22 for OsmCond compared with TBW, R = 0.26 for PA compared with TBW, R = 0.32 for UFE compared with TBW, R = 0.40 for FA compared with TBW; p < 0.05 for all correlations). The UFE and FA correlated with body surface area (R = 0.23 and R = 0.27 respectively, p < 0.05).
Discussion
The method presented here for the estimation of OsmCond and UFE of glucose concomitantly with PA is based on the assumption that these parameters do not depend on the glucose concentration in the dialysis fluid and are the same for the daily collections with the different average glucose concentrations. That assumption yields the linear dependence of nUF on the glucose concentration gradient and the amount of GlAbs. Good correlation coefficients for most of the studied patients confirm the independence of the fluid transport coefficients of the applied glucose concentrations. Nevertheless, the assumption did not work in a few patients, and the fitted linear lines had a slope close to 0 (in 4 patients) or even a negative slope (in 1 patient). In 1 patient, the slope was much higher than in the other patients, yielding a very high OsmCond and PA. The abnormal values obtained for a few patients may be a result of measurement errors, as suggested by the very low correlation coefficients. Those patients were not taken into account for the calculation of the average values presented here (see the Methods section).
However, the lack of an increase in nUF with the increase of glucose concentration in dialysis fluid may also result from a specific form of UF failure that consists in the inability to increase UF if the glucose concentration is increased, in spite of a relatively normal nUF with a low glucose concentration, which was previously identified in another patient population (20). In our study, 11 patients had a very low OsmCond or glucose effectiveness and a concomitantly normal nUF with schedule G1. In a few patients (n = 3), we observed a very high OsmCond or glucose effectiveness. Those observations may be related to the hypothetical induction of ultrasmall pore function by a high glucose concentration [see Lai et al. (21) for experimental evidence of such induction in mesothelial and endothelial cells] and a possible impairment of this induction in some patients or a specifically strong effect in some other patients (22). For such problematic cases, the study should be repeated to provide a robust answer about the consistency of, and reason for, the abnormal results. These 14 patients were included in the group of patients for whom average values are recorded in the present study because there was no reason to exclude them; they represent extreme cases in the response to an increased glucose concentration in dialysis fluid. It might be hypothesized that such a response is based on physiology that differs from that in other, more typical, patients. An artifact of this abnormal behavior is the incorrect estimation of FA, in which values estimated by our method may be negative for patients with a very low OsmCond (or UFE) or very high for patients with a high OsmCond (or UFE). The inclusion of such values with the average rates results in high standard deviations for PA and FA (see the Results section).
Our approach, in itself, involves several approximations and possible sources of error. First, the infused volume during each fluid exchange is difficult to control if the exchange is performed by patients at home. Furthermore, it has to be assumed that the residual volume left after fluid drainage is similar for all exchanges. Those two factors may contribute to inaccuracy in the assessment of daily nUF. Furthermore, estimation of the daily avGlGrad is based on the glucose concentration measured for the daily collection of dialysate and not for each bag separately. Therefore, the approximation of the avGlGrad may be a reason that numerical problems with the assessment of glucose OsmCond were more frequent than those with the UFE, which is based on a simple calculation of the amount of GlAbs (however, that calculation depends on the accuracy of the assessment of fluid volume).
In our calculations, we used the logarithmic avGlGrad of the infused and drained solution. Logarithmic average is the appropriate average value if the concentration profile is exponential; in contrast, the arithmetic average is the correct average value if the concentration profile is linear. Logarithmic average takes into account the presence of high concentration values only during a short initial dwell time. For most of the dwell time, the concentration is low, which is the case for glucose profiles during long peritoneal dwells. The logarithmic and arithmetic average values are similar if the difference between the initial and final concentrations is small. However, in our estimations, that principle does not hold, and the arithmetic average is about 70% higher than the logarithmic average. Thus, the application of the arithmetic average would result in a substantial underestimation of OsmCond.
The estimations of PA and FA are sensitive to small errors in the slope of the fitted straight line, because the data points are far from the vertical axis (Figures 1 and 2). In general, the hypothetical daily FA with no GlAbs (which can be estimated concomitantly with glucose UFE) has a value similar to that for PA estimated concomitantly with OsmCond. In fact, FA may be expected to be approximately equal to PA. That conclusion can be drawn using the following reasoning: For isotonic dialysis fluid, nUF is noted to be equal to -PA, and GlAbs, equal to PA•CB, where CB is the glucose concentration in plasma equal for isotonic fluid to the concentration in dialysis fluid. Thus, using the fundamental equation nUF = UFE•GlAbs - FA, it is noted for isotonic fluid that -PA = UFE•PA•CB - FA and therefore that PA = FA / (1 + UFE•CB). But, for a typical value of CB = 1.16 g/L, UFE•CB is a low value of 0.019, and if compared with 1, it can be ignored. Therefore, it might be expected that PA should approximately equal FA and that the average value of these two estimations can be used as a more robust assessment of PA.
The value of OsmCond obtained in our study, 0.067 ± 0.042, is similar to values obtained by other methods: 0.063 ± 0.028 (7), 0.068 ± 0.056 (3), 0.087 (range: 0.056 - 0.27) (16), and 0.133 ± 0.041 (23). The PA, 0.94 ± 0.97 mL/min, estimated together with OsmCond, was within the range of the values obtained by other methods: 1.1 ± 0.3 mL/min for 1.36% glucose and 1.6 ± 0.6 mL/min for 3.86% glucose (4); 1.6 ± 0.9 mL/min (24), median 0.95 (range: 0.36 - 3.9 mL/min) (25); and 2.34 ± 1.14 mL/min (26). A similar value, 0.93 ± 0.75 mL/min, was obtained if the PA was assessed as FA.
The nUFE includes the effect of peritoneal FA on fluid removal and depends on the glucose concentration in the infused dialysis fluids (Table 1). Furthermore, nUFE depends reciprocally on GlAbs if the patient population is studied with the same dialysis fluids, Figure 4 (11). The nUFE estimated for the PET in 719 patients varied from 5.1 mL/g for high transporters to 23.5 mL/g for low transporters, and if estimated for the long dwell with 2.5% glucose, was on average 7.9 mL/g in 94 CAPD patients and 3.1 mL/g in 47 automated PD patients (11). In contrast, UFE is independent of glucose concentration in dialysis fluids and describes the effectiveness of glucose in inducing transcapillary UF and not the nUF that is the difference between transcapillary UF and peritoneal absorption. The mean value of nUFE found in our study using the daily collections of 3 different schedules of dialysis fluids was 16.8 mL/g and much higher than the nUFE coefficients calculated separately for each schedule (Table 1). That difference demonstrates the substantial impact of peritoneal absorption on net fluid removal. Actually, about 86.3 ± 56.4 g glucose daily (GlAbs0, which is more than 50% percent of the daily absorbed glucose with the fluid schedules; see Table 1) would be absorbed to keep the net fluid removal at 0 (that is, to provide UF exactly matching the peritoneal fluid absorption).
It is important to note that the net daily UF increases with the amount of GlAbs if the concentration of glucose in the infused fluid increases, but that this correlation in the patient population is negative if the infused fluids have the same glucose concentration (Figures 3 and 4).
The fluid transport parameters estimated in the present study were independent of the patient transport status as estimated by the PET—that is, independent of D/P creatinine from a PET. That finding is consistent with previous results obtained using other clinical and mathematical methods (27) and implicates the necessity to monitor fluid transport status separately and in addition to small-solute transport status. Unfortunately, nUF is not always a good indicator of fluid transport characteristics, being a net result of two reciprocal processes—osmotic UF and absorption—and therefore additional tests need to be performed to assess OsmCond and PA. The fluid transport parameters correlated positively with body size as assessed by TBW.
The approximate estimation of OsmCond and UFE for glucose and peritoneal absorption from a few daily collections of dialysate with varying concentrations of glucose is possible and yields values similar to those provided by other methods. The daily collections used for this estimation should differ in glucose concentration on the different study days, but the specific fluid schedule applied in this study—that is, differences in the overnight exchange—is not obligatory. Other variants, in which one of the daily exchanges is altered, should also be tested. Again, however, it is essential that the regimens differ only with respect to one component—that is, the concentration of the osmotic agent.
Conclusions
Peritoneal fluid absorption is an important factor that regulates nUF during PD. Its typical value is consistently estimated in various studies and by different methods to be about 1 mL/min or more. That rate means that more than 1 L of fluid is absorbed each day from the peritoneal cavity in CAPD patients, and therefore the “real” transcapillary UF to the peritoneal cavity by high osmotic pressure is more than 1 L per day higher than what is measured by drainage volume as nUF (numbers that may vary widely between patients). Loss of UF capacity may be related to decreased OsmCond or to increased PA, or to both; however, note that these parameters may be relatively normal even in patients with loss of UF capacity (16,23,28,29). Still, regular monitoring of OsmCond, UFE, and PA should be helpful for improving the understanding of factors governing nUF, for allowing better discrimination between the various transport types, and for predicting changes in peritoneal membrane function with time on PD. Unfortunately, there is no ideal method for assessing these parameters. However, the new approach presented here is relatively simple and clinically feasible, and it yields results that are consistent with those obtained using other, more sophisticated, methods.
Disclosures
Baxter Novum is the result of a grant from Baxter Healthcare Corporation to Karolinska Institutet. BL is employed by Baxter Healthcare Corporation.
Acknowledgments
The authors thank the dialysis centers, their staffs, and the patients who participated in this study.
References
- 1. Holmes CJ, Shockley TR. Strategies to reduce glucose exposure in peritoneal dialysis patients. Perit Dial Int 2000; 20(Suppl 2):S37–41 [PubMed] [Google Scholar]
- 2. Freida P, Issad B, Dratwa M, Lobbedez T, Wu L, Leypoldt JK, Divino-Filho JC. A combined crystalloid and colloid pd solution as a glucose-sparing strategy for volume control in high-transport apd patients: a prospective multicenter study. Perit Dial Int 2009; 29:433–42 [PubMed] [Google Scholar]
- 3. Stelin G, Rippe B. A phenomenological interpretation of the variation in dialysate volume with dwell time in CAPD. Kidney Int 1990; 38:465–72 [DOI] [PubMed] [Google Scholar]
- 4. Waniewski J, Heimbürger O, Werynski A, Lindholm B. Simple models for fluid transport during peritoneal dialysis. Int J Artif Organs 1996; 19:455–66 [PubMed] [Google Scholar]
- 5. Waniewski J, Debowska M, Lindholm B. How accurate is the description of transport kinetics in peritoneal dialysis according to different versions of the three pore model? Perit Dial Int 2008; 28:53–60 [PubMed] [Google Scholar]
- 6. Krediet RT, Coester AM, Parikova A, Smit W, Struijk DG. New insights into the physiology of peritoneal fluid transport. Perit Dial Int 2008; 28(Suppl 3):S144–9 [PubMed] [Google Scholar]
- 7. La Milia V, Limardo M, Virga G, Crepaldi M, Locatelli F. Simultaneous measurement of peritoneal glucose and free water osmotic conductances. Kidney Int 2007; 72:643–50 [DOI] [PubMed] [Google Scholar]
- 8. Kim YL. Update on mechanisms of ultrafiltration failure. Perit Dial Int 2009; 29(Suppl 2):S123–7 [PubMed] [Google Scholar]
- 9. Mushahar L, Lambie M, Tan K, John B, Davies SJ. Long-term changes in solute and water transport. Contrib Nephrol 2009; 163:15–21 [DOI] [PubMed] [Google Scholar]
- 10. Fischbach M, Desprez P, Donnars F, Hamel G, Geisert J. Optimization of CCPD prescription in children using peritoneal equilibration test. Adv Perit Dial 1994; 10:307–9 [PubMed] [Google Scholar]
- 11. Holmes C, Mujais S. Glucose sparing in peritoneal dialysis: implications and metrics. Kidney Int Suppl 2006; (103):S104–9 [DOI] [PubMed] [Google Scholar]
- 12. Akonur A, Holmes CJ, Leypoldt JK. Ultrafiltration efficiency during automated peritoneal dialysis using glucose-based solutions. Adv Perit Dial 2008; 24:69–74 [PubMed] [Google Scholar]
- 13. Stachowska-Pietka J, Waniewski J, Flessner MF, Lindholm B. Distributed model of peritoneal fluid absorption. Am J Physiol Heart Circ Physiol 2006; 291:H1862–74 [DOI] [PubMed] [Google Scholar]
- 14. Waniewski J, Stachowska-Pietka J, Flessner MF. Distributed modeling of osmotically driven fluid transport in peritoneal dialysis: theoretical and computational investigations. Am J Physiol Heart Circ Physiol 2009; 296:H1960–8 [DOI] [PubMed] [Google Scholar]
- 15. Heimbürger O, Waniewski J, Werynski A, Tranæus A, Lindholm B. Peritoneal transport in CAPD patients with permanent loss of ultrafiltration capacity. Kidney Int 1990; 38:495–506 [DOI] [PubMed] [Google Scholar]
- 16. Parikova A, Smit W, Struijk DG, Krediet RT. Analysis of fluid transport pathways and their determinants in peritoneal dialysis patients with ultrafiltration failure. Kidney Int 2006; 70:1988–94 [DOI] [PubMed] [Google Scholar]
- 17. Paniagua R, Debowska M, Ventura MD, Avila-Díaz M, Prado-Uribe C, Mora C, et al. Ultrafiltration and dialysis adequacy with various daily schedules of dialysis fluids. Perit Dial Int 2012; 32:545–51 [DOI] [PMC free article] [PubMed] [Google Scholar]
- 18. Davies SJ. Overfill or ultrafiltration? We need to be clear. Perit Dial Int 2006; 26:449–51 [PubMed] [Google Scholar]
- 19. La Milia V, Pozzoni P, Crepaldi M, Locatelli F. Overfill of peritoneal dialysis bags as a cause of underestimation of ultrafiltration failure. Perit Dial Int 2006; 26:503–5 [PubMed] [Google Scholar]
- 20. Monquil MC, Imholz AL, Struijk DG, Krediet RT. Does impaired transcellular water transport contribute to net ultrafiltration failure during CAPD? Perit Dial Int 1995; 15:42–8 [PubMed] [Google Scholar]
- 21. Lai KN, Li FK, Lan HY, Tang S, Tsang AW, Chan DT, Leung JC. Expression of aquaporin-1 in human peritoneal mesothelial cells and its upregulation by glucose in vitro. J Am Soc Nephrol 2001; 12:1036–45 [DOI] [PubMed] [Google Scholar]
- 22. Stachowska-Pietka J, Waniewski J, Vonesh E, Lindholm B. Changes in free water fraction and aquaporin function with dwell time during continuous ambulatory peritoneal dialysis. Artif Organs 2010; 34:1138–43 [DOI] [PubMed] [Google Scholar]
- 23. Waniewski J, Heimbürger O, Werynski A, Lindholm B. Osmotic conductance of the peritoneum in CAPD patients with permanent loss of ultrafiltration capacity. Perit Dial Int 1996; 16:488–96 9026090 [Google Scholar]
- 24. Olszowska A, Waniewski J, Werynski A, Anderstam B, Lindholm B, Wankowicz Z. Peritoneal transport in peritoneal dialysis patients using glucose-based and amino acid-based solutions. Perit Dial Int 2007; 27:544–53 [PubMed] [Google Scholar]
- 25. Pannekeet MM, Imholz AL, Struijk DG, Koomen GC, Langedijk MJ, Schouten N, et al. The standard peritoneal permeability analysis: a tool for the assessment of peritoneal permeability characteristics in CAPD patients. Kidney Int 1995; 48:866–75 [DOI] [PubMed] [Google Scholar]
- 26. Simonsen O, Sterner G, Carlsson O, Wieslander A, Rippe B. Improvement of peritoneal ultrafiltration with peritoneal dialysis solution buffered with bicarbonate/lactate mixture. Perit Dial Int 2006; 26:353–9 [PubMed] [Google Scholar]
- 27. Sobiecka D, Waniewski J, Weryński A, Lindholm B. Peritoneal fluid transport in CAPD patients with different transport rates of small solutes. Perit Dial Int 2004; 24:240–51 [PubMed] [Google Scholar]
- 28. Waniewski J, Sobiecka D, Debowska M, Heimbürger O, Weryński A, Lindholm B. Fluid and solute transport in CAPD patients before and after permanent loss of ultrafiltration capacity. Int J Artif Organs 2005; 28:976–86 [DOI] [PubMed] [Google Scholar]
- 29. Waniewski J, Debowska M, Lindholm B. Water and solute transport through different types of pores in peritoneal membrane in CAPD patients with ultrafiltration failure. Perit Dial Int 2009; 29:664–9 [PubMed] [Google Scholar]


