

Abstract
Background
The impact of evidence-based guidelines and controlled trial data on use of cholesterol-lowering medications in older adults is unclear.
Objective
To examine whether utilization patterns of cholesterol-lowering medications in community-dwelling older adults changed following the release of the National Cholesterol Education Program Adult Treatment Panel III guidelines and results from the Prospective Study of Pravastatin in the Elderly at Risk in 2002.
Methods
Community dwelling elders enrolled in the Health, Aging and Body Composition Study in 1997/1998, and followed for up to 11 years. An interrupted time-series analysis with multivariable generalized estimating equations (GEE) was used to examine level and trend changes in cholesterol-lowering medication use before and after 2002, adjusting for sociodemographic, health-related behaviors and health status.
Results
Cholesterol-lowering medication use increased nearly 3-fold from 14.9% in 1997/1998 to 42.6% in 2007/2008 with statins representing the most common class used (87%–94%). Multivariable GEE results revealed no difference in the level of cholesterol-lowering medication use after 2002 (adjusted odds ratio: 0.95, 95% confidence interval [CI] 0.89–1.02). Multivariable GEE results revealed trends changes in the rate of increase in cholesterol-lowering medication declined after 2002 (adjusted ratio of odds ratios 0.92, 95% CI 0.89–0.95).
Conclusions
The use of cholesterol-lowering medication increased substantially over a decade in community dwelling elders, but was not related to a change in level or trend following the release of the guidelines and evidence-based data.
Keywords: aged, anticholesteremic agents, hydroxymethylglutaryl-CoA reductase inhibitors, statins, drug utilization
INTRODUCTION
Although cardiovascular disease remains the leading cause of death and disability among the elderly in the US, the incidence of coronary heart disease (CHD) and associated mortality actually declined by approximately 25% from 1997 to 2007.1–3 _ENREF_2 This decline may be due to improved medical care and use of evidence-based preventive medications, including cholesterol-lowering therapy.3, 4 Recommendations for the detection and control of hypercholesterolemia for adults have been offered since 1988, by the National Cholesterol Education Program (NCEP) Adult Treatment Panel (ATP).5–8
In 2002, NCEP ATP III guidelines were published and for the first time strongly recommended the use of statins for older persons with established CHD or at high risk for developing CHD (e.g., diabetes mellitus).7 These recommendations were based in part upon the results from the subgroup analysis of several previous trials with statins,9–13 and the 2002 Prospective Study of Pravastatin in the Elderly at Risk (PROSPER).14 Conclusively extrapolating the results from subgroup analysis to all older adults was controversial, in part because most of these trials had defined an upper age limit (70–75 years of age) that favored the inclusion of only “younger” older adults.9–11 The 2002 Medical Research Council/British Heart Foundation Heart Protection Study (HPS) included a good proportion (28%) of participants aged ≥ 70 years.12 Among 1263 individuals aged 75 to 80 years at baseline, the rate of major coronary events was significantly lower in the statin group than placebo group.12 The PROSPER is the only trial focused on an exclusively elderly cohort involving 5804 older men and women (aged 70 to 82 years).14 They found that that the risk of CHD death, or non-fatal myocardial infarction was significantly reduced in those with established CHD, but not in those receiving the drug for primary prevention (e.g., diabetes mellitus).14
There is limited information about the use of cholesterol-lowering medications before and after 2002 in older adults aged ≥ 70 years. From the National Health and Nutrition Examination Survey years 1999–2002 and 2003–2006, cholesterol-lowering medication use significantly increased overall in adults aged ≥ 60 years (46% vs. 57%), but no information was reported about use in this age group that had CHD and/or with diabetes.15_ENREF_14 Physician prescribing inertia despite clinical practice guidelines or evidence-based data may be due to lack of familiarity of the benefits of specific pharmacotherapy, or difficulty in balancing the impact on quality of life with patient’s comorbidities, functional status, life expectancy and preferences.16 In addition, these publications are somewhat inconsistent regarding the need for cholesterol-lowering medications in the elderly (e.g., those with diabetes but without CHD).7, 14, 17–20 To date, no formal assessment of the impact of these publications on use of cholesterol-lowering medications in the elderly has been undertaken. Therefore this study examines whether utilization patterns of cholesterol-lowering medications in community-dwelling older adults changed following the release of the NCEP ATP III guidelines and results from the PROSPER in 2002. The Health, Aging and Body Composition Study, a cohort study that enrolled well-functioning elders aged ≥ 70 years, provided an opportunity to examine our research question.
METHODS
Study Design, Sample, and Source of Data
An interrupted time-series analysis was used to examine yearly level and slope (trend) changes in the utilization of cholesterol lowering medications.21 A random sample of 3075 black and white men and women, aged 70–79, were recruited from Medicare beneficiaries residing in Pittsburgh, PA and Memphis, TN.22, 23 The baseline visit of the Health Aging and Body Composition Study occurred in 1997/1998 at which time participants reported no difficulty walking one-quarter of a mile (400 m), climbing 10 steps without resting, performing basic activities of daily living; no use of a cane, walker, crutches or other special equipment to ambulate. 22, 23 Twenty baseline participants were excluded because of missing medication information. The study was approved by the Institutional Review Boards of the Universities of Pittsburgh and Tennessee, and written informed consent was obtained from each participant.
Data Collection and Data Management
The information collected annually during in-person visits by trained interviewers included blood samples, a battery of detailed physiological measurements and questionnaire material regarding sociodemographic characteristics, multiple aspects of health behavior and health status, and medication use.22, 23 From the collected fasting blood samples obtained in 1997–1998, 2002–2003, 2004–2005, 2007–2008, serum cholesterol, HDL-C and triglyceride values were determined by a colorimetric technique on a Vitros 950 analyzer (Johnson & Johnson, New Brunswick, NJ). LDL-C was calculated using the Friedewald equation.24, 25 Both health behavior and health status factors and medication use data were used to define specific conditions of interest in this study (i.e., diabetes mellitus and hypertension). Hypertension was defined by self-reported diagnosis of hypertension and use of anti-hypertensive medications.26 Diabetes was defined by self-reported diagnosis of diabetes or use of anti-diabetic medications.27 Several comorbidities examined in the current study (i.e., CHD, stroke, or peripheral artery disease [PAD]) were centrally adjudicated by a post hoc committee based on conclusive evidence from hospitalization or death records.22, 23
For medications, at baseline (1997–1998), and annually for 10 years (except years 2000–2001, 2003–2004, and 2005–2006), participants were asked to bring all prescription medications taken in the previous month. Trained interviewers transcribed information from the medication containers on medication name, dosage form, and whether the medication was taken as needed. The medication data were coded using the Iowa Drug Information System and then entered into a computerized database.28 These methods of medication data collection are considered highly accurate and concordant with information contained in pharmacy claims data.29
Outcome Variable: Cholesterol-Lowering Medication Use
The dichotomous outcome variable was use of any cholesterol-lowering medication from any of two discrete classes: 1) statins, and 2) others (i.e., fibrates, bile acid binding resin agents, probucol, niacin, and cholesterol absorption inhibitors (i.e., ezetimibe)). These two classes correspond to IDIS codes 24060009–24060404 and 88080004.28
Primary Independent Variable
The independent variable for these analyses was time (i.e., baseline [1997–1998] and each follow-up year). The year 2002 was the year in which the NCEP ATP III guidelines and the results of the PROSPER were released. Therefore, two non-overlapping time segments were defined for the time series: 1997–2002 and 2003–2008.
Covariates
Several characteristics that could potentially confound or modify cholesterol-lowering medication use were adjusted for in the analysis, and were grouped into three domains: 1) sociodemographic, and 2) health-related behaviors and 3) health status.30–33 Sociodemographic factors that were characterized as categorical variables included race (black, white), sex, study site, education (postsecondary education, high school graduate, and less than high school graduate), and living status (alone, not alone). Age was considered as a continuous variable. A dichotomous time-varying variable for prescription drug coverage was also included to account for patients on and off insurance over the study period.
Health-related behaviors were characterized as categorical variables for smoking status and alcohol use (current, past, or never). Health status factors were characterized as dichotomous measures (present vs. absent) for self-reported health conditions, including congestive heart failure, chronic kidney disease, pulmonary disease, and cancer. A time-varying dichotomous variable was created for self-rated health (excellent/good vs. not). A categorical variable for body mass index (BMI- underweight or normal [<25.0 kg/m2], overweight [25.0–29.9 kg/m2], or obese [≥30.0 kg/m2] was created.34 The number of overall prescription medications (excluding cholesterol-lowering drugs) was included as a time-varying continuous variable as a proxy for comorbidity.35 Dichotomous variables were created for cognitive impairment (3MS < 80) and high depressive symptoms (Center for Epidemiologic Studies Depression Scale score >15).36, 37 Interviewers were trained with the standard manual of operation and certificated for all the clinical assessments (e.g., 3MS test).38
Main Statistical Analyses
All analyses were performed using SAS® version 9.3 (SAS Institute Inc. Cary, NC). Appropriate descriptive statistics (mean, standard deviation, frequency and percentage) were employed to summarize participant characteristics and main analytic variables. For descriptive purposes, we also reported the prevalence of fibrate and ezetimibe use separately from other non-statin agents because fibrates were the second commonly used cholesterol lowering medications and ezetimibe was introduced to the market in 2002.15 We conducted a multivariable interrupted time-series analysis (using generalized estimating equations [GEE]) to estimate changes in the level and the slope (trend) of the outcome rates after 2002.21, 39 This analysis used the SAS® GENMOD procedure with an autoregressive working correlation structure to account for potential multiple years of data from the same participants and the resulting stochastic non-independence of observations.21, 39 Specifically, level changes were calculated by comparing the predicted prevalence use in the year 2002–2003, which was extrapolated from the slope of the time series 1997–2002, with the observed prevalence use in the year 2002–2003. The level changes were calculated as an adjusted odds ratio (OR) and 95 percent confidence interval (95% CI). An odds ratio greater than one for level changes would indicate that the 2002 publications did have an immediate impact on cholesterol-lowering medication use. Slope or trend changes were calculated as the ratio of adjusted odds ratios and 95% CI. This approach estimates the change in cholesterol-lowering medication use following 2002 publications controlling historical year-to-year changes prior to 2002 as well sociodemographic, health-related behaviors and health status factors.40 A ratio of adjusted odds ratios for slope or trend changes greater than one would indicate that the guidelines had an impact on yearly rate of increase in cholesterol-lowering medication use. Both sociodemographic, health-related behaviors and health status factors were controlled for in these multivariable analyses.
Sensitivity and Stratification Analyses
A series of sensitivity analyses were conducted to better understand and assure the robustness of the main findings. First, changes in utilization patterns of cholesterol-lowering medications were evaluated among four mutually exclusive subgroups using the definitions of risk factors based on the 2002 NCEP ATP III guidelines.7 The four subgroups were: 1) any CHD (including myocardial infarction, angina pectoris, surgical or percutaneous revascularization); 2) no CHD, diabetes only (CHD risk equivalent); 3) no CHD or diabetes, but either with PAD, stroke, or ≥ 2 CHD risk factors (hypertension, current smoking, or low-levels of HDL-C [i.e., < 35 mg/dL]), and 4) no CHD or diabetes or PAD or stroke, and < 2 CHD risk factors. Those with PAD (n=83) or stroke only (n=86) were considered into group 3 because of insufficient sample sizes for examining the impact of these conditions separately, and many of these elders had multiple comorbidities/risk factors. For the second sensitivity analyses, we replaced missing covariate values with those generated using the multiple imputation.41 Most demographic and health behavior/status covariates had complete information, and none had more than 5% with missing information. The third sensitivity analysis was performed by restricting the analysis to only those with data for the entire 10 year time period. The final sensitivity analyses used 2004–2005 as the index year to separate the pre- and post-guideline periods and allow for a potential lag effect from dissemination and physician awareness of the guidelines. A year lag effect was selected because it may take at least 1 to 1.5 years for physicians being informed about these publications through different sources.42, 43 Finally, a stratification analysis by race was conducted to examine any differences in utilization patterns.
RESULTS
The baseline characteristics are shown in Table 1 according to all participants. Among 3055 participants, mean age was 74 years, 52% were female, 41% were black, 30% lived alone, 62% had prescription medications coverage, 5% had severe depressive symptoms, and 10% had cognitive impairment. Table 2 shows the prevalence of cholesterol-lowering medication use in the elderly from 1997–2008. Overall, 14.9% of the elders took cholesterol-lowering drugs at baseline (1997–1998) with statins accounting for 87% of the overall rate. The overall rate of cholesterol-lowering drugs use increased to 26.7% in 2001–2002 and to 42.6% by 2007/2008. In particular, statin use increased to 24.9% in 2001–2002 and to 39.1% in 2007–2008. The use of fibrates slightly increased from 1% in 1997–1998 to 2% in 2007–2008, and the use of bile acid sequestrants, probucol, and niacin remained the same over that 10 year time period (about 1.5%). The use of ezetimibe increased from 0.1% in 2002 when introduced to the market to 5% in 2007–2008.
Table 1.
Baseline Characteristics of the Health ABC Cohort and Four Subgroups (N=3,055)a
| Sociodemographic Factors | All (n=3,055) | Any CHD (n=556) | Diabetes only (n=349) | PAD, or Stroke or 2+ risk factors (n=836) | <2 risk factors (n=1314) |
|---|---|---|---|---|---|
| Age, mean (SD) | 73.6 (2.9) | 74.0 (2.9) | 73.5 (2.9) | 73.4 (2.9) | 73.6 (2.9) |
| Female sex | 1574 (51.5) | 202 (36.3) | 169 (48.4) | 404 (48.3) | 799 (60.8) |
| Black race | 1266 (41.4) | 220 (39.6) | 211 (60.5) | 372 (44.5) | 463 (35.2) |
| Pittsburgh site | 1516 (49.6) | 305 (54.9) | 164 (47.0) | 401 (48.0) | 646 (49.2) |
| Education | |||||
| Postsecondary | 1285 (42.2) | 227 (40.8) | 117 (33.7) | 355 (42.7) | 586 (44.6) |
| High school | 996 (32.7) | 182 (32.7) | 105 (30.3) | 283 (34.1) | 426 (32.4) |
| Less than high school graduate | 766 (25.1) | 147 (26.4) | 125 (36.0) | 193 (23.2) | 301 (22.9) |
| Living alone | 920 (30.2) | 146 (26.3) | 111 (31.8) | 257 (30.7) | 406 (30.9) |
| Prescription drug coverage | 1883 (61.7) | 383 (68.9) | 213 (61.2) | 499 (59.9) | 788 (60.0) |
| Health-related behaviors | All (n=3,055) | Any CHD (n=556) | Diabetes only (n=349) | PAD, Stroke, or 2+ risk factors (n=836) | < 2 risk factors (n=1314) |
|---|---|---|---|---|---|
| Smoking status | |||||
| Current | 316 (10.4) | 53 (9.6) | 30 (8.7) | 187 (22.4) | 46 (3.5) |
| Past | 1397 (45.8) | 311 (56.0) | 165 (47.6) | 324 (38.8) | 597 (45.5) |
| Never | 1337 (43.8) | 191 (34.4) | 151 (43.80) | 324 (38.8) | 670 (51.0) |
| Alcohol use | |||||
| Current | 1505 (49.5) | 276 (49.8) | 100 (28.7) | 422 (50.8) | 707 (54.0) |
| Past | 677 (22.3) | 141 (25.5) | 134 (38.5) | 192 (23.1) | 210 (16.0) |
| Never | 859 (28.3) | 137 (24.7) | 114 (32.8) | 216 (26.0) | 392 (30.0) |
| Health Status Factors | All (n=3,055) | Any CHD (n=556) | Diabetes only (n=349) | PAD, Stroke, or 2+ risk factors (n=836) | < 2 risk factors (n=1314) |
|---|---|---|---|---|---|
| Congestive heart failure | 40 (1.3) | 22 (4.2) | 6 (1.7) | 10 (1.2) | 2 (0.2) |
| Chronic kidney disease | 45 (1.5) | 11 (2.0) | 5 (1.4) | 12 (1.4) | 17 (1.3) |
| Pulmonary disease | 127 (4.2) | 26 (4.7) | 20 (5.8) | 26 (3.1) | 55 (4.2) |
| Cancer | 577 (18.9) | 112 (20.2) | 57 (16.3) | 164 (19.6) | 244 (18.6) |
| Excellent/good self- rated health | 2558 (83.8) | 418 (75.2) | 261 (74.8) | 691 (82.8) | 1188 (90.4) |
| Body mass index | |||||
| Under/Normal | 982 (32.1) | 173 (31.1) | 71 (20.3) | 233 (27.9) | 505 (38.4) |
| Overweight | 1293 (42.3) | 237 (42.6) | 146 (41.8) | 364 (43.5) | 546 (41.6) |
| Obese | 780 (25.5) | 146 (26.3) | 132 (37.8) | 239 (28.6) | 263 (20.0) |
| Number of prescription drugs, mean (SD) | 2.9 (2.6) | 4.4 (2.9) | 4.0 (2.7) | 2.9 (2.4) | 2.1 (2.3) |
| Severe depressive symptoms (CES-D > 15) | 144 (4.8) | 31 (5.6) | 15 (4.4) | 41 (4.9) | 57 (4.4) |
| Cognitive impairment (3MS< 80) | 304 (10.0) | 59 (10.7) | 44 (12.7) | 89 (10.7) | 112 (8.6) |
| Lipid profiles | All (n=3,055) | Any CHD (n=556) | Diabetes only (n=349) | PAD, Stroke, or 2+ risk factors (n=836) | < 2 Risk factors (n=1314) |
|---|---|---|---|---|---|
| Total cholesterol (mg/dL), mean (SD) | 202.8 (38.7) | 193.7 (39.5) | 201.1 (39.4) | 199.7 (40.0) | 209.0 (36.3) |
| LDL-C (mg/dL), mean (SD) | 121.7 (34.8) | 115.5 (35.5) | 122.3 (35.4) | 122.7 (35.7) | 123.4 (33.4) |
| HDL-C (mg/dL), mean (SD) | 53.9 (17.0) | 49.3 (16.4) | 50.6 (15.6) | 46.8 (12.4) | 61.2 (17.2) |
| Triglyceride (mg/dL), mean (SD) | 138.7 (82.9) | 148.3 (87.1) | 144.1 (91.7) | 156.2 (102.6) | 122.3 (58.3) |
Data represented as N (%), unless otherwise stated;
Abbreviations: CES-D: Center for Epidemiologic Studies-Depression scale; HDL-C: high-density lipoprotein cholesterol; LDL-C: low-density lipoprotein cholesterol, PAD: peripheral artery disease
Table 2.
Prevalence of Cholesterol-Lowering Medication Use from 1997–2008
| 1997–1998 (n=3055) | 1998–1999 (n=2908) | 1999–2000 (n=2820) | 2001–2002 (n=2631) | 2002–2003 (n=2515) | 2004–2005 (n=1780) | 2006–2007 (n=1592) | 2007–2008 (n=1344) | |
|---|---|---|---|---|---|---|---|---|
| n (%) | n (%) | n(%) | n(%) | n(%) | n(%) | n(%) | n(%) | |
| Any cholesterol lowering medications | 456 (14.9) | 509 (17.5) | 586 (20.8) | 702 (26.7) | 737 (29.3) | 656 (36.9) | 676 (42.5) | 573 (42.6) |
|
| ||||||||
| Any statins | 395 (12.9) | 461 (15.9) | 542 (19.2) | 654 (24.9) | 695 (27.6) | 615 (34.6) | 620 (38.9) | 525 (39.1) |
| Any fibrates | 35 (1.2) | 30 (1.0) | 32 (1.1) | 33 (1.3) | 29 (1.2) | 29 (1.6) | 33 (2.0) | 28 (2.1) |
| Any bile acid sequestrants, probucol, niacins | 43 (1.4) | 33 (1.1) | 33 (1.2) | 35 (1.3) | 40 (1.6) | 21 (1.2) | 21 (1.3) | 21 (1.6) |
| Any ezetimibe | 0 (0) | 0 (0) | 0 (0) | 0 (0) | 2 (0.1) | 38 (2.1) | 77 (4.8) | 69 (5.1) |
Table 3 shows the results of the multivariable interrupted time-series analysis estimating changes in the level and the slope (trend) of cholesterol lower drug use rates after 2002. There was no level change of any cholesterol-lowering medication use the year before compared with the year after 2002 (adjusted OR 0.95, 95% CI 0.89 to 1.02). The multivariable results also revealed a decline in trend changes for the rate of increase in cholesterol-lowering medication after 2002 (adjusted ratio of odds ratios 0.92, 95% CI 0.89 to 0.95). Similar results for lack of change in level but changes in trend were seen for statin and other cholesterol lowering medications. (Table 3).
Table 3.
Effect of the Release of the NCEP ATP III Guidelines and Results from PROSPER Study in 2002 on Cholesterol-Lowering Medications Usea
| Drug Class | Level Changes | Trend Changes | ||||
|---|---|---|---|---|---|---|
|
| ||||||
| Observed vs. Predicted (using pre-guideline trend) Difference in Use in year 2003 (Adjusted OR, 95% CI) a | P-value | Pre-Guideline Trend per year (Adjusted OR and 95% CI) a | Post-Guideline Trend per year (Adjusted OR and 95% CI) a | Post-vs. Pre-Guideline Difference in Trends Over Time per year (Adjusted ROR, 95% CI) a | p-value | |
| Any Cholesterol Lowering Medication Use | 0.95 (0.89, 1.02) | 0.18 | 1.18 (1.15, 1.20) | 1.09 (1.02, 1.15) | 0.92 (0.89, 0.95) | <0.0001 |
| Any Statin Use | 0.95 (0.88, 1.01) | 0.12 | 1.19 (1.16, 1.22) | 1.07 (1.01, 1.13) | 0.90 (0.87, 0.93) | <0.0001 |
| Any Fibrate/Other Use | 1.04 (0.83, 1.30) | 0.74 | 1.02 (0.93, 1.08) | 1.24 (1.01, 1.46) | 1.22 (1.10, 1.35) | 0.0003 |
Multivariate generalized estimating equations models adjusted for sociodemographics (race, age, sex, site, education, living status), health behavior (alcohol use), and health status (pulmonary disease, body mass index, polypharmacy, and prescription medications coverage). Polypharmacy and prescription coverage are time-varying variables.
Abbreviation: CI: confidence interval; OR: odds ratio; ROR: ratio of odds ratio
Sensitivity and Stratification Analyses
At baseline, 18% had any history of CHD, 11% had diabetes only, 28% were in the group that had PAD, stroke or ≥ 2 risk factors, and 43% were in the group of < 2 risk factors (Table 1). In Figure 1, among those with any history of CHD, diabetes only, had PAD, stroke, or ≥ 2 risk factors, or no CHD, DM, PAD, or stroke and <2 risk factors, 30.6%, 11.8%, 14.0%, and 9.7% took cholesterol-lowering medications in 1997–1998; 49.9%, 30.1%, 24.0% and 14.6% in 2001–2002; and 68.8%, 46.1%, 35.4%, and 26.6% in 2007–2008, respectively. A similar pattern was seen with statins for each of the four groups. Similar findings were also seen for level and trend changes as noted for the overall sample (data not shown). None of the additional sensitivity analyses appreciably changed our main findings (data not shown). Blacks were less likely than whites to take any cholesterol-lowering medications (whites vs. blacks: 17.2% vs. 11.8% in 1997–1998; 30.2% vs. 21.2% in 2001–2002; and 45.7% vs. 36.8% in 2007–2008, respectively). Similar findings were also seen by race for level and trend changes (data not shown).
Figure 1.
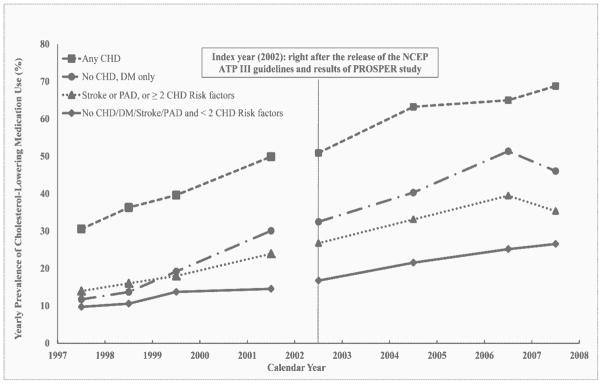
Yearly Prevalence of Cholesterol-Lowering Medication Use by Four Groups from 1997–2008
DISCUSSION
Our study found that the use of cholesterol-lowering medications in the elderly nearly tripled during the period of 1997–2008 (14.9% to 42.6%). Moreover, as one might expect given their greater ability to reduce LDL-C, statins were the most common drug class used. These findings are consistent with that reported by other studies.15, 33, 44–46 It was interesting to find that only half of those with known CHD and/or diabetes received any cholesterol lowering agent. It is difficult to determine if this represents under use of an important medication for secondary prevention as shown in other studies,47–49 or rational omission since published data is only valid for those up to 82 years of age,14, 50 and the mean age of Health ABC study participants in 2007–2008 was 82.4 ± 2.8 years. It is also notable that use of cholesterol lowering agents for primary prevention (i.e., those without CHD equivalent risk factors) occurred in up to 26.6% participants despite the lack of convincing efficacy evidence and the potential for greater adverse drug effects in older adults.51 Similar to the reports by other studies,15, 33, 44 despite the observed increase in cholesterol-lowering medication use in both racial groups, blacks remained less likely than whites to take cholesterol-lowering medications. A possible explanation is that long-term persistence in statin use has been shown to be worse in older blacks than whites.52
We hypothesized that after the release of the NCEP ATP III guidelines and the results from the PROSPER Study in 2002, that the use of cholesterol-lowering medication would increase immediately (i.e., change in level). However, our study showed this new data in 2002 had no immediate impact on cholesterol-lowering medication use. One possible explanation for this finding is that the dissemination and implementation of clinical guidelines and evidence-based results are complex and take years to overcome barriers in clinical practice.53, 54 Additional unique factors in the elderly that may further contribute to the lag in dissemination of evidenced-based guidelines in to clinical practice for the elderly include difficulty in translating the results from highly selective trial populations to a heterogeneous community population, competing causes of morbidity and mortality (e.g., cancer), polypharmacy and drug interactions, short remaining life expectancy, reported poor adherence of statins, and patient economic concerns.52, 55–57
We also hypothesized that after 2002 that there would be an increase in yearly rate of cholesterol-lowering medication use (i.e., change in slope). Instead, we saw that there was a decrease in the yearly rate of increase of cholesterol-lowering medication use. Although the use of cholesterol-lowering medication in the elderly has increased substantially over time, the change in slope declined with advancing age is consistent with the findings from other studies.47–49
So what are the clinical implications of these study findings for clinical pharmacy practice? The potential underuse of cholesterol lowering therapy in those elders aged ≥ 80 with CHD or risk equivalent that was observed in this study may be appropriate as summarized by a recent review.18 The authors concluded that there is insufficient evidence to support the initiation or continuation of cholesterol-lowering treatment in this patient group.18 Moreover, it may also be appropriate to not utilize cholesterol-lowering medications in those elders with CHD or risk equivalent that also have a limited life expectancy given that it takes 2 to 5 years of statin treatment to reduce the risk of cardiovascular events.13 Lack of secondary prevention with cholesterol-lowering medications in older adults may also be justified given that they are at higher risk to experience adverse effects (e.g., myalgia with statins). This increase in the risk of cholesterol-lowering medication adverse effects may be due to a number of factors including: 1) age-related decline in systemic clearance, 2) multiple comorbidities and medications, 3) drug interactions (e.g. macrolides inhibiting CYP3A4 hepatic enzyme metabolism of atorvastatin, lovastatin or simvastatin), and 4) medication adherence difficulties that can be seen especially in those with cognitive impairment.58, 59 Having said this, the use of these agents should not be considered as contraindicated for elders aged ≥ 80 years in good health since the potential benefit may be most pronounced in this patient group due to the known increased risk of coronary heart disease with increasing age. It is important for health care professionals to discuss these potential benefits and risks with older patients with CHD or risk equivalent and take into account their informed preferences.57
Some limitations should be taken into account when interpreting the results of this study. Inherent to most longitudinal studies examining a broad range of older adults, the potential for survivor bias should be considered. However, the results from a sensitivity analysis, restricted to participants in the study from 1997–2008, yielded similar results. It is also possible that any use of cholesterol-lowering medications may be underestimated as medication use was measured at multiple fixed annual time points. We also cannot rule out potential confounding by such factors as family history of premature CHD, dietary therapy, and adherence to medications as information about these were not collected in the Health ABC study. Lastly, the study sample was drawn from two US cities and may not be generalizable to all other populations.
CONCLUSION
This study found that the use of cholesterol-lowering medication increased substantially over a decade in community dwelling elders, but was not related to a change in level or trend following the release of the guidelines and evidence-based data. Further studies are warranted to better guide cholesterol-lowering therapy and investigate the potential benefits and barriers of treatment among the oldest old elders (≥85 years) with CHD or at high risk.
Acknowledgments
FUNDER: Supported in part by National Institute on Aging grants and contracts (R01-AG 027017, P30-AG024827, T32-AG021885, K07-AG033174, R01-AG034056, R01-AG028050, N01-AG-6-2101, N01-AG-6-2103, and N01-AG-6-2106), National Institute of Nursing Research grants (R01-NR010135, R01-NR012459), and Agency for Healthcare Research and Quality grants (R01-HS017695, K12-HS019461, R01-HS018721). This research was also supported in part by the Intramural Research Program of the National Institutes of Health, National Institute on Aging.
Footnotes
CONFLICT STATEMENT: No conflicts of interest were reported.
ABSTRACT/POSTER PRESENTATION: The work was presented in part as a poster at the Gerontological Society of America Annual Scientific Meeting, November, 15, 2012, San Diego, CA
Contributor Information
Wei-Hsuan Lo-Ciganic, Epidemiology, School of Public Health, University of Pittsburgh, Pittsburgh, PA.
Robert M. Boudreau, Department of Epidemiology, School of Public Health, University of Pittsburgh, Pittsburgh, PA.
Shelly L. Gray, School of Pharmacy, University of Washington, Seattle, WA.
Janice C. Zgibor, Department of Epidemiology, School of Public Health, University of Pittsburgh, Pittsburgh, PA.
Julie M. Donohue, Department of Health Policy and Management, School of Public Health, University of Pittsburgh, Pittsburgh, PA.
Subashan Perera, Division of Geriatrics, Department of Medicine, School of Medicine, University of Pittsburgh, Pittsburgh, PA.
Anne B. Newman, Department of Epidemiology, School of Public Health, University of Pittsburgh, Pittsburgh, PA.
Eleanor M. Simonsick, Laboratory of Epidemiology, Demography, and Biometry, Intramural Research Program, National Institute on Aging, Bethesda, MD.
Douglas C. Bauer, Division of General Medicine, Department of Medicine, School of Medicine, University of California at San Francisco, San Francisco, CA.
Suzanne Satterfield, Department of Preventive Medicine, University of Tennessee Health Science Center, Memphis, TN.
Joseph T. Hanlon, Division of Geriatrics, Department of Medicine, School of Medicine, University of Pittsburgh, and Health Scientist, GRECC/CHERP for the Health ABC Study.
References
- 1.Schwartz JB, Zipes DP. Cardiovascular Disease in the Elderly. In: Bonow RO, Mann DL, Zipes DP, Libby P, editors. Bonow: Braunwald’s Heart Disease - A Textbook of Cardiovascular Medicine. 9. Philadelphia, PA: Saunders, An Imprint of Elsevier; 2011. pp. 1727–57. [Google Scholar]
- 2.Roger VL, Go AS, Lloyd-Jones DM, et al. Heart Disease and Stroke Statistics--2012 Update: A Report From the American Heart Association. Circulation. 2012;125:e2–e220. doi: 10.1161/CIR.0b013e31823ac046. Epub 2011/12/20. 10.1161/CIR.0b013e31823ac046. [DOI] [PMC free article] [PubMed] [Google Scholar]
- 3.National Center for Health Statistics. Health, United States, 2010: With Special Features on Death and Dying. Hyattsville, MD: 2011. [PubMed] [Google Scholar]
- 4.Ford ES, Ajani UA, Croft JB, et al. Explaining the decrease in U.S. deaths from coronary disease, 1980–2000. N Engl J Med. 2007;356:2388–98. doi: 10.1056/NEJMsa053935. Epub 2007/06/08. 10.1056/NEJMsa053935. [DOI] [PubMed] [Google Scholar]
- 5.Report of the National Cholesterol Education Program Expert Panel on Detection, Evaluation, and Treatment of High Blood Cholesterol in Adults. The Expert Panel. Arch Intern Med. 1988;148:36–69. Epub 1988/01/01. [PubMed] [Google Scholar]
- 6.Summary of the second report of the National Cholesterol Education Program (NCEP) Expert Panel on Detection. Evaluation, and Treatment of High Blood Cholesterol in Adults (Adult Treatment Panel II) JAMA. 1993;269:3015–23. Epub 1993/06/16. [PubMed] [Google Scholar]
- 7.Third Report of the National Cholesterol Education Program (NCEP) Expert Panel on Detection. Evaluation, and Treatment of High Blood Cholesterol in Adults (Adult Treatment Panel III) final report. Circulation. 2002;106:3143–421. Epub 2002/12/18. [PubMed] [Google Scholar]
- 8.Grundy SM, Cleeman JI, Merz CN, et al. Implications of recent clinical trials for the National Cholesterol Education Program Adult Treatment Panel III guidelines. Circulation. 2004;110:227–39. doi: 10.1161/01.CIR.0000133317.49796.0E. Epub 2004/07/14. 10.1161/01.CIR.0000133317.49796.0E 110/2/227. [pii] [DOI] [PubMed] [Google Scholar]
- 9.Miettinen TA, Pyorala K, Olsson AG, et al. Cholesterol-lowering therapy in women and elderly patients with myocardial infarction or angina pectoris: findings from the Scandinavian Simvastatin Survival Study (4S) Circulation. 1997;96:4211–8. doi: 10.1161/01.cir.96.12.4211. Epub 1998/01/07. [DOI] [PubMed] [Google Scholar]
- 10.Lewis SJ, Moye LA, Sacks FM, et al. Effect of pravastatin on cardiovascular events in older patients with myocardial infarction and cholesterol levels in the average range. Results of the Cholesterol and Recurrent Events (CARE) trial. Ann Intern Med. 1998;129:681–9. doi: 10.7326/0003-4819-129-9-199811010-00002. Epub 1998/12/05. [DOI] [PubMed] [Google Scholar]
- 11.Hunt D, Young P, Simes J, et al. Benefits of pravastatin on cardiovascular events and mortality in older patients with coronary heart disease are equal to or exceed those seen in younger patients: Results from the LIPID trial. Ann Intern Med. 2001;134:931–40. doi: 10.7326/0003-4819-134-10-200105150-00007. Epub 2001/05/16. [DOI] [PubMed] [Google Scholar]
- 12.MRC/BHF Heart Protection Study of cholesterol lowering with simvastatin in 20,536 high-risk individuals: a randomised placebo-controlled trial. Lancet. 2002;360:7–22. doi: 10.1016/S0140-6736(02)09327-3. Epub 2002/07/13. 10.1016/S0140-6736(02)09327-3. [DOI] [PubMed] [Google Scholar]
- 13.Afilalo J, Duque G, Steele R, Jukema JW, de Craen AJ, Eisenberg MJ. Statins for secondary prevention in elderly patients: a hierarchical bayesian meta-analysis. J Am Coll Cardiol. 2008;51:37–45. doi: 10.1016/j.jacc.2007.06.063. Epub 2008/01/05. 10.1016/j.jacc.2007.06.063. [DOI] [PubMed] [Google Scholar]
- 14.Shepherd J, Blauw GJ, Murphy MB, et al. Pravastatin in elderly individuals at risk of vascular disease (PROSPER): a randomised controlled trial. Lancet. 2002;360:1623–30. doi: 10.1016/s0140-6736(02)11600-x. Epub 2002/11/30 S014067360211600X [pii] [DOI] [PubMed] [Google Scholar]
- 15.Li M, Ong KL, Tse HF, Cheung BM. Utilization of lipid lowering medications among adults in the United States 1999–2006. Atherosclerosis. 2010;208:456–60. doi: 10.1016/j.atherosclerosis.2009.08.001. Epub 2009/08/25. 10.1016/j.atherosclerosis.2009.08.001. [DOI] [PubMed] [Google Scholar]
- 16.Cabana MD, Rand CS, Powe NR, et al. Why don’t physicians follow clinical practice guidelines? A framework for improvement. JAMA. 1999;282:1458–65. doi: 10.1001/jama.282.15.1458. Epub 1999/10/27 jrv90041 [pii] [DOI] [PubMed] [Google Scholar]
- 17.Kamari Y, Bitzur R, Cohen H, Shaish A, Harats D. Should all diabetic patients be treated with a statin? Diabetes care. 2009;32(Suppl 2):S378–83. doi: 10.2337/dc09-S344. Epub 2009/11/13. 32/suppl_2/S378 [pii] 10.2337/dc09-S344. [DOI] [PMC free article] [PubMed] [Google Scholar]
- 18.Petersen LK, Christensen K, Kragstrup J. Lipid-lowering treatment to the end? A review of observational studies and RCTs on cholesterol and mortality in 80+-year olds. Age Ageing. 2010;39:674–80. doi: 10.1093/ageing/afq129. Epub 2010/10/19. 10.1093/ageing/afq129. [DOI] [PMC free article] [PubMed] [Google Scholar]
- 19.The effects of cholesterol lowering with simvastatin on cause-specific mortality and on cancer incidence in 20,536 high-risk people: a randomised placebo-controlled trial [ISRCTN48489393] BMC medicine. 2005;3:6. doi: 10.1186/1741-7015-3-6. Epub 2005/03/18. 10.1186/1741-7015-3-6. [DOI] [PMC free article] [PubMed] [Google Scholar]
- 20.Kjekshus J, Apetrei E, Barrios V, et al. Rosuvastatin in older patients with systolic heart failure. N Engl J Med. 2007;357:2248–61. doi: 10.1056/NEJMoa0706201. Epub 2007/11/07. 10.1056/NEJMoa0706201. [DOI] [PubMed] [Google Scholar]
- 21.Wagner AK, Soumerai SB, Zhang F, Ross-Degnan D. Segmented regression analysis of interrupted time series studies in medication use research. J Clin Pharm Ther. 2002;27:299–309. doi: 10.1046/j.1365-2710.2002.00430.x. Epub 2002/08/14 430 [pii] [DOI] [PubMed] [Google Scholar]
- 22.Simonsick EM, Newman AB, Nevitt MC, et al. Measuring higher level physical function in well-functioning older adults: expanding familiar approaches in the Health ABC study. J Gerontol A Biol Sci Med Sci. 2001;56:M644–9. doi: 10.1093/gerona/56.10.m644. Epub 2001/10/05. [DOI] [PubMed] [Google Scholar]
- 23.Newman AB, Haggerty CL, Kritchevsky SB, Nevitt MC, Simonsick EM. Walking performance and cardiovascular response: associations with age and morbidity--the Health, Aging and Body Composition Study. J Gerontol A Biol Sci Med Sci. 2003;58:715–20. doi: 10.1093/gerona/58.8.m715. Epub 2003/08/07. [DOI] [PubMed] [Google Scholar]
- 24.Holvoet P, Harris TB, Tracy RP, et al. Association of high coronary heart disease risk status with circulating oxidized LDL in the well-functioning elderly: findings from the Health, Aging, and Body Composition study. Arterioscler Thromb Vasc Biol. 2003;23:1444–8. doi: 10.1161/01.ATV.0000080379.05071.22. Epub 2003/06/07. 10.1161/01.ATV.0000080379.05071.22 01.ATV.0000080379.05071.22. [pii] [DOI] [PubMed] [Google Scholar]
- 25.Friedewald WT, Levy RI, Fredrickson DS. Estimation of the concentration of low-density lipoprotein cholesterol in plasma, without use of the preparative ultracentrifuge. Clin Chem. 1972;18:499–502. Epub 1972/06/01. [PubMed] [Google Scholar]
- 26.Newman AB, Simonsick EM, Naydeck BL, et al. Association of long-distance corridor walk performance with mortality, cardiovascular disease, mobility limitation, and disability. JAMA. 2006;295:2018–26. doi: 10.1001/jama.295.17.2018. Epub 2006/05/04 295/17/2018 [pii] 10.1001/jama.295.17.2018. [DOI] [PubMed] [Google Scholar]
- 27.de Rekeneire N, Rooks RN, Simonsick EM, et al. Racial differences in glycemic control in a well-functioning older diabetic population: findings from the Health, Aging and Body Composition Study. Diabetes care. 2003;26:1986–92. doi: 10.2337/diacare.26.7.1986. Epub 2003/07/02. [DOI] [PubMed] [Google Scholar]
- 28.Pahor M, Chrischilles EA, Guralnik JM, Brown SL, Wallace RB, Carbonin P. Drug data coding and analysis in epidemiologic studies. Eur J Epidemiol. 1994;10:405–11. doi: 10.1007/BF01719664. Epub 1994/08/01. [DOI] [PubMed] [Google Scholar]
- 29.Psaty BM, Lee M, Savage PJ, Rutan GH, German PS, Lyles M. Assessing the use of medications in the elderly: methods and initial experience in the Cardiovascular Health Study. The Cardiovascular Health Study Collaborative Research Group. J Clin Epidemiol. 1992;45:683–92. doi: 10.1016/0895-4356(92)90143-b. Epub 1992/06/01. [DOI] [PubMed] [Google Scholar]
- 30.Setoguchi S, Glynn RJ, Avorn J, Levin R, Winkelmayer WC. Ten-year trends of cardiovascular drug use after myocardial infarction among community-dwelling persons > or =65 years of age. Am J Cardiol. 2007;100:1061–7. doi: 10.1016/j.amjcard.2007.04.052. Epub 2007/09/22. 10.1016/j.amjcard.2007.04.052. [DOI] [PubMed] [Google Scholar]
- 31.Lemaitre RN, Furberg CD, Newman AB, et al. Time trends in the use of cholesterol-lowering agents in older adults: the Cardiovascular Health Study. Arch Intern Med. 1998;158:1761–8. doi: 10.1001/archinte.158.16.1761. Epub 1998/09/17. [DOI] [PubMed] [Google Scholar]
- 32.Jackevicius CA, Tu JV, Ross JS, Ko DT, Carreon D, Krumholz HM. Use of fibrates in the United States and Canada. JAMA. 2011;305:1217–24. doi: 10.1001/jama.2011.353. Epub 2011/03/24 305/12/1217 [pii] 10.1001/jama.2011.353. [DOI] [PMC free article] [PubMed] [Google Scholar]
- 33.Mann D, Reynolds K, Smith D, Muntner P. Trends in statin use and low-density lipoprotein cholesterol levels among US adults: impact of the 2001 National Cholesterol Education Program guidelines. Ann Pharmacother. 2008;42:1208–15. doi: 10.1345/aph.1L181. Epub 2008/07/24. 10.1345/aph.1L181. [DOI] [PubMed] [Google Scholar]
- 34.National Heart, Lung, and Blood Institute (NHLBI) Clinical Guidelines on Identification. Evaluation and Treatment of Overweight and Obesity in Adults 1998. 1998 [Google Scholar]
- 35.Schneeweiss S, Wang PS, Avorn J, Glynn RJ. Improved comorbidity adjustment for predicting mortality in Medicare populations. Health Serv Res. 2003;38:1103–20. doi: 10.1111/1475-6773.00165. Epub 2003/09/13. [DOI] [PMC free article] [PubMed] [Google Scholar]
- 36.Teng EL, Chui HC. The Modified Mini-Mental State (3MS) examination. J Clin Psychiatry. 1987;48:314–8. Epub 1987/08/01. [PubMed] [Google Scholar]
- 37.Radloff LS. The CES-D Scale: A Self-Report Depression Scale for Research in the General Population. Appl Psych Measur. 1977;1:385–401. 0.1177/014662167700100306. [Google Scholar]
- 38.Yaffe K, Lindquist K, Penninx BW, et al. Inflammatory markers and cognition in well-functioning African-American and white elders. Neurology. 2003;61:76–80. doi: 10.1212/01.wnl.0000073620.42047.d7. Epub 2003/07/09. [DOI] [PubMed] [Google Scholar]
- 39.Diggle PJ, Heagerty P, Liang K-Y, Zeger SL, editors. Analysis of Longitudinal Data. 2. New York: Oxford University Press Inc; 2002. [Google Scholar]
- 40.Madden JM, Graves AJ, Zhang F, et al. Cost-related medication nonadherence and spending on basic needs following implementation of Medicare Part D. JAMA. 2008;299:1922–8. doi: 10.1001/jama.299.16.1922. Epub 2008/04/24. 10.1001/jama.299.16.1922. [DOI] [PMC free article] [PubMed] [Google Scholar]
- 41.Rubin DB, editor. Multiple Imputation for Nonresponse in Surveys. New Yok: John Wiley and Sons; 1987. [Google Scholar]
- 42.Grol R, Zwaard A, Mokkink H, Dalhuijsen J, Casparie A. Dissemination of guidelines: which sources do physicians use in order to be informed? Int J Qual Health Care. 1998;10:135–40. doi: 10.1093/intqhc/10.2.135. Epub 1998/08/05. [DOI] [PubMed] [Google Scholar]
- 43.Mosca L, Linfante AH, Benjamin EJ, et al. National study of physician awareness and adherence to cardiovascular disease prevention guidelines. Circulation. 2005;111:499–510. doi: 10.1161/01.CIR.0000154568.43333.82. Epub 2005/02/03 111/4/499 [pii] 10.1161/01.CIR.0000154568.43333.82. [DOI] [PubMed] [Google Scholar]
- 44.Robinson JG, Booth B. Statin use and lipid levels in older adults: National Health and Nutrition Examination Survey, 2001 to 2006. J Clin Lipidol. 2010;4:483–90. doi: 10.1016/j.jacl.2010.10.002. Epub 2010/12/03. 10.1016/j.jacl.2010.10.002. [DOI] [PMC free article] [PubMed] [Google Scholar]
- 45.Siegel D, Lopez J, Meier J. Use of cholesterol-lowering medications in the United States from 1991 to 1997. Am J Med. 2000;108:496–9. doi: 10.1016/s0002-9343(00)00319-3. Epub 2000/04/27. [DOI] [PubMed] [Google Scholar]
- 46.Riahi S, Fonager K, Toft E, et al. Use of lipid-lowering drugs during 1991–98 in Northern Jutland, Denmark. Br J Clin Pharmacol. 2001;52:307–11. doi: 10.1046/j.0306-5251.2001.01439.x. Epub 2001/09/19. [DOI] [PMC free article] [PubMed] [Google Scholar]
- 47.Ko DT, Mamdani M, Alter DA. Lipid-lowering therapy with statins in high-risk elderly patients: the treatment-risk paradox. JAMA. 2004;291:1864–70. doi: 10.1001/jama.291.15.1864. Epub 2004/04/22. 10.1001/jama.291.15.1864. [DOI] [PubMed] [Google Scholar]
- 48.Aronow WS. Underutilization of lipid-lowering drugs in older persons with prior myocardial infarction and a serum low-density lipoprotein cholesterol > 125 mg/dl. Am J Cardiol. 1998;82:668–9. A6, A8. doi: 10.1016/s0002-9149(98)00401-9. Epub 1998/09/11. [DOI] [PubMed] [Google Scholar]
- 49.Massing MW, Sueta CA, Chowdhury M, Biggs DP, Simpson RJ., Jr Lipid management among coronary artery disease patients with diabetes mellitus or advanced age. Am J Cardiol. 2001;87:646–9. A10. doi: 10.1016/s0002-9149(00)01447-8. Epub 2001/03/07. [DOI] [PubMed] [Google Scholar]
- 50.Thomas JE, Tershakovec AM, Jones-Burton C, Sayeed RA, Foody JM. Lipid lowering for secondary prevention of cardiovascular disease in older adults. Drugs Aging. 2010;27:959–72. doi: 10.2165/11539550-000000000-00000. Epub 2010/11/23. 10.2165/11539550-000000000-00000. [DOI] [PubMed] [Google Scholar]
- 51.Robinson JG. Lipid-lowering therapy for the primary prevention of cardiovascular disease in the elderly: opportunities and challenges. Drugs Aging. 2009;26:917–31. doi: 10.2165/11318270-000000000-00000. Epub 2009/10/24. 10.2165/11318270-000000000-00000. [DOI] [PubMed] [Google Scholar]
- 52.Benner JS, Glynn RJ, Mogun H, Neumann PJ, Weinstein MC, Avorn J. Long-term persistence in use of statin therapy in elderly patients. JAMA. 2002;288:455–61. doi: 10.1001/jama.288.4.455. Epub 2002/07/23 joc11856 [pii] [DOI] [PubMed] [Google Scholar]
- 53.Field MJ, Lohr KN, editors. Guidelines for Clinical Practice: From Development to Use. Washington, D.C: National Academy Press; 1992. [PubMed] [Google Scholar]
- 54.Green LW. Making research relevant: if it is an evidence-based practice, where’s the practice-based evidence? Family practice. 2008;25(Suppl 1):i20–4. doi: 10.1093/fampra/cmn055. Epub 2008/09/17. 10.1093/fampra/cmn055. [DOI] [PubMed] [Google Scholar]
- 55.Cournot M, Cambou JP, Quentzel S, Danchin N. Key factors associated with the under-prescription of statins in elderly coronary heart disease patients: Results from the ELIAGE and ELICOEUR surveys. Int J Cardiol. 2006;111:12–8. doi: 10.1016/j.ijcard.2005.06.039. Epub 2005/07/28. 10.1016/j.ijcard.2005.06.039. [DOI] [PubMed] [Google Scholar]
- 56.Morley JE. The cholesterol conundrum. J Am Geriatr Soc. 2011;59:1955–6. doi: 10.1111/j.1532-5415.2011.03594.x. Epub 2011/11/19. 10.1111/j.1532-5415.2011.03594.x. [DOI] [PubMed] [Google Scholar]
- 57.Tinetti ME, McAvay GJ, Fried TR, et al. Health outcome priorities among competing cardiovascular, fall injury, and medication-related symptom outcomes. J Am Geriatr Soc. 2008;56:1409–16. doi: 10.1111/j.1532-5415.2008.01815.x. Epub 2008/07/30. 10.1111/j.1532-5415.2008.01815.x. [DOI] [PMC free article] [PubMed] [Google Scholar]
- 58.Raffel OC, White HD. Drug insight: Statin use in the elderly. Nat Clin Pract Cardiovasc Med. 2006;3:318–28. doi: 10.1038/ncpcardio0558. [DOI] [PubMed] [Google Scholar]
- 59.Jacobson TA. Overcoming ‘ageism’ bias in the treatment of hypercholesterolaemia : a review of safety issues with statins in the elderly. Drug Saf. 2006;29:421–48. doi: 10.2165/00002018-200629050-00005. [DOI] [PubMed] [Google Scholar]