

Abstract
Peripheral membrane proteins bound to lipids on bilayer surfaces play central roles in a wide array of cellular processes, including many signaling pathways. These proteins diffuse in the plane of the bilayer and often undergo complex reactions involving the binding of regulatory and substrate lipids and proteins they encounter during their 2-D diffusion. Some peripheral proteins, for example pleckstrin homology (PH) domains, dock to the bilayer in a relatively shallow position with little penetration into the bilayer. Other peripheral proteins exhibit more complex bilayer contacts, for example classical protein kinase C isoforms (PKCs) bind as many as six lipids in stepwise fashion, resulting in the penetration of three PKC domains (C1A, C1B, C2) into the bilayer headgroup and hydrocarbon regions. A molecular understanding of the molecular features that control the diffusion speeds of proteins bound to supported bilayers would enable key molecular information to be extracted from experimental diffusion constants, revealing protein-lipid and protein-bilayer interactions difficult to study by other methods. The present study investigates a range of 11 different peripheral protein constructs comprised by 1 to 3 distinct domains (PH, C1A, C1B, C2, anti-lipid antibody). By combining these constructs with various combinations of target lipids, the study measures 2-D diffusion constants on supported bilayers for 17 different protein-lipid complexes. The resulting experimental diffusion constants, together with the known membrane interaction parameters of each complex, are used to analyze the molecular features correlated with diffusional slowing and bilayer friction. The findings show that both 1) individual bound lipids and 2) individual protein domains that penetrate into the hydrocarbon core make additive contributions to the friction against the bilayer, thereby defining the 2-D diffusion constant. An empirical formula is developed that accurately estimates the diffusion constant and bilayer friction of a peripheral protein in terms of its number of bound lipids and its geometry of penetration into the bilayer hydrocarbon core, yielding an excellent global best fit (R2 of 0.97) to the experimental diffusion constants. Finally, the observed additivity of the frictional contributions suggests that further development of current theory describing bilayer dynamics may be needed. The present findings provide constraints that will be useful in such theory development.
Keywords: PKC, GRP1, cPLA2, PH domain, C1 domain, C2 domain, phosphatidylinositol lipid
Introduction
Many crucial cell signaling pathways are assembled on membrane surfaces when and where they are needed. Assembly is often triggered by the appearance of a localized second messenger, such as a signaling lipid or Ca2+ ion, that in turn recruits a defined set of peripheral membrane proteins to the local bilayer (1–9). These bilayer-targeted signaling proteins bind to specific lipids and undergo 2-dimensional diffusion on the membrane surface thereby enabling collisions with each other – and with key membrane-bound lipids and proteins needed for regulation, signaling complex formation, and enzymatic reactions. The lipid bilayer plays a central role in such surface reactions both by acting as a scaffold that increases the local concentrations of signaling components, and by serving as a diffusion platform that enables dynamic interactions between those components.
Previous exploratory studies have indicated that 2-dimensional diffusion rates of peripheral membrane proteins on planar supported bilayers provide a new window into (i) protein-lipid, (ii) protein-bilayer, and (iii) protein-protein interactions (10–13). Each of these interactions can trigger a significant, detectable change in diffusion speed on the supported bilayer surface that provides key insights into a molecular interaction or event. Supported bilayers lack the diffusional complexities of cell membranes, including the barriers and inhomogeneities imposed by cytoskeletal structures, transmembrane proteins, and lipid microdomains (14). In addition, supported bilayers are flat, especially compared to cell membranes. The overall homogeneity and simplicity of supported bilayers greatly facilitates quantitative 2-dimensional diffusion measurements. Moreover, the unique boundary conditions and interactions of one leaflet with the glass support may expand the dynamic range of lipid and protein diffusion constants in supported bilayers (15,16). Taken together, the characteristic features of supported bilayers make them especially well suited for single molecule mechanistic studies that detect and analyze molecular events based on changes of diffusion speed (11–13). Such diffusional changes can be used to monitor, for example, the events that occur as membrane-recruited signaling proteins become activated by the stepwise binding of activator lipids, regulatory proteins, and substrates.
Previous studies of an anti-lipid antibody and a pleckstrin homology (PH) domain have revealed a remarkably simple relationship between the 2-dimensional diffusion speed and the number of tightly bound lipids (10–12). For example, GRP1 PH domain is known to bind a single PIP3 lipid with minimal protein penetration into the bilayer – it accomplishes this feat by grasping the large (Pi)n-inositol headgroup that projects off the surface of the bilayer (17,18). In this case the PIP3-PH domain complex exhibits the same 2-dimensional diffusion constant, within error, as a single free lipid in the same bilayer (11 ). When 1 to 3 PH domains are chained together by flexible linkers, the supported bilayer 2D diffusion constant is given by D = Dlipid / N where D is the single lipid diffusion constant and N is the total number of PH domains (or, equivalently, the total number of bound PIP3 molecules in the construct) (12). This simple relationship suggests that, to a first approximation, (i) the friction of bound lipids against the bilayer dominates due to 100-fold higher viscosity of bilayer, and (ii) the individual bound lipids make additive contributions to the friction (12). Such simplicity is not predicted by current models of bilayer dynamics, suggesting that the theoretical description of the bilayer is not yet complete (12,16).
More generally, in contrast to the PH domain motif, many peripheral membrane binding proteins not only bind specific lipids but also penetrate significantly into the bilayer (18–26). For such proteins both the bound lipid and penetrating protein components may generate friction against the bilayer that would slow diffusion.
The present study investigates the relationship between the 2-dimensional diffusion constant of an arbitrary peripheral protein, its number of bound lipids, and its degree of protein penetration into the bilayer. The analysis compares the 2-dimensional diffusion constants of 17 different protein-lipid complexes undergoing lateral diffusion on supported bilayers, where the bound lipid stoichiometries and protein-membrane docking geometries are known for each complex. The results indicate that the experimental diffusion constant D slows with increasing contacts between the protein-lipid complex and the bilayer. Strikingly, the findings show that the contributions of individual bound lipids and individual bilayer-contacting domains to the total friction are, to a first approximation, additive. To elucidate the parameter that best defines the contribution of protein-bilayer contacts to friction, a set of candidate parameters is developed and the data reveal the most important frictional contacts are those in the bilayer hydrocarbon core. Looking forward, the study provides a set of constraints that will facilitate future development of dynamic bilayer theories capable of describing the 2D diffusion of peripheral membrane proteins on supported bilayers, and perhaps bilayers in general.
Materials and Methods
Reagents
Synthetic phospholipids PC (phosphatidylcholine; 1,2-dioleoyl-sn-glycero-3-phosphocholine), PS (phosphatidylserine; 1,2-dioleoyl-sn-glycero-3-phospho-L-serine), PIP2 (1,2-dioleoyl-sn-glycero-3-phosphoinositol-4,5-diphosphate), PIP3 (1,2-dioleoyl-sn-glycero-3-phosphoinositol-3,4,5-trisphosphate), DAG (diacylglycerol; 1,2-dioleoyl-sn-glycerol), LRB-PE (1,2-dioleoyl-sn-glycero-3-phosphoethanolamine-N-[lissamine rhodamine B sulfonyl]) and Biotinyl-PE (1,2-dioleoyl-sn-glycero-3-phosphoethanolamine-N-(biotinyl) were from Avanti Polar Lipids (Alabaster, AL). Alexa Fluor 555 (AF555) C2-maleimide and Alexa Fluor 555 (AF555-SE) succinimidyl ester were from Invitrogen (Carlsbad, CA). 2-mercaptoethanol was from Fluka (Buchs, Germany). CoA trilithium salt was from Sigma (St. Louis, MO). Goat polyclonal anti-biotin antibody (IgG) was from Abcam (Cambridge, MA). TCEP was from Thermo Fisher Scientific (Rockford, IL). Ultrapure (>99%) BSA from Sigma-Aldrich (St. Louis, MO).
AF555-labeled proteins
DNA sequences encoding human cPLA2 C2 (residues 1-138), human PKCα C2 (residues 155-293), human PKCα C1 (C1A-C1B, residues 27-165), human PKCα C1C2 (C1A-C1B-C2, residues 27-292) and human PKCα C1B (residues 94-165) were inserted into both pGEX-4T1 and pMAL-c2G expression vectors. To enable sequence-specific labeling with a CoA-linked fluorophore, each respective 5′-term PCR amplification oligonucleotide was synthesized (Integrated DNA Technologies, Coralville, IA) to include the 11-amino acid recognition sequence for Sfp phosphopantethienyl-transferase (27), such that the labeling sequence resides upstream of the insert. DNA sequencing confirmed the correct full sequence of all final constructs. Human GRP1 PH (residues 255-392) monomer or multimer constructs were prepared as described previously (12). Human MARCKS ED peptide (MARCKSp, residues 151-175) was fabricated by SynBioSci Corporation (Livermore, CA) and includes an N-terminal cysteine residue (N-CKKKKKRFSFKKSFKLSGFSFKKNKK-C).
Recombinant proteins were expressed in E. coli Rosetta 2 (DE3) cells as N-terminal glutathione S-transferase (GST) or maltose-binding protein (MBP) fusions, and purified using glutathione affinity resin or amylose resin (New England Biolabs) as described previously (28,29). Proteins were labeled with AF555 by Sfp enzyme using our published protocol (12,27). Briefly, ~2 μM target protein was incubated with 2.5 μM Alexa Fluor 555-CoA conjugate and 0.5 μM Sfp at room temperature for 1 hr. Excess fluorophore was removed by buffer exchange in Vivaspin concentrators (Sartorius Stedim, Göttingen, Germany) until the flow-through was not visibly colored by AF555 absorption, and the flow-through was checked for absorbance at 555 nm. Concentration of labeled protein and labeling efficiency were determined from the measured absorbances of AF555 and intrinsic tryptophan residues.
MARCKS ED peptide (MARCKSp) was labeled by incubating ~1 μM target protein and 1.5 μM AF555-maleimide in the presence of 1 μM TCEP at room temperature for 1 hr. Anti-biotin IgG was labeled by adding 1 μL of 1M sodium bicarbonate to 10 μL of 1 mg/mL (10 μg) antibody in phosphate buffered saline, and then incubating with ~20 μg AF555-succinimidyl ester for 1 hr at room temperature. Free fluorophore was removed from each labeling reaction and labeling efficiency was determined as described above.
Supported lipid bilayer preparation
Supported lipid bilayers were prepared from sonicated unilamellar vesicles (SUVs) as described previously (11,12). Table 1 lists the lipid compositions of the supported bilayers employed herein. To make SUVs, the desired phospholipids were solubilized in chloroform:methanol:water (5:6:2) at the desired lipid molar ratio, then the solvent was removed by vacuum prior to lipid rehydration with aqueous storage buffer (140 mM KCl, 15 mM NaCl, 0.5 mM MgCl2, 0.02% NaN3, 20 mM 2-mercaptoethanol, 25 mM HEPES, pH 7.5). The resulting aqueous lipid suspension (3.0 mM total lipid), was sonicated with a Misonix XL 2020 probe sonicator to produce sonicated, unilamellar vesicles that could be stored at 4°C for up to 5 days before use. To make supported bilayers, glass coverslips (Pella, Redding, CA) were soaked for 1 h in piranha solution (3:1 H2SO4:H2O2), rinsed extensively with Milli-Q water, dried under a stream of N2, and irradiated for 0.8 h in a Novascan PSD-UV ozone cleaner. A 60 μM perfusion chamber (Invitrogen; Eugene, OR) was adhered to each cleaned glass slide and supported bilayers were formed via the vesicle fusion method using the SUVs described above (11,12,28,29). The resulting bilayers were rinsed extensively with Milli-Q water and then exchanged into room temperature assay buffer (140 mM KCl, 15 mM NaCl, 0.5 mM MgCl2, 5 mM reduced L-glutathione, 25 mM HEPES, pH 7.5) in preparation for TIRFM measurements. To improve fluidity and block imperfections in bilayers, 100 μg mL−1 BSA (30) was incubated for 30 minutes and subsequently rinsed from each bilayer where recombinant PKC regulatory proteins or anti-biotin antibodies were assayed. Control experiments using fluorescent lipid and a lipid-binding protein tested and confirmed this BSA blocking step did not significantly affect bilayer fluidity or protein-bilayer interactions.
Table 1.
Lipid compositions of supported lipid bilayers
| Lipid mixture | Lipid mole % |
|---|---|
| PC:PS | 75:25 |
| PC:PS:PIP3 | 74:24:2 |
| PC:PS:PIP2 | 74:24:2 |
| PC:PS:DAG | 74:24:2 |
| PC:PS:PIP2:DAG | 73:23:2:2 |
| PC:PS:Biotinyl-PE (high) | 74:24:2 |
| PC:PS:Biotinyl-PE (low) | 75:25:0.001 |
| PC:PS:LRB-PE | 75:25:200 ppb |
All lipids are dioleoyl (DO)
TIRFM measurements
TIRFM experiments were carried out on a home-built, objective-based TIRFM instrument, as described previously (11, 12). Supported lipid bilayers (described above) were imaged before and after addition of fluorescent protein. Typically, only a few dim, rapidly dissociating fluorescent particles were observed on the bilayer prior to protein addition. After protein addition, samples were allowed to equilibrate 5 min to the ambient room temperature of 22.5 ± 0.6 °C. To minimize contributions from small numbers of immobile fluorescent particles (presumably inactive protein aggregates), a bleach pulse ~30-fold higher power than used for imaging was applied for 2–5 s, then fluorescence was allowed to recover for 60 s before data acquisition. Movie streams were acquired at a frame rate of 20 frames/s, and a spatial resolution of 4.2 pixels/μm, for each sample using NIS Elements Basic Research (Nikon). Subsequent particle tracking analysis was carried out using ImageJ (31), and data processing and fitting were carried out using Mathematica (Wolfram Research), IGOR Pro (WaveMetrics) and GraphPad Prism 5 (GraphPad Software, Inc.).
Single particle tracking
As in our previous studies (11,12), diffusion trajectories of single fluorescent lipid and protein molecules were tracked and quantitated using the Particle Tracker plugin for ImageJ (31), then diffusion data was imported into Mathematica for further analysis. Briefly, the plugin determines the center position and intensity of each fluorescent particle in each frame, then links the particles in successive frames to form trajectories. Only particles possessing fluorescence intensities within a defined range were included in the analysis, thereby eliminating bright protein aggregates and dim, non-protein contaminants. Additional exclusions removed immobile particles, rapidly dissociating particles, and overlapping tracks for which particle identity is lost. All exclusions were described and validated previously (11, 12).
Determination of diffusion coefficients from single molecule data
Each data set was analyzed in three ways to determine the best model (i) a homogeneous, 1-component fit; (ii) a 2-component Rayleigh fit; and (iii) a 3-component Rayleigh fit, as described previously (12). Briefly, trajectory displacement data from were calculated for Δt = 8 frames (0.16 s) and converted to binned probability distribution histograms. These distributions were fit to a single component distribution, or the sum of two Rayleigh distributions, or the sum of three Rayleigh distributions as in (12).
Modeling
Modeling of bilayer-embedded, protein-lipid complexes was performed in PyMol (DeLano Scientific). The lipid bilayer was assumed to be perfectly planar, and was divided into parallel layers of established, experimentally-determined thicknesses (32) as follows. The headgroup layer was defined as the zone from the average plane of PC choline nitrogen atoms to the average plane of PC acyl chain carbon 2 atoms. The hydrocarbon core was defined as the region between the carbon 2 planes of the opposing leaflets. In addition, to assist in positioning membrane-penetrating proteins, the average backbone phosphate plane was positioned inside the headgroup layer the standard distance from the choline nitrogen plane. Subsequently, each protein domain was docked into the bilayer based on its known depth of penetration and docking angle relative to the backbone phosphate plane, thereby reproducing the experimentally determined membrane docking geometry. For this application, C1A and C1B are modeled as PKCγ C1B (PDB ID 1TBN) and were placed in the model lipid bilayer based on NMR-determined protein-lipid interactions (33). Placements of cPLA2 C2 (PDB ID 1RLW), PKCα C2 (PDB ID 1DSY) and GRP1 PH (PDB ID 1GFY) domains were guided by their EPR-determined docking parameters (18,21,34). MARCKSp placement was guided by several NMR and EPR studies (35–38). After experimentally-guided placement in the model bilayer, the specific regions of each protein exposed to the headgroup layer or the hydrocarbon core were measured. Exposed protein surface area and volume were determined for each bilayer region using the 3V Voss Volume Voxelator (39). Total footprint area (FPA) on the bilayer surface was determined by calculating the two-dimensional cross-sectional area of the protein where it crosses the average PC choline nitrogen plane.(32)(33)(18,21,34)(35–38)(39)
Statistics
Each diffusion coefficient in the text and tables is a mean ± 1 S.D. determined from at least 6 movies obtained in at least 3 separate experiments under identical conditions.
Results
The constructs selected for quantitative 2-D diffusion analysis, and their membrane contact parameters
Figure 1 presents the 11 protein constructs selected for study in their 17 unique lipid binding modes on target bilayers. Each selected construct is well-characterized with respect to (i) the total number and type of lipids it binds, (ii) the structure(s) of its individual protein domains, and (iii) the membrane docking geometry(s) of its protein domains. All but two constructs contain one or more of the following component domains: a C1 domain (C1A and/or C1B) from protein kinase C isoform α (PKCα), a C2 domain from PKCα or from cytosolic phospholipase A2 (cPLA2), and a PH domain from general receptor for phosphoinositides isoform 1 (GRP1). The remaining constructs are the basic effector fragment (MARCKSp, a 25-residue peptide) from the MARCKS protein and an anti-biotin IgG antibody.
Figure 1. The 17 protein-lipid complexes employed in this study.

Shown are schematic views of the 17 protein-lipid complexes modeled into a bilayer as described in Methods. As in Table 2, the complexes are arranged in order of increasing diffusion constant, or decreasing protein-bilayer friction. The protein domains are solid surfaces, their tightly bound lipids are depicted in CPK format, and the surrounding bilayer in stick format (bilayer headgroup atoms including glycerol backbone and ester linkage of acyl chains in red, hydrocarbon chains beginning with carbon 2 in grey). Linker lengths are indicated in grey as the number of amino acids between defined secondary structure elements. The indicated protein domains are from PKC (C1A, C1B, C2), cPLA2 (C2 (cPLA2)), MARCKS protein (MARCKSp), and GRP1 (PH). In the PH-PH* construct one PIP3 binding site is eliminated by mutation (12). Anti-biotin is a divalent IgG antibody.
Figure 2 defines the geometric parameters measured for each construct. Table 2 lists the key parameters for each construct, based on its known lipid binding properties and the membrane docking geometries its component domains, including: the total number (N) and types of bound lipids, total footprint area (FPA(HG)) on the surface of the bilayer, total surface area exposed to the headgroup layer (SA(HG)) or the hydrocarbon core (SA(HC)) of the membrane, and total volume within the headgroup layer (V(HG)) or the hydrocarbon core (V(HC)).
Figure 2. Schematic upper leaflet of a supported bilayer, showing the definitions of key parameters.
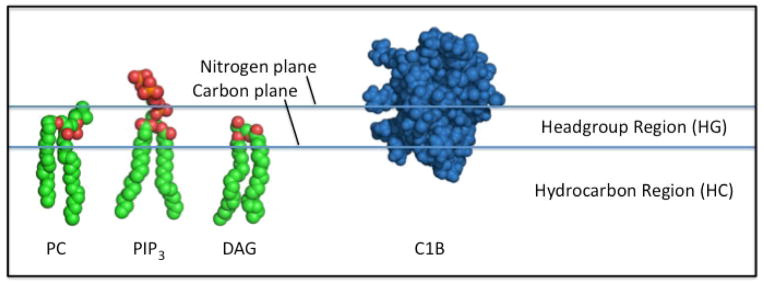
Shown are representative lipids and a membrane-penetrating PKC C1B domain. The headgroup region is the space between the two planes defined by (i) the average position of the PC choline headgroup nitrogen atoms (the nitrogen plane), and (ii) the average position of the PC acyl chain carbon 2 atoms (the carbon plane). As noted by Nagle & Tristram-Nagle, the distance between these planes is ~9 Å. For dioleoyl lipids, the hydrocarbon region extends 27 Å between the average carbon planes of the two bilayer headgroup regions. Here the footprint area (FPA(HG)) is defined as the protein crossection in the average nitrogen plane of the headgroup region (HG); surface area (SA(HG), SA(HC)) is the protein surface area defined by the rolling water sphere method in the headgroup (HG) or hydrocarbon (HC) region; volume (V(HG), V(HC)) is the protein volume within the same surface area in the headgroup (HG) or hydrocarbon (HC) region.
Table 2.
Experimental diffusion constants, frictions, and bilayer contact parameters for 17 protein constructs
| Construct | Bound Lipid(s) | D (μm2/s) | % of Mobile | Friction (1/D ) | Friction Additivity | N | FPA (HG) | SA (HG) | SA (HC) | V (HG) | V (HC) | |
|---|---|---|---|---|---|---|---|---|---|---|---|---|
| a | C1A-C1B-C2 | PS(3), PIP2(1), DAG(2) | 0.22 ± 0.05 | 91.2 ± 2.9 | 4.6 ± 1.1 | f + f + h; d + h | 6 | 910 ± 46 | 2370 ± 119 | 1414 ± 71 | 5895 ± 295 | 1740 ± 87 |
| b | C1A-C1B-C2 | PS(3), PIP2(1) | 0.24 ± 0.08 | 87.9 ± 5.7 | 4.2 ± 1.4 | g + g + h; e + h | 4 | 910 ± 46 | 2370 ± 119 | 1414 ± 71 | 5895 ± 295 | 1740 ± 87 |
| c | C1A-C1B-C2 | PS(4) | 0.29 ± 0.12 | 86.9 ± 7.2 | 3.4 ± 1.5 | g + g + i; e + i | 3 | 872 ± 44 | 2192 ± 110 | 1414 ± 71 | 5895 ± 295 | 1740 ± 87 |
| d | C1A-C1B | PS(2), DAG(2) | 0.33 ± 0.08 | 81.2 ± 5.4 | 3.0 ± 0.8 | f + f | 4 | 748 ± 37 | 1680 ± 84 | 1414 ± 71 | 5008 ± 250 | 1740 ± 87 |
| e | C1A-C1B | PS(2) | 0.34 ± 0.08 | 87.2 ± 8.8 | 2.9 ± 0.7 | g + g | 2 | 748 ± 37 | 1680 ± 84 | 1414 ± 71 | 5008 ± 250 | 1740 ± 87 |
| f | C1B | PS(1), DAG(1) | 0.66 ± 0.10 | 69.3 ±11.6 | 1.5 ± 0.3 | g + r | 2 | 374 ± 19 | 840 ± 42 | 707 ± 35 | 2504 ± 125 | 870 ± 44 |
| g | C1B | PS(1) | 0.80 ± 0.12 | 59.0 ± 5.7 | 1.2 ± 0.2 | NA | 1 | 374 ± 19 | 840 ± 42 | 707 ± 35 | 2504 ± 125 | 870 ± 44 |
| h | C2 | PS(1), PIP2(1) | 1.2 ± 0.1 | 92.8 ± 3.4 | 0.85 ± 0.07 | NA | 2 | 162 ± 8 | 690 ± 35 | 0 | 887 ± 44 | 0 |
| i | C2 | PS(2) | 1.7 ± 0.1 | 88.7 ± 5.5 | 0.58 ± 0.04 | NA | 2 | 124 ± 6 | 512 ± 26 | 0 | 621 ± 31 | 0 |
| j | C2 (cPLA2) | None | 1.5 ± 0.1 | 89.5 ± 5.7 | 0.66 ± 0.05 | NA | 0 | 344 ± 17 | 968 ± 48 | 372 ± 19 | 1825 ± 91 | 425 ± 21 |
| k | MARCKSp | PIP2(3) | 1.1 ± 0.1 | 80.3 ± 3.1 | 1.0 ± 0.1 | r + r + r | 3 | 164 ± 8 | 858 ± 43 | 0 | 885 ± 44 | 0 |
| l | PH-PH-PH | PIP3(3) | 0.84 ± 0.13 | 54.2 ± 9.5 | 1.2 ± 0.2 | r + r + r; o + o + o | 3 | 126 ± 6 | 635 ± 32 | 0 | 567 ± 28 | 0 |
| m | PH-PH | PIP3(2) | 1.6 ± 0.2 | 66.5 ± 11.2 | 0.64 ± 0.08 | < r + r; < o + o | 2 | 84 ± 4 | 423 ± 21 | 0 | 378 ± 19 | 0 |
| n | PH-PH* | PIP3(1) | 2.5 ± 0.1 | 59.7 ± 5.6 | 0.40 ± 0.02 | r; o | 1 | 42 ± 2 | 212 ± 11 | 0 | 189 ± 9 | 0 |
| o | PH | PIP3(1) | 2.5 ± 0.2 | 89.8 ± 7.5 | 0.40 ± 0.04 | r | 1 | 42 ± 2 | 212 ± 11 | 0 | 189 ± 9 | 0 |
| p | Anti-biotin | Biotinyl PE(2) | 1.3 ± 0.1 | 89.6 ± 3.0 | 0.75 ± 0.06 | r + r | 2 | 0 | 0 | 0 | 0 | 0 |
| q | Anti-biotin | Biotinyl PE(1) | 2.6 ± 0.2 | 72.0 ± 9.7 | 0.39 ± 0.03 | r | 1 | 0 | 0 | 0 | 0 | 0 |
| r | LRB-PE | NA | 2.6 ± 0.1 | 84.7 ± 3.9 | 0.38 ± 0.02 | NA | 1 | 0 | 0 | 0 | 0 | 0 |
Construct: indicated protein domains are isolated from PKCα (C1A, C1B, C2), cPLA2 (C2 (cPLA2)), MARCKS protein (MARCKSp), GRP1 (PH); in PH-PH* one PIP3 binding site is eliminated by mutation (12); LRB-PE is fluorescent lipid.
Bound lipids: shown is the type and number of lipids tightly bound to the construct – the total number is N.
Diffusion constant, D: determined by analysis of hundreds of single particle tracks in ≥ 6 movies obtained in ≥ 3 separate experiments under identical conditions – the mean D values of individual movies were averaged to give mean ± SE.
Percent mobile: the mean fraction of the mobile population exhibiting the indicated diffusion constant.
Membrane contact parameters: N (total number of tightly bound lipids); FPA(HG) (protein footprint area Å2 on N-plane of headgroup region); SA(HG or HC) (protein surface area Å2 exposed to headgroup or hydrocarbon region); V(HG or HC) (protein volume Å3 in headgroup or hydrocarbon region). Note that parameters involving cube or square roots must be recalculated by taking the cube or square root of the term for each domain, then summing over all domains in the construct.
References for number of bound lipids per domain: antibody binds one or two target lipids(10); each PH domain binds one PIP3 lipid (11,12,44); cPLA2 C2 domain has no specific lipid binding site (22); PKCa C2 domain binds two PS lipids, or one PS and one PIP2 (19,21,45–47); C1A, C1B each bind one PS and one DAG (26,33,48–50).
Single molecule TIRF quantitation of surface diffusion on supported bilayers, and the measured 2-D diffusion constants
Each construct was labeled with the relatively photostable fluorescent probe AlexaFluor-555 (AF555), and single molecule TIRF microscopy was employed to monitor its binding and surface diffusion on PC/PS (3:1) supported bilayers containing, where indicated, 2 mole percent of additional target lipid(s). Table 1 lists the lipid compositions of the supported bilayers employed. All lipids were dioleoyl (DO, both acyl chains 18:1) so that the bilayer was chain-matched, and experiments were carried out in a near-physiological assay buffer (140 mM KCl, 15 mM NaCl, 0.5 mM MgCl2, 5 mM reduced L-glutathione, 25 mM HEPES, pH 7.5) at 22.5° C.
As in previous studies, single molecule diffusion tracks were recorded with a 20 msec frame rate, and populations of hundreds of tracks were analyzed (11–13). A significant advantage of the single molecule analysis is the ability to resolve diffusional heterogeneity and to filter out minor population components exhibiting anomalous diffusion, thereby more accurately defining the diffusion constant of the major component. For a single domain construct, the diffusing population is often homogeneous, while for multi-domain constructs, as previously observed, the diffusing population often exhibits detectable heterogeneity, presumably due to the increased probability that domain(s) of individual molecules are misfolded or bound to rare bilayer defects (12,13). For each construct, Table 2 presents the diffusion constant (D) of the major component and its fractional contribution to the total population. Due to the greater uncertainties inherent in measuring small step sizes, the error of D increases as diffusion slows.
Bound lipids make additive contributions to total friction
The diffusion constant (D) and the frictional coefficient (f) are defined by a simple inverse relationship:
| Eq. 1 |
Here, for convenience, we define the variable “friction” (F) as the inverse of the diffusion constant, such that friction is directly proportional to the frictional coefficient:
| Eq. 2 |
For the diffusion of peripheral proteins on a membrane the friction against the aqueous solvent is generally negligible and the friction against the bilayer controls the 2-dimensional diffusion rate, since the bilayer is ~100-fold more viscous than the aqueous phase (11,12,14).
Previous studies of surface-associated peripheral proteins bound to lipid headgroups have indicated that individual lipids bound to different protein domains make additive contributions to total friction (10–12,13 ). These studies have found that the friction against the bilayer simply increases linearly with N, the number of lipids tightly bound in the complex (weakly associated boundary lipids are not counted in N), so that the diffusion constant is inversely related to N:
| Eq. 3 |
where F1 lipid is the friction experienced by a single free lipid in the bilayer. Thus, Tamm observed that an antibody bound to 1 or 2 lipids exhibits a diffusion coefficient 1/1 or 1/2 that of a free lipid, respectively (10). Similarly, a subsequent study of PH domain constructs bound to 1, 2 or 3 PIP3 lipids, respectively, found these constructs exhibit diffusion constants 1/1, 1/2 or 1/3 that of a free lipid (12).
Table 2 shows the newly measured diffusion constants for surface-associated antibody bound to 1 or 2 biotin-labeled lipids, and for PH domain constructs bound to 1, 2, or 3 PIP3 lipids, respectively, where all diffusion measurements employed the same standard conditions. The findings reiterate that the diffusion constant is inversely proportional to N, the number of bound lipids, thereby validating the earlier conclusion that bound lipids make additive contributions to total friction and thus are in or near the free draining limit (10–12). The large solvent-exposed regions of the antibody molecule, or the mutant PH* domain that is fully solvent exposed, do not slow diffusion; as a result, antibody-lipid and PH-PH* complexes bound to a single lipid exhibit the same (within error) D as a single PH-lipid complex, or as a single free lipid in the bilayer (Table 2). Thus, as previously noted, only drag against the bilayer makes a significant contribution to friction (10–12).
Bilayer-penetrating protein domains also make additive contributions to total friction
The antibody and PH domain constructs bind lipid headgroups while penetrating very little into the bilayer (Fig. 1). In contrast, the C1 and C2 domain constructs employed in this study exhibit significantly greater penetration into the headgroup layer. Moreover, both C1 domains (C1A, C1B) and one of the C2 domains (cPLA2 C2) employed also penetrate significantly into the hydrocarbon core. These membrane-penetrating domains exhibit significantly larger total frictions than predicted by Equation 3 for their numbers of bound lipids, indicating that protein penetration into the bilayer is generating additional friction. Analysis of the total frictions observed for all the multi-domain constructs, irregardless of whether the domains are surface-bound or membrane-penetrating, reveals a striking result. For the multi-domain constructs the total friction is, with only one exception, equal to the sum of the frictions from its individual domains within error (Table 2). (The exception is a PH-PH construct that diffuses ~20% faster than expected by additivity, consistent with occasional “skating” of this dimeric construct on one PH-lipid contact as previously proposed (13)). The simplest interpretation of this notable trend is that the total friction is composed of additive contributions from both bound lipids and penetrating protein domains:
| Eq. 4 |
Here, the total friction in the denominator possesses (a) a lipid term defined by the total number of tightly bound lipids (Ni, summed over all domains i of the construct) multiplied by the friction of a single lipid (F1 lipid); and (b) a protein penetration term defined by the total protein penetration parameter (Pi, summed over all domains i of the construct) multiplied by a proportionality constant. The relevant F1 lipid and Ni values, together with the parameters used to calculate Pi, are summarized in Table 2. Thus the only unknown parameter is the constant c, which can be determined by global best fitting of Equation 4 to the experimentally determined diffusion constants.
In the simplified approach employed by Equation 4, the number of lipids bound to a given domain (Ni) is used to calculate the bound lipid contribution to the domain friction, which assumes that the frictional contributions of all types of lipids are approximately the same. In the present application this assumption appears to be valid as indicated by the excellent fits Equation 4 provides to the data (see below). All of the lipids used in the present study possess the same acyl chains (di-(18:1)oleoyl), which likely is an important factor in minimizing the frictional differences between lipids, especially since the data indicate that friction is dominated by molecular interactions in the hydrocarbon core rather than in the headgroup layer (see below). In cases where a single domain binds multiple lipids, they could be located too close together to be independent (in the free draining limit (12)). In this case, the additional friction generated by the binding of additional lipids to the same domain in Equation 4 could arise from deeper penetration of the protein into the bilayer triggered by the lipid association, as observed for the binding of PIP2 to PKCα C2 domain already bound to PS (19,21).
Initial search for a molecular quantity that best defines the protein penetration parameter
The measured diffusion constants for 17 protein-lipid complexes enabled an initial search for the molecular quantity(s) that best define the protein penetration parameter P in Equation 4. The candidate quantities are summarized in Table 3; each quantity was tested by using that quantity in the global best fitting of Equation 4 to the measured diffusion constants. In the fitting, Table 2 was used to calculate the candidate quantity for each domain, and the result was used as Pi in Equation 4. (Note for square root and cube root parameters, the root is calculated for individual domains prior to the Eq. 4 sum). The ensuing global fit yielded the best fit constant c, and the goodness of fit parameter R2 that ranges from 0 to 1 – the latter for a perfect fit.
Table 3.
Global best fit parameters of different models for the protein penetration parameter
| Fit Parameter | R2 (1/D) | F1 lipid | c |
|---|---|---|---|
| V(HG+HC) | 0.948 | 0.3806 | 0.00026 ± 0.00003 |
| V(HG+HC)1/3 | 0.801 | 0.3806 | 0.0370 ± 0.0066 |
| SA(HG+HC) | 0.916 | 0.3806 | 0.00042 ± 0.00006 |
| SA(HG+HC)1/2 | 0.815 | 0.3806 | 0.0135 ± 0.0024 |
| FPA(HG) | 0.929 | 0.3806 | 0.00171 ± 0.00022 |
| FPA(HG)1/2 | 0.777 | 0.3806 | 0.0648 ± 0.0120 |
| V(HG) | 0.939 | 0.3806 | 0.00032 ± 0.00004 |
| V(HG)1/3 | 0.804 | 0.3806 | 0.0360 ± 0.0063 |
| SA(HG) | 0.875 | 0.3806 | 0.00056 ± 0.00009 |
| SA(HG)1/2 | 0.780 | 0.3806 | 0.0153 ± 0.0028 |
| V(HC) | 0.969 | 0.3806 | 0.00145 ± 0.00012 |
| V(HC)1/3 | 0.970 | 0.3806 | 0.0890 ± 0.0072 |
| SA(HC) | 0.970 | 0.3806 | 0.00167 ± 0.00012 |
| SA(HC)1/2 | 0.971 | 0.3806 | 0.0341 ± 0.0027 |
Fit Parameter: the parameter used as the domain penetration term Pi in Equation 4.
R2: the goodness of fit obtained by global fitting of Eq. 4 to the experimental diffusion constants (Table 2) using this fit parameter.
F1 lipid: the value used for the single lipid friction in Eq. 4, determined by the friction observed for LRB-PE lipid.
c: the best fit constant in Eq. 4.
Altogether, 14 molecular quantities were tested as candidates to represent the protein penetration parameter, as defined in Figure 2 and summarized in Table 3. Of these candidates, 4/14 yielded excellent fits with an R2 of 0.97 or better, while the worst fits yielded R2 as low as 0.78. Notably, all four of the highest R2 values were produced by quantities that measured protein penetration into the hydrocarbon core (HC), either based on the volume penetrating into the hydrocarbon core [V(HC) or V1/3(HC)], or on the surface area exposed to the hydrocarbon core [SA(HC) or SA1/2(HC)]. Figure 3 presents the two very best fits for SA1/2(HC) (R2 of 0.971) and V1/3(HC) (R2 of 0.970), as well as the worst fit (R2 of 0.777) for contrast. Interestingly, the two very best fits both scale to the radius of the protein region exposed to the hydrocarbon core.
Figure 3. Global best fit of the empirical bilayer friction model (Equation 4) to the experimental diffusion constants.
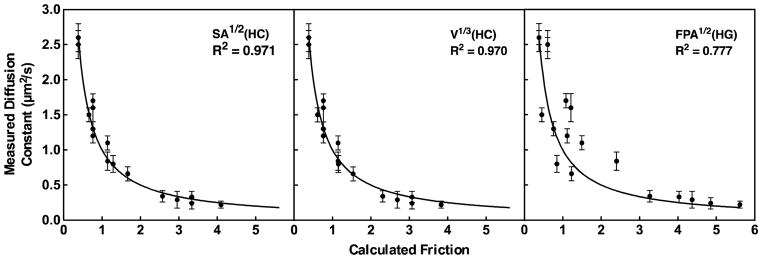
Shown are the two best fits obtained thus far by setting the protein penetration parameter in Eq. 4 to either (i) the square root of the protein surface area exposed to the bilayer hydrocarbon core, or (ii) the cube root of the protein volume exposed to the hydrocarbon core. Notably, both these approaches scale the protein penetration parameter to the effective radius of protein exposed to the bilayer. Also shown is the worst fit obtained by setting the penetration parameter to the square root of the footprint area. In each case the solid line represents perfect agreement between the measured diffusion constants (D) and calculated friction values (friction = 1/D).
The findings support a model in which the protein penetration parameter is most accurately defined by protein drag in the hydrocarbon core, with little or no contribution from protein drag in the headgroup layer. On first glance it was curious that the four top candidate parameters quantified the protein-hydrocarbon core interactions differently [V(HC), V1/3(HC), SA(HC), SA1/2(HC)] but yielded very similar fits (Table 3). Such similarity is likely an artifact of the construct library since 7 of the 8 constructs penetrating into the hydrocarbon core make their deep contacts via one (C1B) or two (C1A-C1B) C1 domains – the remaining cPLA2 C2 construct penetrates less deeply into the hydrocarbon core. Thus, 7/8 of the hydrocarbon penetrating constructs employ the same C1 motif, which means that the present analysis of the protein penetration parameter might be biased by the characteristics of this motif. Careful examination shows that the four best fits yield c x Pi terms in Equation 4 that are very similar in magnitude, explaining why their R2 values are so similar. Overall, the data provide strong evidence that interactions with the hydrocarbon core are the main component of protein frictional drag, but further studies employing a broader range of hydrocarbon-penetrating motifs are needed to unambiguously identify the hydrocarbon contact parameter that best quantifies this frictional contribution.
Discussion
The present findings show that the 2-dimensional diffusion rate of a peripheral protein on the surface of a supported lipid bilayer is defined by two distinct classes of additive frictional drags generated by (i) tightly bound lipids and (ii) protein domains that penetrate into the hydrocarbon core. When a construct possesses multiple tightly bound lipids and/or multiple hydrocarbon-penetrating domains, its total friction against the bilayer is the sum of contributions from these individual lipids and domains. Empirical Equation 4 defines these lipid and protein components of friction, and can be used to calculate the total friction and diffusion constant (D = 1 / friction) of a given domain or multi-domain construct from its known lipid and bilayer contact parameters. Table 2 summarizes these parameters for the PH, C1A, C1B, C2 and antibody proteins employed in this study. Figure 3 illustrates the striking agreement between the measured D values and the corresponding frictions calculated by Equation 4. The available data does not unambiguously identify a single protein-bilayer contact parameter best suited to describe the protein component of friction; however, the data strongly support a model in which the bilayer drag of tightly bound lipids, together with protein drag in the bilayer hydrocarbon core, combine in an additive fashion to define 2-dimensional diffusion speed.
The present analysis primarily utilizes a single motif, the C1 domain, to introduce contacts with the hydrocarbon core. Unambiguous identification of the optimal protein-bilayer contact parameter –likely either the cube root of hydrocarbon-exposed volume or the square root of hydrocarbon-exposed surface area – will require a broader library of deeply penetrating protein motifs.
It is not yet clear whether present analysis of peripheral protein diffusion on supported bilayers will also pertain to protein diffusion on free standing bilayers. Further studies are needed to resolve this issue by comparing the 2-dimensional diffusion rates of peripheral proteins in different bilayer systems including supported bilayers; sparsely and densely tethered bilayers; and free standing bilayers such as black lipid membranes and giant unilamellar vesicles (GUVs) (14,40–43). Whether or not the diffusion features observed herein are unique to supported bilayers, it is clear that supported bilayer measurements are ideally suited for both (i) comparing the 2-dimensional diffusion constants of different peripheral proteins docked to their target membranes to elucidate their specialized protein-lipid and protein-bilayer interactions, and (ii) observing changes in diffusion constants as a membrane-docked protein acquires new bound lipids and inserts additional domains into the bilayer in a stepwise fashion during, for example, its multi-step activation process. It follows that quantitative diffusion measurements on supported bilayers will provide a new window into protein-membrane interactions, and into complex signaling reactions on membrane surfaces.
Conclusions
The study measures 2-D diffusion constants on supported bilayers for 17 different protein-lipid complexes. The resulting experimental diffusion constants, together with the known membrane interaction parameters of each complex, are used to analyze the molecular features correlated with diffusional slowing and bilayer friction. The findings show that:
both individual bound lipids and individual protein domains that penetrate into the hydrocarbon core make additive contributions to the friction against the bilayer, thereby defining the 2-D diffusion constant;
an empirical formula is developed that accurately estimates the diffusion constant and bilayer friction of a peripheral protein in terms of its number of bound lipids and its geometry of penetration into the bilayer hydrocarbon core, yielding an excellent global best fit (R2 of 0.97) to the experimental diffusion constants;
unambiguous identification of the optimal protein-bilayer contact parameter – likely either the cube root of hydrocarbon-exposed volume or the square root of hydrocarbon-exposed surface area – will require a broader library of deeply penetrating protein motifs than employed herein.
Highlights.
We measure lateral diffusion constants (D) on supported bilayers for 17 protein-lipid complexes.
We examine the relationship between friction (= 1/D), lipid binding stoichiometry and protein penetration into the bilayer.
Friction arises from the additive drags of bound lipids and penetrating protein against the viscous bilayer.
The protein component is dominated by drag against the bilayer hydrocarbon core.
Acknowledgments
The authors gratefully acknowledge helpful discussions with Drs. David Nesbitt (CU Boulder) and Rich Pastor (NIH), and thank Prof. Jeff Knight (CU Denver) for the PH domain constructs.
Support provided by NIH R01 GM-063235 (to JJF)
Abbreviations
- PH domain
pleckstrin homology domain
- C1A and C1B
first conserved domains of classical protein kinase C
- C2
second conserved domain of classical protein kinase C
- GRP1
general receptor for phosphoinositides isoform 1
- PKCα
protein kinase C isoform α
- cPLA2
cytosolic phospholipase A2
- Sfp
phosphopantethienyl-transferase
- AF555
Alexa Fluor 555
- PC
phosphatidylcholine; 1,2-dioleoyl-sn-glycero-3-phosphocholine
- PS
phosphatidylserine; 1,2-dioleoyl-sn-glycero-3-phospho-L-serine
- PI(4,5)P2 or PIP2
1,2-dioleoyl-sn-glycero-3-phosphoinositol-4,5-diphosphate
- PI(3,4,5)P3 or PIP3
1,2-dioleoyl-sn-glycero-3-phosphoinositol-3,4,5-trisphosphate
- DAG
diacylglycerol; 1,2-dioleoyl-sn-glycerol
- biotinyl-PE
1,2-dioleoyl-sn-glycero-3-phosphoethanolamine-N-(biotinyl)
- LRB-PE
1,2-dioleoyl-sn-glycero-3-phosphoethanolamine-N-[lissamine rhodamine B sulfonyl]
- SUV
sonicated unilamellar vesicle
- DTT
dithiothreitol
- EDTA
ethylenediaminetetraacetic acid
- TIRFM
total internal reflection fluorescence microscopy
- GST
glutathione S-transferase
Footnotes
Publisher's Disclaimer: This is a PDF file of an unedited manuscript that has been accepted for publication. As a service to our customers we are providing this early version of the manuscript. The manuscript will undergo copyediting, typesetting, and review of the resulting proof before it is published in its final citable form. Please note that during the production process errors may be discovered which could affect the content, and all legal disclaimers that apply to the journal pertain.
References
- 1.Evans JH, Falke JJ. Ca2+ influx is an essential component of the positive-feedback loop that maintains leading-edge structure and activity in macrophages. Proc Natl Acad Sci U S A. 2007;104(41):16176–81. doi: 10.1073/pnas.0707719104. [DOI] [PMC free article] [PubMed] [Google Scholar]
- 2.von Philipsborn A, Bastmeyer M. Mechanisms of gradient detection: a comparison of axon pathfinding with eukaryotic cell migration. Int Rev Cytol. 2007;263:1–62. doi: 10.1016/S0074-7696(07)63001-0. [DOI] [PubMed] [Google Scholar]
- 3.Corbalan-Garcia S, Guerrero-Valero M, Marin-Vicente C, Gomez-Fernandez JC. The C2 domains of classical/conventional PKCs are specific PtdIns(4,5)P(2)-sensing domains. Biochem Soc Trans. 2007;35(Pt 5):1046–8. doi: 10.1042/BST0351046. [DOI] [PubMed] [Google Scholar]
- 4.Kolsch V, Charest PG, Firtel RA. The regulation of cell motility and chemotaxis by phospholipid signaling. J Cell Sci. 2008;121(Pt 5):551–9. doi: 10.1242/jcs.023333. [DOI] [PMC free article] [PubMed] [Google Scholar]
- 5.Collins SR, Meyer T. Calcium flickers lighting the way in chemotaxis? Dev Cell. 2009;16(2):160–1. doi: 10.1016/j.devcel.2009.01.018. [DOI] [PMC free article] [PubMed] [Google Scholar]
- 6.Swaney KF, Huang CH, Devreotes PN. Eukaryotic chemotaxis: a network of signaling pathways controls motility, directional sensing, and polarity. Annu Rev Biophys. 2010;39:265–89. doi: 10.1146/annurev.biophys.093008.131228. [DOI] [PMC free article] [PubMed] [Google Scholar]
- 7.Leonard TA, Hurley JH. Regulation of protein kinases by lipids. Curr Opin Struct Biol. 2011;21(6):785–91. doi: 10.1016/j.sbi.2011.07.006. [DOI] [PMC free article] [PubMed] [Google Scholar]
- 8.Zeng L, Webster SV, Newton PM. The biology of protein kinase C. Adv Exp Med Biol. 2012;740:639–61. doi: 10.1007/978-94-007-2888-2_28. [DOI] [PubMed] [Google Scholar]
- 9.Raimondi C, Falasca M. Phosphoinositides signalling in cancer: Focus on PI3K and PLC. Adv Biol Regul. 2012;52(1):166–82. doi: 10.1016/j.advenzreg.2011.09.016. [DOI] [PubMed] [Google Scholar]
- 10.Tamm LK. Lateral diffusion and fluorescence microscope studies on a monoclonal antibody specifically bound to supported phospholipid bilayers. Biochemistry. 1988;27(5):1450–7. doi: 10.1021/bi00405a009. [DOI] [PubMed] [Google Scholar]
- 11.Knight JD, Falke JJ. Single-molecule fluorescence studies of a PH domain: new insights into the membrane docking reaction. Biophys J. 2009;96(2):566–82. doi: 10.1016/j.bpj.2008.10.020. [DOI] [PMC free article] [PubMed] [Google Scholar]
- 12.Knight JD, Lerner MG, Marcano-Velazquez JG, Pastor RW, Falke JJ. Single molecule diffusion of membrane- bound proteins: window into lipid contacts and bilayer dynamics. Biophys J. 2010;99(9):2879–87. doi: 10.1016/j.bpj.2010.08.046. [DOI] [PMC free article] [PubMed] [Google Scholar]
- 13.Ziemba BP, Knight JD, Falke JJ. Assembly of membrane-bound protein complexes: detection and analysis by single molecule diffusion. Biochemistry. 2012;51(8):1638–47. doi: 10.1021/bi201743a. [DOI] [PMC free article] [PubMed] [Google Scholar]
- 14.Tamm LK, Groves JT. Supported membranes in structural biology. J Struct Biol. 2009;168(1):1–2. doi: 10.1016/j.jsb.2009.07.016. [DOI] [PMC free article] [PubMed] [Google Scholar]
- 15.Pastor RW, Mackerell AD., Jr Development of the CHARMM Force Field for Lipids. J Phys Chem Lett. 2011;2(13):1526–32. doi: 10.1021/jz200167q. [DOI] [PMC free article] [PubMed] [Google Scholar]
- 16.Camley BA, Brown FL. Contributions to membrane-embedded-protein diffusion beyond hydrodynamic theories. Phys Rev E Stat Nonlin Soft Matter Phys. 2012;85(6 Pt 1):061921. doi: 10.1103/PhysRevE.85.061921. [DOI] [PubMed] [Google Scholar]
- 17.Li Z, Venable RM, Rogers LA, Murray D, Pastor RW. Molecular dynamics simulations of PIP2 and PIP3 in lipid bilayers: determination of ring orientation, and the effects of surface roughness on a Poisson-Boltzmann description. Biophys J. 2009;97(1):155–63. doi: 10.1016/j.bpj.2009.04.037. [DOI] [PMC free article] [PubMed] [Google Scholar]
- 18.Chen HC, Ziemba BP, Landgraf KE, Corbin JA, Falke JJ. Membrane docking geometry of GRP1 PH domain bound to a target lipid bilayer: an EPR site-directed spin-labeling and relaxation study. PLoS One. 2012;7(3):e33640. doi: 10.1371/journal.pone.0033640. [DOI] [PMC free article] [PubMed] [Google Scholar]
- 19.Lai CL, Landgraf KE, Voth GA, Falke JJ. Membrane docking geometry and target lipid stoichiometry of membrane-bound PKCalpha C2 domain: a combined molecular dynamics and experimental study. J Mol Biol. 2010;402(2):301–10. doi: 10.1016/j.jmb.2010.07.037. [DOI] [PMC free article] [PubMed] [Google Scholar]
- 20.Huang H, Cafiso DS. Conformation and membrane position of the region linking the two C2 domains in synaptotagmin 1 by site-directed spin labeling. Biochemistry. 2008;47(47):12380–8. doi: 10.1021/bi801470m. [DOI] [PMC free article] [PubMed] [Google Scholar]
- 21.Landgraf KE, Malmberg NJ, Falke JJ. Effect of PIP2 binding on the membrane docking geometry of PKC alpha C2 domain: an EPR site-directed spin-labeling and relaxation study. Biochemistry. 2008;47(32):8301–16. doi: 10.1021/bi800711t. [DOI] [PMC free article] [PubMed] [Google Scholar]
- 22.Jaud S, Tobias DJ, Falke JJ, White SH. Self-induced docking site of a deeply embedded peripheral membrane protein. Biophys J. 2007;92(2):517–24. doi: 10.1529/biophysj.106.090704. [DOI] [PMC free article] [PubMed] [Google Scholar]
- 23.Malmberg NJ, Falke JJ. Use of EPR power saturation to analyze the membrane-docking geometries of peripheral proteins: applications to C2 domains. Annu Rev Biophys Biomol Struct. 2005;34:71–90. doi: 10.1146/annurev.biophys.34.040204.144534. [DOI] [PMC free article] [PubMed] [Google Scholar]
- 24.Rufener E, Frazier AA, Wieser CM, Hinderliter A, Cafiso DS. Membrane-bound orientation and position of the synaptotagmin C2B domain determined by site-directed spin labeling. Biochemistry. 2005;44(1):18–28. doi: 10.1021/bi048370d. [DOI] [PubMed] [Google Scholar]
- 25.Frazier AA, Roller CR, Havelka JJ, Hinderliter A, Cafiso DS. Membrane-bound orientation and position of the synaptotagmin I C2A domain by site-directed spin labeling. Biochemistry. 2003;42(1):96–105. doi: 10.1021/bi0268145. [DOI] [PubMed] [Google Scholar]
- 26.Zhang G, Kazanietz MG, Blumberg PM, Hurley JH. Crystal structure of the cys2 activator-binding domain of protein kinase C delta in complex with phorbol ester. Cell. 1995;81(6):917–24. doi: 10.1016/0092-8674(95)90011-x. [DOI] [PubMed] [Google Scholar]
- 27.Yin J, Lin AJ, Golan DE, Walsh CT. Site-specific protein labeling by Sfp phosphopantetheinyl transferase. Nat Protoc. 2006;1(1):280–5. doi: 10.1038/nprot.2006.43. [DOI] [PubMed] [Google Scholar]
- 28.Corbin JA, Dirkx RA, Falke JJ. GRP1 pleckstrin homology domain: activation parameters and novel search mechanism for rare target lipid. Biochemistry. 2004;43(51):16161–73. doi: 10.1021/bi049017a. [DOI] [PMC free article] [PubMed] [Google Scholar]
- 29.Corbin JA, Evans JH, Landgraf KE, Falke JJ. Mechanism of specific membrane targeting by C2 domains: localized pools of target lipids enhance Ca2+ affinity. Biochemistry. 2007;46(14):4322–36. doi: 10.1021/bi062140c. [DOI] [PMC free article] [PubMed] [Google Scholar]
- 30.Nair PM, Salaita K, Petit RS, Groves JT. Using patterned supported lipid membranes to investigate the role of receptor organization in intercellular signaling. Nat Protoc. 2011;6(4):523–39. doi: 10.1038/nprot.2011.302. [DOI] [PMC free article] [PubMed] [Google Scholar]
- 31.Sbalzarini IF, Koumoutsakos P. Feature point tracking and trajectory analysis for video imaging in cell biology. J Struct Biol. 2005;151(2):182–95. doi: 10.1016/j.jsb.2005.06.002. [DOI] [PubMed] [Google Scholar]
- 32.Nagle JF, Tristram-Nagle S. Structure of lipid bilayers. Biochim Biophys Acta. 2000;1469(3):159–95. doi: 10.1016/s0304-4157(00)00016-2. [DOI] [PMC free article] [PubMed] [Google Scholar]
- 33.Xu RX, Pawelczyk T, Xia TH, Brown SC. NMR structure of a protein kinase C-gamma phorbol-binding domain and study of protein-lipid micelle interactions. Biochemistry. 1997;36(35):10709–17. doi: 10.1021/bi970833a. [DOI] [PubMed] [Google Scholar]
- 34.Malmberg NJ, Van Buskirk DR, Falke JJ. Membrane-docking loops of the cPLA2 C2 domain: detailed structural analysis of the protein-membrane interface via site-directed spin-labeling. Biochemistry. 2003;42(45):13227–40. doi: 10.1021/bi035119+. [DOI] [PMC free article] [PubMed] [Google Scholar]
- 35.Rauch ME, Ferguson CG, Prestwich GD, Cafiso DS. Myristoylated alanine-rich C kinase substrate (MARCKS) sequesters spin-labeled phosphatidylinositol 4,5-bisphosphate in lipid bilayers. J Biol Chem. 2002;277(16):14068–76. doi: 10.1074/jbc.M109572200. [DOI] [PubMed] [Google Scholar]
- 36.Wertz SL, Savino Y, Cafiso DS. Solution and membrane bound structure of a peptide derived from the protein kinase C substrate domain of neuromodulin. Biochemistry. 1996;35(34):11104–12. doi: 10.1021/bi961248x. [DOI] [PubMed] [Google Scholar]
- 37.Gambhir A, Hangyas-Mihalyne G, Zaitseva I, Cafiso DS, Wang J, Murray D, et al. Electrostatic sequestration of PIP2 on phospholipid membranes by basic/aromatic regions of proteins. Biophys J. 2004;86(4):2188–207. doi: 10.1016/S0006-3495(04)74278-2. [DOI] [PMC free article] [PubMed] [Google Scholar]
- 38.Wang J, Gambhir A, McLaughlin S, Murray D. A computational model for the electrostatic sequestration of PI(4,5)P2 by membrane-adsorbed basic peptides. Biophys J. 2004;86(4):1969–86. doi: 10.1016/S0006-3495(04)74260-5. [DOI] [PMC free article] [PubMed] [Google Scholar]
- 39.Voss NR, Gerstein M. 3V: cavity, channel and cleft volume calculator and extractor. Nucleic Acids Res. 2010;38(Web Server issue):W555–62. doi: 10.1093/nar/gkq395. [DOI] [PMC free article] [PubMed] [Google Scholar]
- 40.Kiessling V, Wan C, Tamm LK. Domain coupling in asymmetric lipid bilayers. Biochim Biophys Acta. 2009;1788(1):64–71. doi: 10.1016/j.bbamem.2008.09.003. [DOI] [PMC free article] [PubMed] [Google Scholar]
- 41.Shenoy S, Moldovan R, Fitzpatrick J, Vanderah DJ, Deserno M, Losche M. In-plane homogeneity and lipid dynamics in tethered bilayer lipid membranes (tBLMs) Soft Matter. 2010;2010(6):1263–74. doi: 10.1039/B919988H. [DOI] [PMC free article] [PubMed] [Google Scholar]
- 42.Weiss K, Enderlein J. Lipid diffusion within black lipid membranes measured with dual-focus fluorescence correlation spectroscopy. Chemphyschem. 2012;13(4):990–1000. doi: 10.1002/cphc.201100680. [DOI] [PubMed] [Google Scholar]
- 43.Golebiewska U, Nyako M, Woturski W, Zaitseva I, McLaughlin S. Diffusion coefficient of fluorescent phosphatidylinositol 4,5-bisphosphate in the plasma membrane of cells. Mol Biol Cell. 2008;19(4):1663–9. doi: 10.1091/mbc.E07-12-1208. [DOI] [PMC free article] [PubMed] [Google Scholar]
- 44.Lietzke SE, Bose S, Cronin T, Klarlund J, Chawla A, Czech MP, et al. Structural basis of 3-phosphoinositide recognition by pleckstrin homology domains. Mol Cell. 2000;6(2):385–94. doi: 10.1016/s1097-2765(00)00038-1. [DOI] [PubMed] [Google Scholar]
- 45.Corbalan-Garcia S, Garcia-Garcia J, Rodriguez-Alfaro JA, Gomez-Fernandez JC. A new phosphatidylinositol 4,5-bisphosphate-binding site located in the C2 domain of protein kinase Calpha. J Biol Chem. 2003;278(7):4972–80. doi: 10.1074/jbc.M209385200. [DOI] [PubMed] [Google Scholar]
- 46.Verdaguer N, Corbalan-Garcia S, Ochoa WF, Fita I, Gomez-Fernandez JC. Ca(2+) bridges the C2 membrane- binding domain of protein kinase Calpha directly to phosphatidylserine. EMBO J. 1999;18(22):6329–38. doi: 10.1093/emboj/18.22.6329. [DOI] [PMC free article] [PubMed] [Google Scholar]
- 47.Manna D, Bhardwaj N, Vora MS, Stahelin RV, Lu H, Cho W. Differential roles of phosphatidylserine, PtdIns(4,5)P2, and PtdIns(3,4,5)P3 in plasma membrane targeting of C2 domains. Molecular dynamics simulation, membrane binding, and cell translocation studies of the PKCalpha C2 domain. J Biol Chem. 2008;283(38):26047–58. doi: 10.1074/jbc.M802617200. [DOI] [PMC free article] [PubMed] [Google Scholar]
- 48.Slater SJ, Ho C, Kelly MB, Larkin JD, Taddeo FJ, Yeager MD, et al. Protein kinase Calpha contains two activator binding sites that bind phorbol esters and diacylglycerols with opposite affinities. J Biol Chem. 1996;271(9):4627–31. doi: 10.1074/jbc.271.9.4627. [DOI] [PubMed] [Google Scholar]
- 49.Cho W. Membrane targeting by C1 and C2 domains. J Biol Chem. 2001;276(35):32407–10. doi: 10.1074/jbc.R100007200. [DOI] [PubMed] [Google Scholar]
- 50.Ananthanarayanan B, Stahelin RV, Digman MA, Cho W. Activation mechanisms of conventional protein kinase C isoforms are determined by the ligand affinity and conformational flexibility of their C1 domains. J Biol Chem. 2003;278(47):46886–94. doi: 10.1074/jbc.M307853200. [DOI] [PubMed] [Google Scholar]