

Abstract
Prior research has demonstrated links among vascular health and the occurrence of stroke, mild cognitive decline, and dementia in older adults. However, little is known about whether normal variation in vascular indicators may be related to changes in neural tissue integrity. Even less is known about how the brain is affected by cholesterol levels in the normal to moderate risk range, leading up to overt disease pathology. This study examined associations between serum lipid levels and DTI indicators of white matter (WM) structural integrity in a sample of 125 generally healthy older adults aged 43–87 years. Whole‐brain voxelwise analysis, controlling for age and gender, revealed low density lipoprotein levels (LDL) as the most robust correlate of regional WM structural integrity of the measured lipids. Higher LDL was associated with decreased WM integrity in right frontal and temporal regions, the superior longitudinal fasciculus and internal/external capsules. Increasing LDL was associated with increased radial and axial diffusivity; however, more widespread statistical effects were found for radial diffusivity. These findings suggest that normal interindividual variation in lipid levels is associated with compromised regional WM integrity, even in individuals below clinical thresholds for hyperlipidemia. Given the prevalence of cholesterol‐associated sequelae in older adults, and mounting evidence suggesting a vascular role in the etiology of dementia, the current data suggest that understanding the relationship between cholesterol and brain tissue microstructure may have important clinical implications for early detection of vascular‐related cognitive disorders and optimal regulation of serum lipids to maintain neural health in older adults. Hum Brain Mapp, 2013. © 2012 Wiley Periodicals, Inc.
Keywords: DTI, serum cholesterol, aging, cerebrovascular, white matter, fractional anisotropy, diffusivity
INTRODUCTION
Elevated serum cholesterol is a well‐established risk factor for the development of cerebrovascular disease, and hypercholesteremia comprises one of the most common health concerns in our society affecting nearly 101 million Americans (Center for Disease Control). Understanding how variation in systemic lipids impacts the brain and ultimately quality of life in the elderly is therefore of high priority. It is estimated that 45% of the adult population has total cholesterol levels exceeding 200 mg/dL, and that one third of the population maintains low‐density lipoproteins (LDL) above 130 mg/dL, demonstrating the high prevalence of individuals with increased risk for developing vascular related pathologies [Lloyd‐Jones et al., 2009]. Although much research has aimed to understand how lipids contribute to the more major vascular pathologies, much less is known about how these lipids may contribute to neural health in the absence of high risk and overt damage.
Elevated cholesterol and conditions such as hypercholesteremia not only heightens the risk for stroke and cerebrovascular disease, but it is also associated with increased incidence of cognitive decline [Breteler et al., 1994a; Solomon et al., 2009a; van Vliet et al., 2009], dementia [Dufouil et al., 2005; Stewart et al., 2007], and Alzheimer's disease (AD) [Anstey et al., 2008; Kivipelto et al., 2002; Solomon et al., 2009b]. In a recent epidemiological study, participants with moderately elevated total cholesterol (greater than 220 mg/dL) were shown to have a significantly increased risk of developing AD three decades later [Solomon et al., 2009b], suggesting that even mild to moderately high serum cholesterol may be predisposing individuals to disease pathology and that these effects may begin substantially earlier than the manifestation of clinical symptoms. It is therefore critical that a better understanding be gained of how even normal interindividual variation in lipid levels may affect brain tissue. It is possible that in addition to vascular effects, cholesterol may influence neural health via alternate mechanisms. For example, animal studies have supported this relationship between dietary cholesterol and neurodegenerative disease by linking consumption of a cholesterol rich diet to accumulation of beta‐amyloid in the hippocampus and adjacent cortex, a pathological characteristic of AD [Sparks et al., 1994]. In humans, positron emission tomography findings of decreased glucose metabolism (indicating a reduction in neuronal activity) also correlate strongly with increasing levels of serum cholesterol in brain regions preferentially susceptible to AD pathology such as frontal and temporal areas [Reiman et al., 2010].
There is mounting evidence implicating poor cerebrovascular health as a contributor to brain aging, and as risk factor for the development of dementias, including Alzheimer's disease. For example, recent studies have demonstrated associations between brain tissue integrity and parameters associated with vascular health, such as blood pressure [Kennedy and Raz, 2009; Leritz et al., 2010, 2011]. Understanding how cholesterol, another parameter known to influence vascular and neural health, impacts brain structure is also of primary interest. An early study that looked specifically at serum cholesterol utilized xenon‐enhanced computed tomography to demonstrate a longitudinal association between elevated levels of serum cholesterol and increasing volume of leuko‐araiosis (white matter with altered signal intensity on magnetic resonance imaging) in cognitively healthy older adults [Meyer et al., 1999]. Most recently, diffusion tensor imaging (DTI) has become a valuable in vivo neuroimaging technique for examining subtle alterations in white matter tissue structure due to a range of developmental and degenerative conditions. Recent work utilizing DTI has demonstrated that interindividual variation in blood pressure is associated with white matter tissue structure, even in individuals within the low risk range [Kennedy and Raz, 2009; Lee et al., 2009; Leritz et al., 2011, 2010; Segura et al., 2009]. However, no known studies have specifically examined how serum cholesterol may influence white matter, particularly in populations below the threshold of significant clinical risk.
Although concrete links between vascular health and dementia have been uncovered in epidemiological work, much less is known about the direct influence of risk parameters on brain tissue structure. The current study aimed to examine the association between interindividual variation in serum lipids and WM tissue structure as indexed by DTI, in a sample of neurologically healthy older adults. We examined the influence of total cholesterol (TOT), low‐density lipoproteins (LDL), high‐density lipoproteins (HDL), and triglycerides (TRIGLY) on brain structure with the prediction that there would be regional associations between cholesterol levels and tissue integrity in frontal brain regions most affected by aging [Gunning‐Dixon et al., 2009; Salat et al., 2005] or alternatively, in regions affected by AD such as temporal and parietal areas [Qiu et al., 2010; Salat et al., 2010]. These predictions were based on prior literature suggesting that vascular risk factors primarily impact anterior brain regions [Kennedy and Raz, 2009; Leritz et al., 2010; Raz et al., 2003; Salat et al., 2012], and on literature suggesting that high cholesterol may be associated with the development of AD [Anstey et al., 2008; Kivipelto et al., 2002; Solomon et al., 2009b].
METHODS
Participants
The study sample consisted of 125 generally healthy middle to older aged adults (49M/76F; age 43–87). Participants were recruited through two coinciding studies investigating the impact of common cerebrovascular risk factors on brain structure and cognition. Thirty‐nine participants were obtained through a newsletter for the Harvard Cooperative Program on Aging (HCPA) Claude Pepper Older American Independence Center (OAIC) inviting participation from healthy, community‐dwelling older African Americans. The remaining 86 participants were recruited through the Understanding Cerebrovascular and Alzheimer's Risk in the Elderly (UCARE) program, an endeavor examining the relationship between cerebrovascular risk, brain structure, cognition, and risk of dementia. These subjects were recruited through the Boston University Alzheimer's Disease Center (BUADC), dependent upon meeting the criteria of having at least one first‐degree familial relative with a diagnosis of dementia. Exclusion criteria consisted of: a history of head trauma of “mild” severity or greater (e.g., loss of consciousness for greater than 10 minutes) according to the criteria of Fortuny and colleagues [Fortuny et al., 1980], diagnosis of any form of dementia (i.e., Parkinson's disease, Alzheimer's disease, vascular dementia), any severe psychiatric illness, or any history of brain surgery. All participants were literate with at least a 6th grade education. One hundred‐four participants claimed dominant right‐handedness. They reported no impairments in cognitive or memory skills, and had Mini‐Mental Status Examination (MMSE) [Folstein et al., 1975] scores in the range of 23 to 30. Although three subjects were below the standard MMSE cutoff of 24, these scores are in a range outside of a dementia diagnosis, according to normative data based on the racial distribution of our sample [Bohnstedt et al., 1994]. Demographic characteristics of all participants are presented in Table I.
Table I.
Demographic and physiological data (n = 125)
| Mean | Standard deviation | |
|---|---|---|
| Age | 68.04 | 9.41 |
| Education (years) | 14.81 | 2.67 |
| MMSE | 27.81 | 1.81 |
| Physiological | ||
| LDL Cholesterol (mg/dL) | 119.05 | 32.84 |
| HDL Cholesterol (mg/dL) | 61.13 | 16.27 |
| Total Cholesterol (mg/dL) | 200.49 | 39.04 |
| Triglycerides | 101.54 | 44.87 |
LDL, low‐density lipoprotein; HDL, high‐density lipoprotein; MMSE, mini mental status examination.
DATA ACQUISITION
T1‐Weighted Imaging Acquisition
Two whole‐brain high‐resolution T1‐weighted scans were collected and averaged for each participant. Ten participants were scanned using a Siemens 1.5 Tesla Sonata system, with the following T1 parameters: MPRAGE; T1 = 1000 ms, TR = 2.73 sec, TE = 3.39 ms, flip angle = 7°, slice thickness = 1.33 mm, 128 slices, field of view (FOV) = 256 × 256 mm. The remaining 115 participants were scanned on the upgraded Siemens 1.5 Avanto System, with slightly different parameters; MPRAGE: T1= 1000 ms, TR = 2.73 sec, TE = 3.31 ms, flip angle = 7°, slice thickness = 1.3 mm, 128 slices, FOV = 256 × 256 mm. These T1‐weighted scan protocols have been empirically optimized for high contrast between gray and white matter, as well as gray matter and cerebrospinal fluid (CSF) to allow for optimal structural and surface segmentation for structural analyses.
DTI Acquisition
Global and regional WM integrity was assessed using DTI measures of FA and diffusivity (comprised of axial [λ1], and radial components [(λ2 + λ3)/2] [Budde et al., 2007; Song et al., 2002, 2003]. Image acquisition employed single shot echo planar imaging with a twice‐refocused spin echo pulse sequence, optimized to minimize eddy current‐induced image distortions [Reese et al., 2003]. Ten participants were scanned using a Siemens 1.5 Tesla Sonata system, with the following DTI parameters: repetition time (TR) = 9000 ms, echo time (TE) = 68 ms, 60 slices total, acquisition matrix = 128 × 128 (FOV = 256 × 256 mm), slice thickness = 2 mm (for 2 mm3 isotropic voxels) with 0 mm gap, with a b value = 700 s/mm2, 10 T2 and 60 diffusion weighted images, and one image, the T2‐weighted “low b” image with a b‐value = 0 s/mm2 as an anatomical reference volume. The remaining 115 participants were scanned on the upgraded Siemens 1.5 Avanto System, with slightly different DTI parameters: repetition time (TR) 7200 ms, echo time (TE) = 77 ms, 60 slices total, acquisition matrix = 128 × 128 (FOV = 256 × 256 mm), slice thickness = 2 mm (for 2 mm3 isotropic voxels) with 0 mm gap, with a b value = 700 s/mm2, 10 T2 and 60 diffusion weighted images, and one image, the T2‐weighted “low b” image with a b‐value = 0 s/mm2 as an anatomical reference volume. We confirmed that these 10 participants imaged using slightly different scan parameters did not affect the data or interpretation of the results in any obvious way through post hoc statistical procedures, as well as visual inspection using scatterplots. The diffusion weighted directions were obtained using the electrostatic shell method [Jones et al., 1999], providing a high signal‐to‐noise diffusion volume. The diffusion tensor was calculated on a voxel‐by‐voxel basis with conventional reconstruction methods [Basser et al., 1994] using tools developed at the Martinos Center at MGH.
Assessment of Serum Lipid Levels
Fasting blood was drawn and processed for analysis of several serum lipid levels including total cholesterol (TOT), low‐density lipoprotein (LDL), high‐density lipoprotein (HDL), and triglycerides (TRIGLY).
Total Cholesterol
Current clinical convention considers total cholesterol of less than 200 mg/dL to be “normal,” while 200–239 mg/dL is “mild,” and a total cholesterol value of 240 or greater to be “severe” (American Heart Association). In our sample, total cholesterol levels ranged from 103 to 310 mg/dL. By these standards, 63 (50%) individuals would be considered to have normal total cholesterol, 43 (35%) would be considered to have mildly high cholesterol, and 19 (15%) individuals would be considered to have total cholesterol levels in the severe range.
LDL Cholesterol
Current clinical standards break down LDL cholesterol values into the following categories: LDL values less than 100 are optimal, 101–129 near optimal, 130–159 mildly high, and greater than 160 are severe (American Heart Association). Within our sample, 82 individuals (66%) are considered to have healthy LDL cholesterol and fall into the optimal/near optimal category, 27 (22%) maintain mildly high LDL levels, and 16 (12%) are considered severe (see Fig. 1b). Therefore, 109 participants, 88% of our sample, would be considered within the normal to mild range for LDL cholesterol levels. Statistics regarding lipid lowering agent medication is described in Table II and Figure 1a,b.
Figure 1.
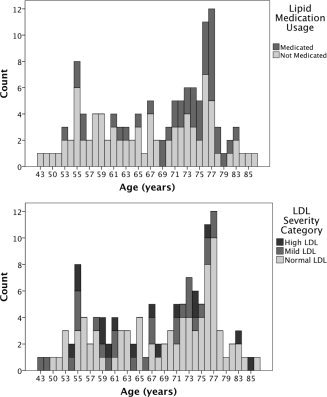
(a) Distribution of age grouped by lipid lowering medication status. (b) Distribution of age grouped by low density lipoprotein (LDL) severity classification.
Table II.
Demographic and cholesterol measure by lipid medication group
| Medicated N=41 mean (SD) | Not medicated N = 83 mean (SD) | |
|---|---|---|
| Age | 71.29 (7.83) | 66.37 (9.78) |
| MMSE score | 27.72 (1.73) | 27.87 (1.87) |
| LDL cholesterol (mg/dL) | 106.32 (30.24) | 124.94 (32.49) |
| HDL cholesterol (mg/dL) | 55.73 (14.74) | 64.10 (16.22) |
| Total cholesterol (mg/dL) | 184.07 (39.17) | 208.54 (36.82) |
| Triglycerides | 110.07 (48.44) | 97.52 (42.95) |
One participant's medication status is not known.
Mean Arterial Blood Pressure (MABP)
Our recent work found strong associations between blood pressure and tissue microstructure [Salat et al., 2012]. We therefore examined whether blood pressure contributed to associations between DTI measures and lipids. Blood pressure was also recorded for each participant. Systolic and diastolic blood pressure (BP) was recorded in a seated position after 5 minutes of rest, with the arm at rest at the level of the heart using a standard sphygmomanometer. A second measurement was obtained 5 minutes later, and an average systolic and average diastolic pressure were computed across the two measurements. Blood pressure was always measured by the study physician (JLR). Systolic and diastolic blood pressure were then considered together to create a mean arterial blood pressure (MABP) using the following formula: MABP: 1/3 (Systolic – diastolic) + diastolic. MABP is a metric commonly used in clinical settings to obtain an accurate metric of overall blood pressure, due to the fact that it contains both systolic and diastolic measurements in its formula. MABP is believed to indicate perfusion pressure, particularly in body organs. Thus, it is an appropriate metric to use when examining associations between risk factors and brain structure.
DATA ANALYSIS
T1‐Weighted Imaging Analysis
T1‐weighted images were processed using the FreeSurfer image analysis suite, which is documented and fully available for download online (http://surfer.nmr.mgh.harvard.edu/) for the labeling of white matter regions of interest used in subsequent analyses. The technical details of these procedures are described in prior publications [Dale et al., 1999; Fischl and Dale, 2000; Fischl et al., 1999a, b, 2001, 2002, 2004a, b; Han et al., 2006; Jovicich et al., 2006; Segonne et al., 2004]. Briefly, this processing includes motion correction and averaging of multiple volumetric T1 weighted images, removal of nonbrain tissue using a hybrid watershed/surface deformation procedure [Segonne et al., 2004], automated Talairach transformation, segmentation of the subcortical white matter and deep gray matter volumetric structures (including hippocampus, amygdala, caudate, putamen, ventricles) [Fischl et al., 2002, 2004a] intensity normalization [Sled et al., 1998], tessellation of the gray matter white matter boundary, automated topology correction [Fischl et al., 2001; Segonne et al., 2007], and surface deformation following intensity gradients to optimally place the gray/white and gray/cerebrospinal fluid borders at the location where the greatest shift in intensity defines the transition to the other tissue class [Dale et al., 1999; Fischl and Dale, 2000].
DTI Preprocessing and Analysis: Motion and Eddy Current Correction
For data processing, we used diffusion tools developed at the Martinos Center as well as tools available as part of the FreeSurfer (http://surfer.nmr.mgh.harvard.edu) and FSL (http://www.fmrib.ox.ac.uk.ezp-prod1.hul.harvard.edu/fsl) processing streams. Diffusion volumes were eddy current and motion corrected using FSLs Eddy Correct tool. The diffusion tensor was calculated for each voxel using a least‐squares fit to the diffusion signal. The T2 weighted low b volume was then skull stripped using FSLs Brain Extraction Tool (BET) [Smith, 2002], which served as a brain‐mask for all other diffusion maps. The low b structural volume was collected using identical sequence parameters as the directional volumes with no diffusion weighting, and was thus in register with the final diffusion maps. Maps for fractional anisotropy (FA), axial diffusivity [λ1] (DA) and radial diffusivity [(λ2 + λ3)/2] (DR), were then isolated to prepare for TBSS processing and analysis [Budde et al., 2007; Song et al., 2002, 2003].
Nonlinear Registration and Tract‐Based Spatial Statistics (TBSS) [Rueckert et al., 1999; Smith et al., 2004, 2006]
Voxelwise processing of the FA data was carried out using TBSS (Tract Based Spatial Statistics) [Smith et al., 2006], part of FSL [Smith et al., 2004]. All participants' diffusion data were initially aligned into a common space using the nonlinear registration tool FNIRT [Andersson et al., 2007], which uses a b‐spline representation of the registration warp field [Rueckert et al., 1999], resulting in all images transformed into 1mm isotropic, MNI152 standard space. Next, the mean FA image was created by averaging all participants' aligned FA volumes, and thinned to generate a mean FA skeleton, which represents the centers of all tracts common to the group. The mean skeleton image was masked to only display voxels with FA values greater than 0.2 to minimize the influence of partial voxel contamination. Each subject's aligned, common space FA data was then projected onto this skeleton to create a 4D skeletonized volume (3D skeletal volume by number of subjects), which was then utilized in voxelwise group statistics. Data along the skeleton were smoothed with an anatomical constraint to limit the smoothing to neighboring data within adjacent voxels along the skeleton. The exact transformations derived for the FA maps were applied to the other diffusivity volumes for matched processing of image volumes per subject.
Statistical Analysis
The association between each diffusion measure (FA, DA, and DR) and serum lipids (HDL, LDL, TOT, TRIGLY), regressing the effects of age and gender, were examined using randomize, a voxelwise cross‐subject statistical tool available in FSLs TBSS analysis pipeline. Correction for multiple comparisons was performed using a threshold free cluster enhancement (TFCE), permutation‐based method with 5000 iterations. Statistical maps were thresholded at P < 0.05 and dilated from the TBSS skeleton for visualization purposes. Resulting clusters that survived multiple comparison correction procedures for linear regression models were labeled using standard anatomical WM labels and atlases available through FSL (ICBM‐DTI‐81 white‐matter labels atlas [Mori et al., 2005]) and as output from the FreeSurfer processing stream [Salat et al., 2009], and are presented in Table III. The resulting significant clusters from the skeleton‐restricted, voxelwise analysis examining the relationship between FA and LDL, were deprojected into each participant's native diffusion space using the inverse transform created in TBSS to register that participant to the average. Once in native DTI space, transformed anatomical clusters were used as a mask to extract mean fractional anisotropy and diffusivity values for each ROI for further statistical analysis using SPSS software.
Table III.
Results of multiple regressions to assess potential predictive contributions of mean arterial blood pressure (MABP) and lipid lowering medication status on mean fractional anisotropy (FA) within regions significantly showing associations between FA and low density lipoprotein (LDL) levels, covarying for age and gender
| Cluster | Hemi | Sign | Anatomical label containing the cluster | Cluster size (mm3) | Orig model | Add MABP | Add Lipid Meds | LDL x Med Interaction | |||||
|---|---|---|---|---|---|---|---|---|---|---|---|---|---|
| R 2 | R 2 Change | F Change | Sig. F Change | R 2 Change | F Change | Sig. F Change | F | Sig. F | |||||
| 1 | RH | − | Superior Longitudinal Fasciculus | 1,867 | 0.139 | 0.064 | 9.663 | 0.002a | 0.001 | 0.115 | 0.735 | 1.070 | 0.303 |
| 2 | RH | − | Post. Internal Capsule, Sup. Corona Radiata, Inf. Temporal WM | 2,421 | 0.090 | 0.001 | 0.082 | 0.775 | 0.010 | 1.384 | 0.242 | 0.013 | 0.910 |
| 3 | RH | − | Precentral/Caudal Middle Frontal WM | 677 | 0.130 | 0.007 | 0.918 | 0.340 | 0.002 | 0.211 | 0.647 | 1.453 | 0.230 |
| 4 | RH | − | Precentral WM | 19 | 0.048 | 0.014 | 1.776 | 0.185 | 0.002 | 0.206 | 0.651 | 0.017 | 0.898 |
| 5 | RH | − | Caudal Middle Frontal WM | 11 | 0.041 | 0.011 | 1.357 | 0.246 | 0.003 | 0.349 | 0.556 | 2.156 | 0.145 |
| 6 | RH | − | Parsopercularis WM | 21 | 0.056 | 0.016 | 2.090 | 0.151 | 0.000 | 0.003 | 0.954 | 0.630 | 0.429 |
| 7 | RH | − | Precentral WM | 10 | 0.024 | 0.052 | 6.779 | 0.010b | 0.003 | 0.422 | 0.517 | 2.077 | 0.152 |
| 8 | RH | − | External Capsule | 208 | 0.064 | 0.000 | 0.009 | 0.926 | 0.007 | 0.874 | 0.352 | 3.051 | 0.083 |
| 9 | RH | − | Caudal Middle Frontal WM | 17 | 0.040 | 0.005 | 0.641 | 0.425 | 0.000 | 0.017 | 0.896 | 0.264 | 0.608 |
| 10 | RH | − | Caudal Middle Frontal WM | 22 | 0.072 | 0.036 | 4.834 | 0.030b | 0.000 | 0.043 | 0.836 | 2.557 | 0.112 |
| 11 | RH | − | External Capsule | 16 | 0.020 | 0.001 | 0.062 | 0.804 | 0.001 | 0.167 | 0.683 | 1.514 | 0.221 |
| 12 | RH | − | Thalamus/ Ventral Diencephalon (DC) | 40 | 0.058 | 0.003 | 0.432 | 0.512 | 0.001 | 0.067 | 0.796 | 0.000 | 0.999 |
| 13 | RH | − | Ventral Diencephalon (DC) | 16 | 0.031 | 0.001 | 0.170 | 0.681 | 0.005 | 0.631 | 0.428 | 0.003 | 0.953 |
| 14 | RH | − | Middle and Superior Temporal WM | 502 | 0.095 | 0.010 | 1.365 | 0.245 | 0.001 | 0.174 | 0.678 | 1.560 | 0.214 |
| 15 | RH | − | Middle Temporal WM | 22 | 0.047 | 0.008 | 1.015 | 0.316 | 0.001 | 0.108 | 0.743 | 0.731 | 0.394 |
| 16 | RH | − | Entorhinal WM | 44 | 0.036 | 0.008 | 0.998 | 0.320 | 0.003 | 0.316 | 0.575 | 0.091 | 0.763 |
| 17 | RH | − | Posterior Thalamic Radiation | 161 | 0.105 | 0.013 | 1.716 | 0.193 | 0.001 | 0.195 | 0.659 | 0.778 | 0.379 |
| 18 | RH | − | Lateral Occipital WM | 27 | 0.075 | 0.027 | 3.649 | 0.059 | 0.000 | 0.000 | 0.982 | 1.464 | 0.229 |
| 19 | LH | + | External Capsule/Putamen | 658 | 0.113 | 0.016 | 2.162 | 0.144 | 0.000 | 0.013 | 0.909 | 0.540 | 0.464 |
| 20 | LH | + | Medial Orbitofrontal WM | 169 | 0.021 | 0.018 | 2.299 | 0.132 | 0.002 | 0.214 | 0.644 | 0.523 | 0.471 |
| 21 | RH/LH | + | Body of Corups Collosum | 684 | 0.093 | 0.029 | 3.916 | 0.050 | 0.004 | 0.538 | 0.465 | 3.595 | 0.060 |
| 22 | LH | + | Accumbens Area | 18 | 0.077 | 0.007 | 0.976 | 0.325 | 0.006 | 0.843 | 0.361 | 2.095 | 0.150 |
| 23 | LH | + | Fusiform WM | 91 | 0.102 | 0.013 | 1.800 | 0.182 | 0.010 | 1.302 | 0.256 | 0.763 | 0.384 |
| 24 | RH | + | Precuneus WM | 61 | 0.113 | 0.055 | 7.988 | 0.006a | 0.001 | 0.078 | 0.780 | 0.515 | 0.474 |
| 25 | RH | + | Posterior Thalamic Radiation | 62 | 0.044 | 0.008 | 1.031 | 0.312 | 0.005 | 0.574 | 0.450 | 0.089 | 0.766 |
P<0.01
P<0.05
Dependent Variable: mean FA for each cluster.
Orig Model: Predictors = LDL, age, gender.
Add MABP: Predictors = LDL, age, gender, MABP.
Add Lipid Meds: Predictors = ldlchol, age, gender, lipid_medication_status.
LDLxMed Interaction: Predictors = LDL, lipid_medication_status, LDL*lipid_medication_status (statistics reported are from the interaction term).
RESULTS
Demographic and serum cholesterol data for all participants are presented in Table I. Participants ranged in age from 43‐87, with 19 participants (15%) meeting total cholesterol criteria for hyperlipidemia, 16 participants (12%) meeting criteria for severe LDL cholesterol, and 41 individuals (32%) currently taking lipid‐lowering medication (such as statins) for high cholesterol (See Fig. 1). All cholesterol variables were normally distributed with no significant outlying values.
Associations Between Serum Lipids, Age and Gender
Relationships between age and serum lipids were examined using bivariate correlations. Age was correlated with LDL (r(123) = 0.18, P < 0.05) and TOT cholesterol (r(123) = 0.20, P < 0.05), such that lower cholesterol levels were associated with increasing age. In contrast, HDL and triglycerides were not associated with age. Cholesterol levels were significantly greater in women compared to men (LDL, t(124) = 3.20, P < 0.01; HDL, t(124) = 3.86, P < 0.01; TOT, t(124) = 4.72, P < 0.01). Triglyceride levels did not differ in men and women. Because of the significant findings regarding gender and age, all voxelwise analyses were conducted using these variables as covariates.
Voxel‐Wise TBSS Analyses
Corrected results from voxel‐wise linear regression along the WM skeleton examining the association between FA and each lipid measure controlling for age and gender, are shown as significance maps (thresholded at P < 0.05) visualized as an overlay on the standard MNI‐152 (T1, 1mm) template brain in Figure 2.
Figure 2.
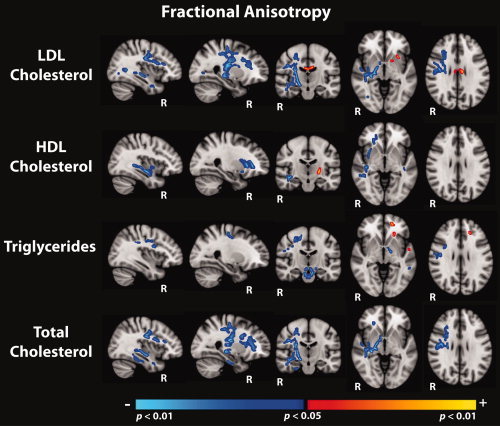
Regions showing significant associations (corrected for multiple comparisons, thresholded at P < 0.05), between fractional anisotropy and each of the serum lipid measures, covarying for the effects of age and gender. Statistical maps are shown as an overlay on the standard MNI‐152 template.
Of the four lipid measures, LDL showed the greatest number of significant voxels above threshold when used as a predictor of white matter structural integrity indexed by FA. Nearly all resulting clusters lateralized to the right hemisphere and were in the negative direction such that increasing LDL predicted lower FA values. The most robust associations occurred in frontal and temporal regions including portions of the anterior/superior corona radiata, the superior longitudinal fasciculus, and subcortical white matter subjacent to rostral/caudal middle frontal, precentral, middle/superior temporal, and fusiform regions. Deeper subcortical pathways in the right hemisphere also evidenced significant associations including sections of the cerebral peduncle, fornix, external capsule, anterior/posterior limbs of the internal capsule, fornix, ventral diencephalon, and the posterior thalamic radiation. Few positive associations were evidenced, and these were isolated to the left hemisphere within the body of the corpus collosum, anterior limb of the internal capsule, external capsule and white matter subjacent to lateral/medial orbitofrontal regions.
In addition, the contribution of LDL within the total cholesterol formula seemed to drive the relationship between FA and total cholesterol, such that 78% of voxels observed in the total cholesterol significance map overlapped with significant voxels in the LDL analysis. Significant regions that emerged in the total cholesterol analysis closely mimicked regions reported in the LDL analysis, although associations between total cholesterol and FA extended further along the right hemisphere anterior corona radiata, external capsule, and ventral diencephalon. Additional regions showing decreased FA as a function of increasing total cholesterol included white matter subjacent to the right hemisphere parahippocampal and fusiform cortices.
Negative associations between HDL and FA were also mainly lateralized to the right hemisphere and included sections of the anterior limb of the internal capsule, the external capsule, thalamic pathways, frontal regions such as the anterior corona radiata, medial/lateral orbitofrontal WM, and middle/superior temporal WM. Bilateral significant effects were observed within the external capsule, and superior temporal WM, with additional left hemisphere regions of significance including the retrolenticular portion of the internal capsule and superior frontal WM. Small regions of HDL positively predicting increased FA emerged in isolated sections of the right posterior limb of the internal capsule and in white matter subjacent to the right hemisphere superior parietal cortex.
Of the lipid measures, triglyceride levels revealed the fewest number of voxels showing significant associations with FA. Increasing triglyceride levels were correlated with decreased FA in portions of the middle cerebellar peduncle, genu of the corpus collosum, the brainstem and ventral diencephalon regions, along with bilateral effects in pre/post central WM. Significant negative associations lateralized to the left hemisphere included small portions of the cerebral peduncle, posterior limb of the internal capsule, precuneus, and middle temporal WM. Triglyceride levels were positively associated with increased FA in portions of the left anterior corona radiata and superior parietal WM.
To compare the regional distribution of significant negative associations between FA and each of the individual lipid measures (LDL, HDL, Triglycerides), corrected significance maps from each lipid analyses were combined into a color‐coded overlay displayed on a template T1 brain in Figure 3. Overall, LDL demonstrated the greatest volume of tissue showing statistically significant correlations with FA at the corrected P < 0.05 threshold of the four lipid measures.
Figure 3.

Comparison of significant statistical maps for each lipid measure and FA, covarying for the effects of age and gender (corrected for multiple comparisons, thresholded at P < 0.05): LDL—blue, HDL—red, Triglycerides—green. Only the inverse associations are displayed, such that higher lipid levels predict lower FA. Bottom panel visualizes the three‐dimensional spatial relationship between significant regions specific to each lipid measure. Statistical maps are shown as an overlay on the standard MNI‐152 template.
As LDL emerged as the most robust predictor of white matter tissue integrity as indexed by FA, Figure 4 demonstrates significant associations of LDL with each of the diffusion metrics (FA, radial diffusivity, and axial diffusivity). As previously indicated in Figure 2, increasing levels of LDL were most substantially correlated with reduced FA in right hemisphere temporal white matter, regions of the posterior limb of the internal capsule, the external capsule, as well as right hemisphere frontal/corticospinal areas, including the superior longitudinal fasciculus, and portions of the anterior cingulate (Fig. 4). Associations with LDL and both radial and axial diffusivity closely resembled maps observed in the FA metric, although effects were found in the opposite direction such that increasing LDL predicted higher axial and radial diffusivity. In general however, it appears that radial diffusivity qualitatively held greater associations with LDL in more anterior white matter regions, and axial diffusivity exhibited larger associations with LDL in posterior regions.
Figure 4.
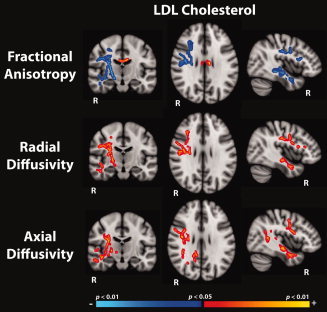
Regions showing significant associations (corrected for multiple comparisons, thresholded at P < 0.05) between low density lipoprotein levels (LDL) and fractional anisotropy (top panel), radial diffusivity (middle panel) and axial diffusivity (bottom panel), regressing the effects of age and gender. Statistical maps are shown as an overlay on the standard MNI‐152 template.
Significant clusters that remained after correcting for multiple comparisons on the linear model examining LDL and FA regressing the effects of age and gender (see FA results in Fig. 4) were assigned anatomical reference labels and deprojected into each subject's native diffusion space to extract mean FA values for each ROI. To assess whether potential confounding variables were influencing the relationship between LDL and FA, the original model (age, gender, and LDL as predictors of FA) was run with MABP, and lipid medication each independently added as predictors to determine if their inclusion significantly contributed to the model. We specifically examined the significance of the change in R 2 (Table III).
Results of these statistical analyses indicate no significant group differences in mean FA between medication groups for all significant clusters and that adding lipid medication status into the model did not significantly account for variance already explained by the original predictive model comprised of LDL, age and gender. When MABP was added to the model, 4 of the 25 clusters showed a significant increase in model fit: Cluster1—RH Superior Longitudinal Fasciculus, R 2 Change = 0.064, F Change(1,120) = 9.663, P < 0.01; Cluster7—RH Precentral WM, R 2 Change = 0.052, F Change(1,120) = 6.779, P =0.01); Cluster10—RH Caudal Middle Frontal WM, R 2 Change = 0.036, F Change(1,120) = 4.834, P < 0.05; Cluster24—Precuneus WM, R 2 Change = 0.055, F Change(1,120) = 7.988, P < 0.01. In our sample, MABP and LDL levels were not significantly correlated with one another r(123) = −0.031, P = 0.733. In addition, separate linear regression analyses were performed on each cluster to test for an interaction between LDL and lipid lowering medication status groups. These regressions did not reveal any significant interactions between medication groups for all clusters indicating that the slope of LDL and FA correlations were not statistically discernable between those on and off lipid lowering medication. Scatterplots showing the linear association between LDL and extracted mean FA and mean radial diffusivity values, labeled by lipid lowering medication status are presented in Figure 5 (mean FA was extracted from clusters of corrected significant voxels resulting from the linear regression model predicting FA from LDL, age, and gender).
Figure 5.
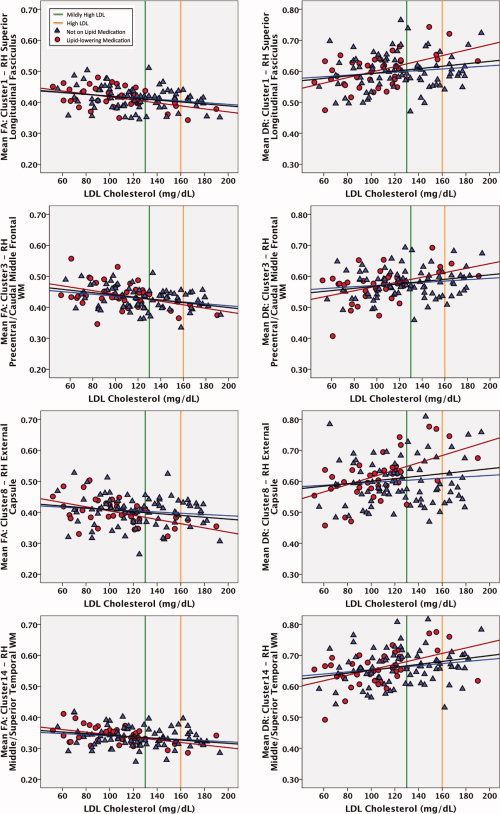
Scatterplots demonstrating the association between low density lipoprotein levels (LDL) and both mean fractional anisotropy (FA) and mean radial diffusivity (DR) within corrected significant clusters (P < 0.05) resulting from the voxelwise analysis of FA by LDL (see Table III), labeled by lipid lowering medication status. Those currently taking lipid lowering agents are shown as red circles, and those not on any lipid modifying agents are shown as blue triangles. The mean fit regression line is shown in black, along with corresponding regression lines for each lipid medication group. The green vertical reference line depicts the cutoff between normal and moderately elevated LDL levels, and the orange vertical reference line depicts the cutoff between moderate and severe LDL levels.
DISCUSSION
The present study demonstrated a relationship between serum lipids, particularly LDL, and white matter tissue integrity. The significant linear fit between LDL and diffusion metrics in various brain regions suggests that correlated decrements in white matter structural integrity as a function of LDL can be evidenced across a range of lipid levels and such associations extend beyond those maintaining only severely elevated lipid levels. These results have two major implications. First, they demonstrate that peripheral markers of factors contributing to vascular health may provide information about neural health outside of the more obvious outcomes of CVD, such as stroke. Second, the results demonstrate that this relationship exists even in individuals within the normal range of serum lipid variation and that these effects remain unaffected by medication use, age or gender. The fact that these associations were observed even within ranges of LDL cholesterol levels that would be considered normal or mild is a unique finding and potentially suggests that subclinical risk may result in alterations to microstructure that possibly contribute to an increased vulnerability for developing further white matter degeneration and potentially cognitive decline later in life. Overall, these findings suggest that optimal management of lipids may need to be reconsidered with regard to neural health and provide clues about physiologic parameters that contribute to what has been a broad category of the effects of “aging.”
Relationship of Serum Cholesterol to White Matter Microstructure
Statistical maps of the relationship between LDL and FA showed the strongest associations out of the examined serum lipids, while TRIGLY and HDL revealed fewer significant correlations with diffusion metrics. In addition, LDL appeared to drive the relationship between TOT cholesterol and FA, with 78% of significant voxels in the TOT map directionally converging with the LDL map. As LDL represents about 60–70% of circulating serum cholesterol and is considered the major artherogenic lipoprotein (ATP III, 2002), the robust effects of LDL above other lipids measured in our analysis highlights the importance of monitoring all components of serum cholesterol and not relying solely on total cholesterol as indicative of health status. The predictive strength of LDL as a risk factor for vascular‐based disease has been well documented in literature concerning coronary heart disease (CHD) and strategies aimed at decreasing levels of this specific lipoprotein in the population have been the primary initiative towards lowering CHD incidence for decades (ATP III, 2002). What is not well documented or understood is how serum lipid levels may be influencing brain structure up to the point of being considered “at risk” for health related insults. Our results indicating an association between decreasing white matter tissue integrity within a range of LDL variation further extends the potential benefit of reducing the number of individuals maintaining elevated levels of this modifiable risk factor in our society.
Increasing LDL levels were significantly associated with reduced FA in anterior and posterior regions (including frontal and temporal areas), as well as several deeper subcortical pathways. Regional effects of our findings somewhat coincide with recent work by Reiman and colleagues who demonstrated that glucose hypometabolism was associated with increasing serum cholesterol in frontal and temporal lobes within a sample of older adults maintaining lipid profiles comparable to our sample [Reiman et al., 2010]. Although our results revealed correlations between LDL and reduced FA in temporal and frontal regions, results were predominately lateralized to the right hemisphere. It may be the case that the normative range of lipids considered in this study can explain the lack of bilateral findings as perhaps regions become bilaterally involved only as serum cholesterol levels become more severe. Therefore, the range of lipid profiles examined in this study is possibly capturing only a snapshot along a more global trajectory of white matter damage associated with more severely elevated serum lipid levels. Alternatively, hemispheric differences in cerebral blood flow perfusion measures have been observed to show lateralized hypoperfusion within right middle/superior frontal regions in clinical conditions such as AD and frontotemporal dementia, and our lateralized findings suggest the possibility that right hemisphere regions carry an increased vulnerability to microstructural damage that may be related to blood flow perfusion properties [Du et al., 2006]. However, this explanation of our lateralized findings is highly speculative as blood flow profusion properties were not assessed. Finally, it must also be considered that certain regions of significant associations between lipids and diffusion metrics observed in this study may possibly be consequential to voxels containing crossing fibers, or to changes of the shape of the tensors, both of which are an ongoing challenge in DTI research that hopefully will resolve as imaging methodology continues to improve. Recently, the mode of anisotropy has been introduced as a useful DTI parameter in determining voxels containing crossing fibers [Douaud et al., 2011], and we plan to further investigate this measure in an upcoming manuscript focusing on multispectral signatures of white matter pathology related to cerebrovascular risk factors.
The associations between LDL and FA remained intact after controlling for age and gender, and did not exhibit a significant interaction based on lipid‐lowering medication usage. Although some research has supported lipid‐lowering agents (LLA) as protective against the development of dementia and AD [Sabbagh et al., 2009; Solomon et al., 2009a], it has also been demonstrated that within individuals taking LLAs, only those who maintain lipid levels within the normal range show decreased odds for developing dementia [Dufouil et al., 2005]. Our findings did not reveal LLA usage to moderate the relationship between LDL and FA. A similar report examining a sample of healthy older adults within a range of lipids comparable to our study, found correlated decreases in cerebral glucose metabolism with elevating serum cholesterol, and these findings were also not moderated by LLA usage [Reiman et al., 2010]. However, the data presented may not be of sufficient design to determine effects of medication on brain tissue structure and more direct intervention would be of great interest for examining this question.
Overall, regions showing reduced FA as a function of serum lipids were most strongly related to increases in radial (DR) compared to axial (DA) diffusivity. Increased radial diffusivity is believed to result from compromised myelin integrity, as opposed to increased axial diffusivity, which is thought to be indicative of axonal damage [Song et al., 2002]. However, this interpretation of radial and axial diffusivity has only been supported in single‐fiber tracts, which can adequately be measured by diffusion tensor imaging. Regions comprised of more complicated underlying microstructure, such as voxels containing crossing fibers, make interpreting changes in DR and DA to anatomical correlates difficult [Wheeler‐Kingshott and Cercignani, 2009]. DR has been previously proposed as a more sensitive measure than anisotropy for examining changes in white matter tissue structure in AD [Acosta‐Cabronero et al., 2010; Salat et al., 2010; Stricker et al., 2009], and we found DR to be especially related to LDL cholesterol in temporal brain regions. Increasing indices of radial diffusivity suggesting compromised myelin integrity is an interesting finding, as cholesterol plays such a critical role in the molecular composition of myelin itself. Along this line, Bartzokis and colleagues have suggested a myelin model of AD pathology that draws upon genetic, molecular and cognitive evidence to argue myelination as the upstream variable leading to physiological changes observed in neurodegenerative disease [Bartzokis, 2011]. Our regional findings overlap with regions showing decreased tissue integrity in AD [Salat et al., 2010], and taken together with the fact that cholesterol has been implicated in AD, it may be that associations between serum cholesterol levels and indices of WM microstructure are in part reflective of a similar process and pattern to how WM is affected in AD. Our findings are limited to a generally healthy population with no overt signs of dementia and any links to the degenerative patterns in AD would therefore be speculative.
White matter regions demonstrating altered tissue integrity as a function of cholesterol are unique compared to previous work examining other components of vascular risk such as hypertension, which is perhaps the most studied vascular risk factor. Several prior studies have reported an association between hypertension and white matter lesions which typically occur in the periventricular regions [Breteler et al., 1994b; Firbank et al., 2007; Raz et al., 2003] and our lab has previously found normal variation in blood pressure to be associated with decreased FA in the anterior but not posterior regions of the corpus collosum in a subset of the current sample of older adults, free from diagnosable cognitive deficits and overt CVD [Leritz et al., 2010]. More recently, our lab reported negative associations between MABP and white matter structural integrity within frontal, lateral parietal and precuneus white matter utilizing the sample reported in the current study. These effects remained after controlling for the presence of white matter lesions, and were observable in subsets limited to prehypertensive individuals, and those with controlled MABP due to medication usage [Salat et al., 2012]. Findings by Kennedy and Raz suggest that as the range of examined blood pressure becomes more severe, clinically diagnosed hypertension extends the deteriorative white matter effects of normal aging along an anterior to posterior gradient [Kennedy and Raz, 2009]. Given the preferential impact of hypertension on anterior brain regions, the mechanism by which elevated blood pressure enhances the risk for developing neurodegenerative disease may be different than those associated with serum cholesterol. The differentiation of regional influences between MABP and serum lipids on white matter microstructure was supported by our results. MABP was a significant predictor of underlying white matter integrity in only 4 of 25 regions that showed a significant association between FA and LDL and were generally isolated to right hemisphere frontal areas (superior longitudinal fasciculus, caudal middle frontal, and precentral WM). Therefore, the majority of significant regional associations between LDL and FA existed outside of the influence of MABP, and extend posteriorly, and into deeper subcortical and temporal regions than may be expected from prior research capturing the effects of MABP on microstructure alone, thus supporting the idea that cholesterol may have unique effects on brain structure.
Mechanisms Relating Serum Cholesterol to Brain Structure
Although levels of circulating LDL appear to correlate with underlying WM tissue integrity, the mechanism relating serum cholesterol in the blood stream to structural alterations within the brain is uncertain. As serum lipids are too large to transverse the blood brain barrier, serum cholesterol is isolated from endogenously synthesized cerebral cholesterol by a selectively permeable membrane. Despite no direct transport of serum cholesterol across the blood brain barrier, cholesterol may undergo an oxidative process allowing the resultant serum‐derived 27‐hydroxycholesterol (27‐OHC) and brain‐derived 24S‐hydroxycholesterol (24S‐OHC), to freely diffuse into the brain driven by concentration gradients [Babiker et al., 2005; Harik‐Khan and Holmes, 1990]. The proportional relationship between levels of these oxysterols, both in the serum and the brain, have previously been utilized as biomarkers for certain neurodegenerative disease including AD [Bretillon et al., 2000b; Heverin et al., 2004], as well as possible indicators of cholesterol synthesis and metabolism in the brain, a processes critical for myelin maintenance and repair [Bjorkhem, 2006; Bretillon et al., 2000a]. Furthermore, oxysterols have been linked to structural alterations in the brain such as increased volume of T2‐weighted brain lesions in multiple sclerosis [Karrenbauer et al., 2006], and has been evidenced to influence the formation of amyloid B‐peptides [Brown et al., 2004], a pathological finding common in AD. Thus, the conversion of cholesterol to oxysterols provides a plausible mechanism linking serum cholesterol to brain structural integrity.
More directly, cholesterol potentially influences white matter integrity by promoting changes in vascular health via artherogenic properties, consequently restricting the flow of oxygenated arterial blood over time. Data available as part of the Rotterdam study reveals that the risk of developing AD or vascular dementia is tripled in those who exhibit atherosclerosis [Hofman et al., 1997]. As atherosclerosis is considered a gradually developing condition in which plaque is accumulated over years leading to stenosis of arterial walls, it is possible that silent, underlying changes may be manifesting in brain structures long before the development of overt cognitive deficits [de la Torre, 2004; Hofman et al., 1997]. This buildup of plaque not only establishes LDL as the main risk factor for heart disease and stroke (American Heart Association), but excessive plaque accumulation in arteries supplying the brain could possibly initiate a cascade of effects detrimental to neuronal health such as cerebral hypoperfusion, damage to the blood brain barrier, and the occurrence of thrombosis leading to blockages of smaller capillaries. As microvasculature that supplies subcortical white matter regions are small in nature, they have been found especially vulnerable to ischemic insults [Schmahmann et al., 2008].
Limitations to the Study and Future Directions
The results of the current study should be interpreted within the framework of its limitations. This is a cross‐sectional study in a population in the generally healthy range without any diagnosable degenerative conditions, limiting the ability to make any definitive statements regarding causality. Longitudinal and interventional studies will help to clarify this issue, as well as to determine how LDL levels relate to the potential onset of overt cerebrovascular or cognitive symptoms such as dementia. It is important to comment on the potential generalizability of our results, given our sample. Individuals with a first‐degree family history of dementia are at a slightly higher risk of developing dementia [Huang et al., 2004], and higher levels of CVD risk factors are known to exist comorbidly in dementia and dementia risk [Rosano et al., 2007]. In addition, CVD risk factors are more widespread in African American communities [Singh et al., 1998]. Thus, our sample is somewhat biased in that it could contain higher prevalence of associations between CVD risk factors and brain structure. We conceptualize this as a strength, as it has allowed us to examine these relationships in the context of a potentially enriched sample. However, the degree to which we can generalize our findings to the overall population is uncertain. Despite potential limitations, this study shows that alterations to white matter are associated with serum lipid levels, even below the threshold of what is considered at risk for health related insults. Further research in this topic stands to heighten our present understanding of how modifiable physiological factors such as serum cholesterol influences neuronal health, and may provide new consideration to how we approach normative aging.
CONCLUSIONS
This investigation reveals that within a sample of cognitively healthy older adults, serum cholesterol levels are associated with reduced WM structural integrity and that these results are independent of age or gender, and not moderated by lipid‐lowering medication usage. Of the serum cholesterols, low‐density lipoproteins (LDL) exhibited the most robust associations with white matter integrity, while high‐density lipoproteins and triglycerides revealed minimal correlations with tissue structure. Observed regions showing a decline in WM tissue integrity as a function of LDL, such as right hemisphere temporal and frontal regions, coincide with previous findings assessing correlations with cerebrovascular and AD risk. Recent work has begun to delineate the potential role of cholesterol in the pathogenesis of AD [Martins et al., 2009], and our findings support the plausibility of LDL contributing to a mechanism leading to alterations in brain tissue structure, particularly white matter integrity. Based on the normative range of lipid profiles in this study, observed declines in WM integrity may be seen even in subclinical ranges, highlighting the fact that as serum cholesterol is a modifiable risk factor, promoting healthy nutritional habits in an effort to dampen the observed effects on neuronal tissue structure may be a worthwhile strategy in preventing the onset and decreasing the prevalence of neurodegenerative disease in the elderly.
Acknowledgements
The authors thank Marge Ahlquist for her assistance with BP collection and phlebotomy on all participants.
REFERENCES
- Acosta‐Cabronero J, Williams GB, Pengas G, Nestor PJ ( 2010): Absolute diffusivities define the landscape of white matter degeneration in Alzheimer's disease. Brain 133 ( Part 2): 529–539. [DOI] [PubMed] [Google Scholar]
- Andersson JLR, Jenkinson M, Smith SM ( 2007a): Nonlinear optimisation. Oxford: FMRIB Technical Report TR07JA1. [Google Scholar]
- Andersson JLR, Jenkinson M, Smith SM ( 2007b): Nonlinear registration, aka Spatial Normalisation. Oxford: FMRIB Technical Report TR07JA2. http://www.fmrib.ox.ac.uk/analysis/techrep. [Google Scholar]
- Anstey KJ, Lipnicki DM, Low LF ( 2008): Cholesterol as a risk factor for dementia and cognitive decline: A systematic review of prospective studies with meta‐analysis. Am J Geriatr Psychiatry 16: 343–354. [DOI] [PubMed] [Google Scholar]
- Babiker A, Dzeletovic S, Wiklund B, Pettersson N, Salonen J, Nyyssonen K, Eriksson M, Diczfalusy U, Bjorkhem I ( 2005): Patients with atherosclerosis may have increased circulating levels of 27‐hydroxycholesterol and cholestenoic acid. Scand J Clin Lab Invest 65: 365–375. [DOI] [PubMed] [Google Scholar]
- Bartzokis G ( 2011): Alzheimer's disease as homeostatic responses to age‐related myelin breakdown. Neurobiol Aging 32:1341–1371. [DOI] [PMC free article] [PubMed] [Google Scholar]
- Basser PJ, Mattiello J, LeBihan D ( 1994): Estimation of the effective self‐diffusion tensor from the NMR spin echo. J Magn Reson B 103: 247–254. [DOI] [PubMed] [Google Scholar]
- Bjorkhem I ( 2006): Crossing the barrier: Oxysterols as cholesterol transporters and metabolic modulators in the brain. J Intern Med 260: 493–508. [DOI] [PubMed] [Google Scholar]
- Bohnstedt M, Fox PJ, Kohatsu ND.( 1994): Correlates of Mini‐Mental Status Examination scores among elderly demented patients: The influence of race‐ethnicity. J Clin Epidemiol 47: 1381–1387. [DOI] [PubMed] [Google Scholar]
- Breteler MM, Claus JJ, Grobbee DE, Hofman A ( 1994a): Cardiovascular disease and distribution of cognitive function in elderly people: The Rotterdam Study. BMJ 308: 1604–1608. [DOI] [PMC free article] [PubMed] [Google Scholar]
- Breteler MM, van Swieten JC, Bots ML, Grobbee DE, Claus JJ, van den Hout JH, van Harskamp F, Tanghe HL, de Jong PT, van Gijn J, Hofman A ( 1994b): Cerebral white matter lesions, vascular risk factors, and cognitive function in a population‐based study: The Rotterdam Study. Neurology 44: 1246–1252. [DOI] [PubMed] [Google Scholar]
- Bretillon L, Lutjohann D, Stahle L, Widhe T, Bindl L, Eggertsen G, Diczfalusy U, Bjorkhem I ( 2000a): Plasma levels of 24S‐hydroxycholesterol reflect the balance between cerebral production and hepatic metabolism and are inversely related to body surface. J Lipid Res 41: 840–845. [PubMed] [Google Scholar]
- Bretillon L, Siden A, Wahlund LO, Lutjohann D, Minthon L, Crisby M, Hillert J, Groth CG, Diczfalusy U, Bjorkhem I ( 2000b): Plasma levels of 24S‐hydroxycholesterol in patients with neurological diseases. Neurosci Lett 293: 87–90. [DOI] [PubMed] [Google Scholar]
- Brown J III, Theisler C, Silberman S, Magnuson D, Gottardi‐Littell N, Lee JM, Yager D, Crowley J, Sambamurti K, Rahman MM, Reiss AB, Eckman CB, Wolozin B ( 2004): Differential expression of cholesterol hydroxylases in Alzheimer's disease. J Biol Chem 279: 34674–34681. [DOI] [PubMed] [Google Scholar]
- Budde MD, Kim JH, Liang HF, Schmidt RE, Russell JH, Cross AH, Song SK ( 2007): Toward accurate diagnosis of white matter pathology using diffusion tensor imaging. Magn Reson Med 57: 688–695. [DOI] [PubMed] [Google Scholar]
- Dale AM, Fischl B, Sereno MI ( 1999): Cortical surface‐based analysis. I. Segmentation and surface reconstruction. Neuroimage 9: 179–194. [DOI] [PubMed] [Google Scholar]
- de la Torre JC ( 2004): Is Alzheimer's disease a neurodegenerative or a vascular disorder? Data, dogma, and dialectics. Lancet Neurol 3: 184–190. [DOI] [PubMed] [Google Scholar]
- Douaud G, Jbabdi S, Behrens TE, Menke RA, Gass A, Monsch AU, Rao A, Whitcher B, Kindlmann G, Matthews PM, Smith S ( 2011): DTI measures in crossing‐fibre areas: Increased diffusion anisotropy reveals early white matter alteration in MCI and mild Alzheimer's disease. Neuroimage 55: 880–890. [DOI] [PMC free article] [PubMed] [Google Scholar]
- Du AT, Jahng GH, Hayasaka S, Kramer JH, Rosen HJ, Gorno‐Tempini ML, Rankin KP, Miller BL, Weiner MW, Schuff N ( 2006): Hypoperfusion in frontotemporal dementia and Alzheimer disease by arterial spin labeling MRI. Neurology 67: 1215–1220. [DOI] [PMC free article] [PubMed] [Google Scholar]
- Dufouil C, Richard F, Fievet N, Dartigues JF, Ritchie K, Tzourio C, Amouyel P, Alperovitch A ( 2005): APOE genotype, cholesterol level, lipid‐lowering treatment, and dementia: The Three‐City Study. Neurology 64: 1531–1538. [DOI] [PubMed] [Google Scholar]
- Firbank MJ, Wiseman RM, Burton EJ, Saxby BK, O'Brien JT, Ford GA ( 2007): Brain atrophy and white matter hyperintensity change in older adults and relationship to blood pressure. Brain atrophy, WMH change and blood pressure. J Neurol 254: 713–721. [DOI] [PubMed] [Google Scholar]
- Fischl B, Dale AM ( 2000): Measuring the thickness of the human cerebral cortex from magnetic resonance images. Proc Natl Acad Sci USA 97: 11050–11055. [DOI] [PMC free article] [PubMed] [Google Scholar]
- Fischl B, Liu A, Dale AM ( 2001): Automated manifold surgery: Constructing geometrically accurate and topologically correct models of the human cerebral cortex. IEEE Trans Med Imaging 20: 70–80. [DOI] [PubMed] [Google Scholar]
- Fischl B, Salat DH, Busa E, Albert M, Dieterich M, Haselgrove C, van der Kouwe A, Killiany R, Kennedy D, Klaveness S, Montillo A, Makris N, Rosen B, Dale AM ( 2002): Whole brain segmentation: Automated labeling of neuroanatomical structures in the human brain. Neuron 33: 341–355. [DOI] [PubMed] [Google Scholar]
- Fischl B, Salat DH, van der Kouwe AJ, Makris N, Segonne F, Quinn BT, Dale AM ( 2004a): Sequence‐independent segmentation of magnetic resonance images. Neuroimage 23( Suppl 1): S69–S84. [DOI] [PubMed] [Google Scholar]
- Fischl B, Sereno MI, Dale AM ( 1999a): Cortical surface‐based analysis. II: Inflation, flattening, and a surface‐based coordinate system. Neuroimage 9: 195–207. [DOI] [PubMed] [Google Scholar]
- Fischl B, Sereno MI, Tootell RB, Dale AM ( 1999b): High‐resolution intersubject averaging and a coordinate system for the cortical surface. Hum Brain Mapp 8: 272–284. [DOI] [PMC free article] [PubMed] [Google Scholar]
- Fischl B, van der Kouwe A, Destrieux C, Halgren E, Segonne F, Salat DH, Busa E, Seidman LJ, Goldstein J, Kennedy D, Caviness V, Makris N, Rosen B, Dale AM ( 2004b): Automatically parcellating the human cerebral cortex. Cereb Cortex 14: 11–22. [DOI] [PubMed] [Google Scholar]
- Folstein MF, Folstein SE, McHugh PR ( 1975): “Mini‐mental state.” A practical method for grading the cognitive state of patients for the clinician. J Psychiatr Res 12: 189–198. [DOI] [PubMed] [Google Scholar]
- Fortuny LA, Briggs M, Newcombe F, Ratcliff G, Thomas C ( 1980): Measuring the duration of post traumatic amnesia. J Neurol Neurosurg Psychiatry 43: 377–379. [DOI] [PMC free article] [PubMed] [Google Scholar]
- Gerring D, Nabavi A, Kikinis R, Grimson W, Hata N, Everett P, Jolesz F, Wells W ( 1999): An integrated visualization system for surgical planning and guidance using image fusion and interventional imaging. Int Conf Med Image Comput Assist Interv 2: 809–819. [Google Scholar]
- Greve DN, Fischl B ( 2009): Accurate and robust brain image alignment using boundary‐based registration. Neuroimage 48: 63–72. [DOI] [PMC free article] [PubMed] [Google Scholar]
- Gunning‐Dixon FM, Brickman AM, Cheng JC, Alexopoulos GS ( 2009): Aging of cerebral white matter: A review of MRI findings. Int J Geriatr Psychiatry 24: 109–117. [DOI] [PMC free article] [PubMed] [Google Scholar]
- Han X, Jovicich J, Salat D, van der Kouwe A, Quinn B, Czanner S, Busa E, Pacheco J, Albert M, Killiany R, Maguire P, Rosas D, Makris N, Dale A, Dickerson B, Fischl B ( 2006): Reliability of MRI‐derived measurements of human cerebral cortical thickness: The effects of field strength, scanner upgrade and manufacturer. Neuroimage 32: 180–194. [DOI] [PubMed] [Google Scholar]
- Harik‐Khan R, Holmes RP ( 1990): Estimation of 26‐hydroxycholesterol in serum by high‐performance liquid chromatography and its measurement in patients with atherosclerosis. J Steroid Biochem 36: 351–355. [DOI] [PubMed] [Google Scholar]
- Hayasaka S, Nichols TE ( 2003): Validating cluster size inference: Random field and permutation methods. Neuroimage 20: 2343–2356. [DOI] [PubMed] [Google Scholar]
- Heverin M, Bogdanovic N, Lutjohann D, Bayer T, Pikuleva I, Bretillon L, Diczfalusy U, Winblad B, Bjorkhem I ( 2004): Changes in the levels of cerebral and extracerebral sterols in the brain of patients with Alzheimer's disease. J Lipid Res 45: 186–193. [DOI] [PubMed] [Google Scholar]
- Hofman A, Ott A, Breteler MM, Bots ML, Slooter AJ, van Harskamp F, van Duijn CN, Van Broeckhoven C, Grobbee DE ( 1997): Atherosclerosis, apolipoprotein E, and prevalence of dementia and Alzheimer's disease in the Rotterdam Study. Lancet 349: 151–154. [DOI] [PubMed] [Google Scholar]
- Huang W, Qiu C, von Strauss E, Winblad B, Fratiglioni L ( 2004): APOE genotype, family history of dementia, and Alzheimer disease risk: A 6‐year follow‐up study. Arch Neurol 61: 1930–1934. [DOI] [PubMed] [Google Scholar]
- Jones DK, Horsfield MA, Simmons A ( 1999): Optimal strategies for measuring diffusion in anisotropic systems by magnetic resonance imaging. Magn Reson Med 42: 515–525. [PubMed] [Google Scholar]
- Jovicich J, Czanner S, Greve D, Haley E, van der Kouwe A, Gollub R, Kennedy D, Schmitt F, Brown G, Macfall J, Fischl B, Dale A ( 2006): Reliability in multi‐site structural MRI studies: Effects of gradient non‐linearity correction on phantom and human data. Neuroimage 30: 436–443. [DOI] [PubMed] [Google Scholar]
- Karrenbauer VD, Leoni V, Lim ET, Giovannoni G, Ingle GT, Sastre‐Garriga J, Thompson AJ, Rashid W, Davies G, Miller DH, Bjorkhem I, Masterman T ( 2006): Plasma cerebrosterol and magnetic resonance imaging measures in multiple sclerosis. Clin Neurol Neurosurg 108: 456–460. [DOI] [PubMed] [Google Scholar]
- Kennedy KM, Raz N ( 2009): Pattern of normal age‐related regional differences in white matter microstructure is modified by vascular risk. Brain Res 1297: 41–56. [DOI] [PMC free article] [PubMed] [Google Scholar]
- Kivipelto M, Helkala EL, Laakso MP, Hanninen T, Hallikainen M, Alhainen K, Iivonen S, Mannermaa A, Tuomilehto J, Nissinen A, Soininen H ( 2002): Apolipoprotein E epsilon4 allele, elevated midlife total cholesterol level, and high midlife systolic blood pressure are independent risk factors for late‐life Alzheimer disease. Ann Intern Med 137: 149–155. [DOI] [PubMed] [Google Scholar]
- Lee DY, Fletcher E, Martinez O, Ortega M, Zozulya N, Kim J, Tran J, Buonocore M, Carmichael O, DeCarli C ( 2009): Regional pattern of white matter microstructural changes in normal aging, MCI, and AD. Neurology 73: 1722–1728. [DOI] [PMC free article] [PubMed] [Google Scholar]
- Leritz EC, Salat DH, Williams VJ, Schnyer DM, Rudolph JL, Lipsitz LA, Fischl B, McGlinchey RE, Milberg WP ( 2011). Thickness of the human cerebral cortex is associated with metrics of cerebrovascular health in a normative sample of commnity‐dwelling older adults. Neuroimage 54: 2659–2671. [DOI] [PMC free article] [PubMed] [Google Scholar]
- Leritz EC, Salat DH, Milberg WP, Williams VJ, Chapman CE, Grande LJ, Rudolph JL, Schnyer DM, Barber CE, Lipsitz LA, McGlinchey RE ( 2010): Variation in blood pressure is associated with white matter microstructure but not cognition in African Americans. Neuropsychology 24: 199–208. [DOI] [PMC free article] [PubMed] [Google Scholar]
- Lloyd‐Jones D, Adams R, Carnethon M, De Simone G, Ferguson TB, Flegal K, Ford E, Furie K, Go A, Greenlund K, Haase N, Hailpern S, Ho M, Howard V, Kissela B, Kittner S, Lackland D, Lisabeth L, Marelli A, McDermott M, Meigs J, Mozaffarian D, Nichol G, O'Donnell C, Roger V, Rosamond W, Sacco R, Sorlie P, Stafford R, Steinberger J, Thom T, Wasserthiel‐Smoller S, Wong N, Wylie‐Rosett J, Hong Y ( 2009): Heart disease and stroke statistics—2009 update: A report from the American Heart Association Statistics Committee and Stroke Statistics Subcommittee. Circulation 119: e21–e181. [DOI] [PubMed] [Google Scholar]
- Martins IJ, Berger T, Sharman MJ, Verdile G, Fuller SJ, Martins RN ( 2009): Cholesterol metabolism and transport in the pathogenesis of Alzheimer's disease. J Neurochem 111: 1275–1308. [DOI] [PubMed] [Google Scholar]
- Meyer JS, Rauch GM, Crawford K, Rauch RA, Konno S, Akiyama H, Terayama Y, Haque A ( 1999): Risk factors accelerating cerebral degenerative changes, cognitive decline and dementia. Int J Geriatr Psychiatry 14: 1050–1061. [DOI] [PubMed] [Google Scholar]
- Mori S, Wakana S, Van Zijl PCM ( 2005): MRI Atlas of Human White Matter. Boston: Elsevier; 239 p. [Google Scholar]
- Qiu A, Oishi K, Miller MI, Lyketsos CG, Mori S, Albert M ( 2010): Surface‐based analysis on shape and fractional anisotropy of white matter tracts in Alzheimer's disease. PLoS One 5: e9811. [DOI] [PMC free article] [PubMed] [Google Scholar]
- Raz N, Rodrigue KM, Acker JD ( 2003): Hypertension and the brain: Vulnerability of the prefrontal regions and executive functions. Behav Neurosci 117: 1169–1180. [DOI] [PubMed] [Google Scholar]
- Reese TG, Heid O, Weisskoff RM, Wedeen VJ ( 2003): Reduction of eddy‐current‐induced distortion in diffusion MRI using a twice‐refocused spin echo. Magn Reson Med 49: 177–182. [DOI] [PubMed] [Google Scholar]
- Reiman EM, Chen K, Langbaum JB, Lee W, Reschke C, Bandy D, Alexander GE, Caselli RJ ( 2010): Higher serum total cholesterol levels in late middle age are associated with glucose hypometabolism in brain regions affected by Alzheimer's disease and normal aging. Neuroimage 49: 169–176. [DOI] [PMC free article] [PubMed] [Google Scholar]
- Rosano C, Aizenstein HJ, Wu M, Newman AB, Becker JT, Lopez OL, Kuller LH ( 2007): Focal atrophy and cerebrovascular disease increase dementia risk among cognitively normal older adults. J Neuroimaging 17: 148–155. [DOI] [PubMed] [Google Scholar]
- Rueckert D, Sonoda LI, Hayes C, Hill DL, Leach MO, Hawkes DJ ( 1999): Nonrigid registration using free‐form deformations: Application to breast MR images. IEEE Trans Med Imaging 18: 712–721. [DOI] [PubMed] [Google Scholar]
- Sabbagh MN, Thind K, Sparks DL ( 2009): On cholesterol levels and statins in cognitive decline and Alzheimer disease: Progress and setbacks. Alzheimer Dis Assoc Disord 23: 303–305. [DOI] [PMC free article] [PubMed] [Google Scholar]
- Salat DH, Tuch DS, Hevelone ND, Fischl B, Corkin S, Rosas HD, Dale AM ( 2005): Age‐related changes in prefrontal white matter measured by diffusion tensor imaging. Ann NY Acad Sci 1064: 37–49. [DOI] [PubMed] [Google Scholar]
- Salat DH, Greve DN, Pacheco JL, Quinn BT, Helmer KG, Buckner RL, Fischl B ( 2009): Regional white matter volume differences in nondemented aging and Alzheimer's disease. Neuroimage 44: 1247–1258. [DOI] [PMC free article] [PubMed] [Google Scholar]
- Salat DH, Tuch DS, van der Kouwe AJ, Greve DN, Pappu V, Lee SY, Hevelone ND, Zaleta AK, Growdon JH, Corkin S, Fischl B, Rosas HD ( 2010): White matter pathology isolates the hippocampal formation in Alzheimer's disease. Neurobiol Aging 31: 244–256. [DOI] [PMC free article] [PubMed] [Google Scholar]
- Salat DH, Williams VJ, Leritz EC, Schnyer DM, Rudolph JL, Lipsitz LA, McGlinchey RE, Milberg WP ( 2012): Inter‐individual variation in blood pressure is associated with regional white matter integrity in generally healthy older adults. Neuroimage 59: 181–192. [DOI] [PMC free article] [PubMed] [Google Scholar]
- Schmahmann JD, Smith EE, Eichler FS, Filley CM ( 2008): Cerebral white matter: Neuroanatomy, clinical neurology, and neurobehavioral correlates. Ann NY Acad Sci 1142: 266–309. [DOI] [PMC free article] [PubMed] [Google Scholar]
- Segonne F, Dale AM, Busa E, Glessner M, Salat D, Hahn HK, Fischl B ( 2004): A hybrid approach to the skull stripping problem in MRI. Neuroimage 22: 1060–1075. [DOI] [PubMed] [Google Scholar]
- Segonne F, Pacheco J, Fischl B ( 2007): Geometrically accurate topology‐correction of cortical surfaces using nonseparating loops. IEEE Trans Med Imaging 26: 518–529. [DOI] [PubMed] [Google Scholar]
- Segura B, Jurado MA, Freixenet N, Falcon C, Junque C, Arboix A ( 2009): Microstructural white matter changes in metabolic syndrome: A diffusion tensor imaging study. Neurology 73: 438–444. [DOI] [PubMed] [Google Scholar]
- Singh R, Cohen SN, Krupp R, Abedi AG ( 1998): Racial differences in ischemic cerebrovascular disease. J Stroke Cerebrovasc Dis 7: 352–357. [DOI] [PubMed] [Google Scholar]
- Sled JG, Zijdenbos AP, Evans AC ( 1998): A nonparametric method for automatic correction of intensity nonuniformity in MRI data. IEEE Trans Med Imaging 17: 87–97. [DOI] [PubMed] [Google Scholar]
- Smith SM ( 2002): Fast robust automated brain extraction. Hum Brain Mapp 17: 143–155. [DOI] [PMC free article] [PubMed] [Google Scholar]
- Smith SM, Jenkinson M, Johansen‐Berg H, Rueckert D, Nichols TE, Mackay CE, Watkins KE, Ciccarelli O, Cader MZ, Matthews PM, Behrens TE ( 2006): Tract‐based spatial statistics: Voxelwise analysis of multi‐subject diffusion data. Neuroimage 31: 1487–1505. [DOI] [PubMed] [Google Scholar]
- Smith SM, Jenkinson M, Woolrich MW, Beckmann CF, Behrens TE, Johansen‐Berg H, Bannister PR, De Luca M, Drobnjak I, Flitney DE, Niazy RK, Saunders J, Vickers J, Zhang Y, De Stefano N, Brady JM, Matthews PM ( 2004): Advances in functional and structural MR image analysis and implementation as FSL. Neuroimage 23 ( Suppl 1): S208–S219. [DOI] [PubMed] [Google Scholar]
- Solomon A, Kareholt I, Ngandu T, Wolozin B, Macdonald SW, Winblad B, Nissinen A, Tuomilehto J, Soininen H, Kivipelto M ( 2009a): Serum total cholesterol, statins and cognition in non‐demented elderly. Neurobiol Aging 30: 1006–1009. [DOI] [PubMed] [Google Scholar]
- Solomon A, Kivipelto M, Wolozin B, Zhou J, Whitmer RA ( 2009b): Midlife serum cholesterol and increased risk of Alzheimer's and vascular dementia three decades later. Dement Geriatr Cogn Disord 28: 75–80. [DOI] [PMC free article] [PubMed] [Google Scholar]
- Song SK, Sun SW, Ju WK, Lin SJ, Cross AH, Neufeld AH ( 2003): Diffusion tensor imaging detects and differentiates axon and myelin degeneration in mouse optic nerve after retinal ischemia. Neuroimage 20: 1714–1722. [DOI] [PubMed] [Google Scholar]
- Song SK, Sun SW, Ramsbottom MJ, Chang C, Russell J, Cross AH ( 2002): Dysmyelination revealed through MRI as increased radial (but unchanged axial) diffusion of water. Neuroimage 17: 1429–1436. [DOI] [PubMed] [Google Scholar]
- Sparks DL, Scheff SW, Hunsaker JC III, Liu H, Landers T, Gross DR ( 1994): Induction of Alzheimer‐like beta‐amyloid immunoreactivity in the brains of rabbits with dietary cholesterol. Exp Neurol 126: 88–94. [DOI] [PubMed] [Google Scholar]
- Stewart R, White LR, Xue QL, Launer LJ ( 2007): Twenty‐six‐year change in total cholesterol levels and incident dementia: The Honolulu‐Asia Aging Study. Arch Neurol 64: 103–107. [DOI] [PubMed] [Google Scholar]
- Stricker NH, Schweinsburg BC, Delano‐Wood L, Wierenga CE, Bangen KJ, Haaland KY, Frank LR, Salmon DP, Bondi MW ( 2009): Decreased white matter integrity in late‐myelinating fiber pathways in Alzheimer's disease supports retrogenesis. Neuroimage 45: 10–16. [DOI] [PMC free article] [PubMed] [Google Scholar]
- van Vliet P, van de Water W, de Craen AJ, Westendorp RG ( 2009): The influence of age on the association between cholesterol and cognitive function. Exp Gerontol 44: 112–122. [DOI] [PubMed] [Google Scholar]
- Wheeler‐Kingshott CA, Cercignani M ( 2009): About “axial” and “radial” diffusivities. Magn Reson Med 61: 1255–1260. [DOI] [PubMed] [Google Scholar]