Abstract
Purpose
We assessed the independent predictive value of prostate volume, number of biopsy cores and AUASS (American Urological Association symptom score) compared to risk factors included in the PCPTRC (Prostate Cancer Prevention Trial risk calculator for prostate cancer) and PCPTHG (Prostate Cancer Prevention Trial risk calculator for high grade cancer [Gleason grade 7 or greater]).
Materials and Methods
Of 5,519 PCPT (Prostate Cancer Prevention Trial) participants the 4,958 used to construct the PCPTRC with AUASS and prostate specific antigen 10 ng/ml or less were included on logistic regression analysis. Risk algorithms were evaluated in 571 EDRN (Early Detection Research Network) participants using the ROC AUC.
Results
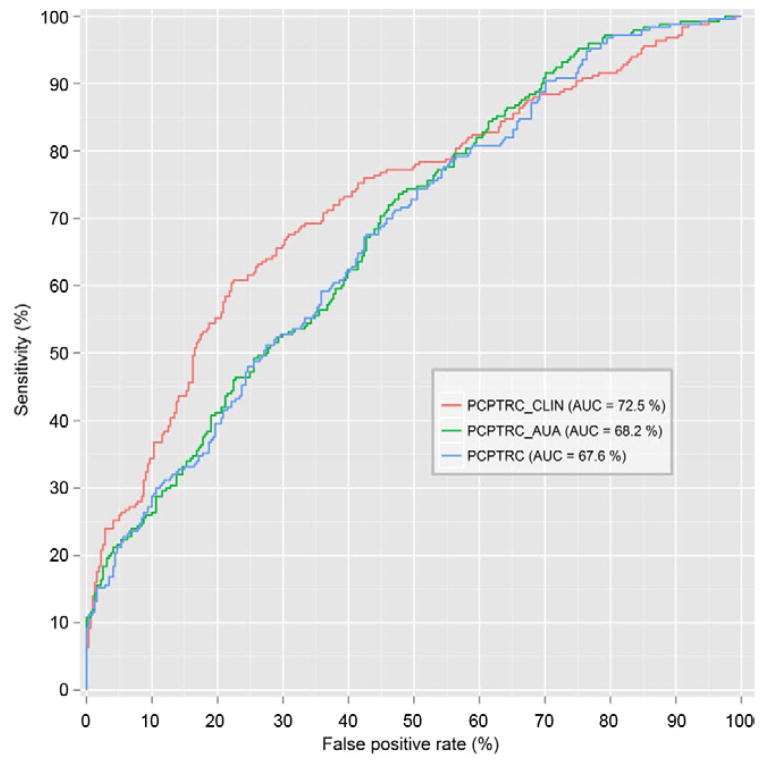
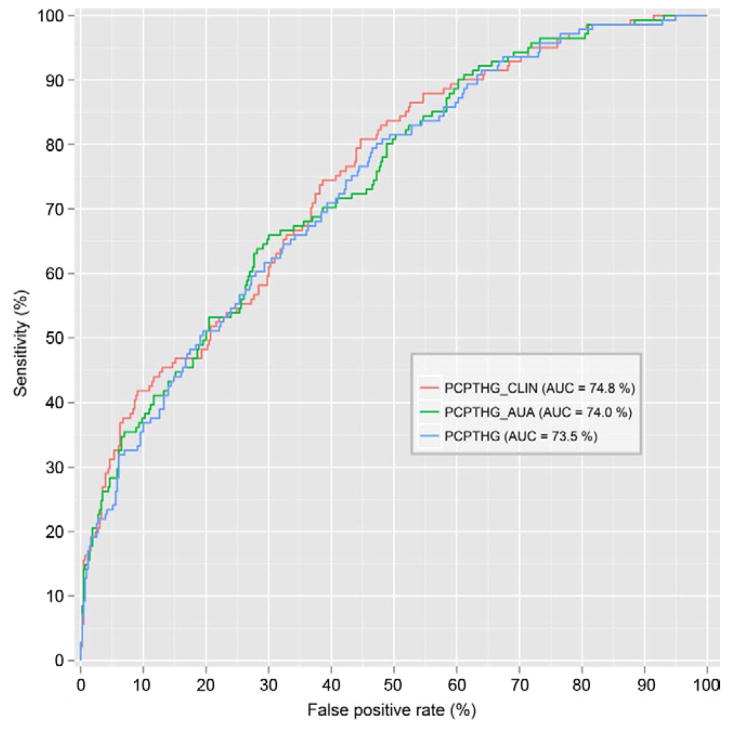
A total of 1,094 participants (22.1%) had prostate cancer, of whom 232 (21.2%) had high grade disease. For prostate cancer prediction higher prostate specific antigen, abnormal digital rectal examination, family history of prostate cancer and number of cores were associated with increased risk, while volume was associated with decreased risk. Excluding prostate volume and number of cores, a history of negative biopsy and increased AUASS were also associated with lower risk. For high grade cancer higher prostate specific antigen, abnormal digital rectal examination, black race and number of cores were associated with increased risk and volume, while AUASS was associated with decreased risk. The AUC of the PCPTRC adjusted for volume and number of cores was 72.7% using EDRN data and 68.2% when adjusted for AUASS alone vs 67.6% for the PCPTRC. For high grade disease the AUC was 74.8% and 74.0%, respectively, vs 73.5% for the PCPTHG.
Conclusions
Adjusted PCPT risk calculators for volume, number of cores and AUASS improve cancer detection.
Keywords: prostate, prostatic neoplasms, risk, algorithms, early detection of cancer
For 2 decades since its introduction for the early detection of prostate cancer, PSA has been used as a dichotomous test. PSA 4.0 ng/ml or less was deemed normal, while PSA above this value was thought to be increased, often prompting prostate biopsy. With the PCPT end of study biopsies done regardless of PSA it became apparent that PSA is directly related to cancer risk and there is no lower bound at which cancer cannot be found.1 It was subsequently recognized that other variables, including race, age, family history, DRE and prostate biopsy history (prior negative biopsy) significantly affected cancer risk, especially the risk of high grade cancer (Gleason grade 7 or greater), which is the type of prostate cancer most likely to affect life expectancy.2 Using PCPT data, these variables were combined to develop the PCPTRC for prostate cancer and the PCPTHG for high grade disease, which were validated in many populations.3,4
Several other risk tools have been developed to assess prostate cancer risk. One is based on data from the ERSPC (European Randomized Study of Screening for Prostate Cancer) which, similar to the PCPT, implemented a 6-core biopsy technique at most centers. TRUS prostate volume was included in the ERSPC calculator after a statistically significant association was established with decreased prostate cancer risk.5 Volume acts as a marker of detection rather than of cancer. For any given prostate tumor of a fixed volume and for a fixed biopsy sampling scheme a larger prostate volume should be associated with a lower chance of detecting prostate cancer.
Prostate volume was not included in the development of the PCPT risk calculators. We hypothesized that increased prostate volume could have been associated with decreased risk of prostate cancer detection in the PCPT. Since prostate volume is not routinely evaluated at the clinic, we evaluated whether the AUASS for enlarged prostate symptoms could serve as a surrogate for the effects of volume for risk prediction, hypothesizing that a higher AUASS would also be associated with a decreased risk of prostate cancer detection.
Recent recommendations against PSA screening highlight the significant risk of over detecting inconsequential prostate cancer, a cause being the increased prostate sampling through more biopsy cores, from 6 in the 1990s to the 10 to 12 cores commonly used today.6 Since fewer PCPT participants underwent biopsy with more than the protocol specified 6 cores, we analyzed these data, hypothesizing an increase in prostate cancer and high grade disease detection in these participants.
The purpose of this investigation was to assess the independent predictive value of 3 additional factors (prostate volume, number of cores on biopsy and AUASS) that were not included in the original PCPT risk calculators and incorporate them in additional online calculators if they were found to be relevant.
MATERIALS AND METHODS
Participants
After receiving internal review board approval, from the original 5,519 placebo arm participants used to construct the original PCPT risk calculators we selected 4,958 (89.8%) in whom AUASS was measured within 1 year before biopsy and who had PSA 10 ng/ml or less. The AUASS asks 7 questions concerning urination frequency and urgency that may be indicative of benign prostate hyperplasia or prostate inflammation. Each question is answered on a range of 0—no symptoms to 5—highly symptomatic for a total score of 0 to 35.
Statistical Analysis
Patient characteristics were compared between cancer positive and negative biopsies using the 2-sample Wilcoxon test for continuous measures and the chi-square test for categorical measures. For multivariable modeling PSA was log base 2 (log2) transformed so that the resulting OR would be interpretable as the change in the odds of outcome for a twofold increase in PSA. That is, the same OR would denote the increase in prostate cancer risk for an increase in PSA from 0.5 to 1 ng/ml or from 5 to 10 ng/ml. Excluding outlying large PSA values of greater than 10 ng/ml, as found in less than 1% of the original cohort, enhanced goodness of fit statistics. The inclusion of volume in models was tested in 2 ways, that is as an additional predictor in the form of log2(volume), or by replacing log2(PSA) with log2(PSA/volume), a measure of PSA density that is often used in clinical prediction models. Participants with missing volume and/or number of cores were excluded from analysis.
All possible combinations and interactions of risk factors were considered for separate prediction models for any prostate cancer and for high grade disease. Optimal models were selected using the BIC. For all cancer end points first only volume and number of cores were included, in addition to PCPT risk factors, in multivariable models labeled PCPTRC_CLIN and PCPTHG_CLIN, respectively, and then only AUASS was included, in addition to the original PCPT risk factors, labeled PCPTRC_AUA and PCPTHG_AUA, respectively. The second set of models was developed for cases in which prostate volume was not available. Since number of biopsy cores is typically fixed by institutional practices and not discussed with the patient, it was similarly excluded from the set of second models. Number of biopsy cores and AUASS were not transformed for inclusion in multivariable models. The Spearman rank correlation was used to assess the correlation between prostate volume and AUASS.
Validation
Risk calculators were evaluated on the EDRN reference set comprising 571 biopsies. This population differs significantly from the PCPT screening population since it is a clinical referral population (most biopsies more than 6 cores) that is younger, more racially mixed and with more prostatic symptoms, including higher PSA.7 Validation was performed using ROC curves and their AUC. Non-parametric tests were used to assess statistical significance between AUCs using the different calculators.8
RESULTS
Compared to PCPT participants who had negative biopsies, those diagnosed with prostate cancer were more likely to be black, have a positive family history, abnormal DRE, higher PSA and a greater number of biopsy cores (see table). Significantly more positive biopsies were detected by interim evaluations during the PCPT, as prompted by PSA greater than 4 ng/ml or abnormal DRE, than by the required end of study biopsies regardless of PSA and DRE findings. The proportion of missing volumes was 21.2% for positive biopsy cases compared to 18.8% for negative biopsies (p = 0.08). The proportion with a missing number of cores was 12.0% and 13.5%, respectively (p = 0.21). The correlation between AUASS and prostate volume was low at 0.136 but significantly different from 0 (p <0.0001).
PCPTRC_CLIN for Prostate Cancer
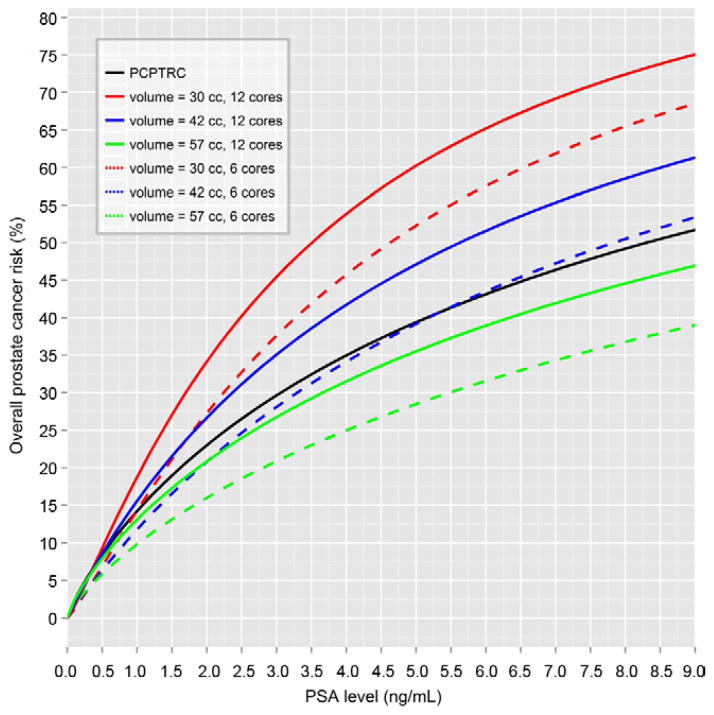
Of the 4,958 participants 1,094 (22.1%) were biopsy positive. The optimal risk model for overall prostate cancer included DRE (abnormal DRE OR 4.09, 95% CI 3.07–5.44, p <0.0001), family history (positive family history OR 1.26, 95% CI 1.02–1.55, p = 0.03) and number of cores (each additional core OR 1.06, 95% CI 1.01–1.11, p = 0.03), in addition to PSA and prostate volume, which had an interactive effect on risk. The log2PSA OR corresponded to a twofold increase in PSA (7.45, 95% CI 3.58–15.47, p <0.0001), the log2volume OR was 0.57 for a twofold increase in volume (95% CI 0.47–0.69, p <0.0001) and the log2PSA × log2volume OR was 0.79 (95% CI 0.68–0.91, p = 0.001). While greater PSA was associated with increased risk, greater prostate volume was associated with decreased risk. However, the additional significant PSA-volume interaction term indicated a further decrease risk of cancer detection in men with higher prostate volume plus increased PSA, which could be attributable to inflammation. AUASS did not add independent predictive information to the risk factors in this model (p >0.05). The Appendix and figure 1 show the resulting algorithm and risk curves.
Figure 1.
PCPTRC_CLIN overall prostate cancer risk curves incorporating volume and number of cores, based on original PCPTRC and assuming white race, age 65 years, no prostate cancer family history, no prior biopsy, normal DRE, prostate volume 30, 42 and 57 cc, and 6 vs 12-core biopsy.
PCPTHG_CLIN for High Grade Prostate Cancer
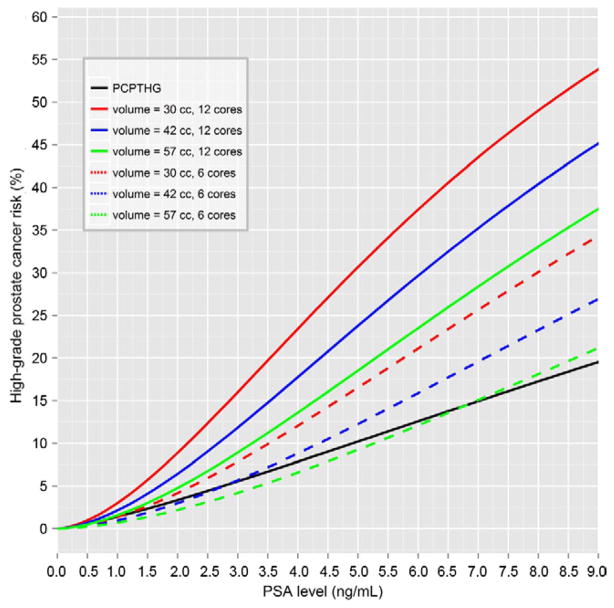
Of the 4,958 PCPT participants 232 (4.7%) had confirmed high grade prostate cancer, which entailed less power for detecting associations with risk factors than for overall prostate cancer detection. The optimal risk model for high grade prostate cancer included PSA (twofold increase in PSA OR 3.22, 95% CI 2.67–3.88, p <0.0001), DRE (abnormal DRE OR 3.06, 95% CI 1.96–4.75, p <0.0001), black race (OR 2.77, 95% CI 1.47–5.20, p = 0.002), volume (twofold volume increase OR 0.43, 95% CI 0.31–0.58, p <0.0001) and number of cores (each additional core OR 1.16, 95% CI 1.06–1.27, p = 0.001). AUASS did not add independent predictive information to the risk factors in this model (p >0.05). The Appendix and figure 2 show the resulting algorithm and risk curves.
Figure 2.
PCPTHG_CLIN high grade prostate cancer risk curves incorporating volume and number of cores vs original PCPTHG, assuming white race, age 65 years, no prostate cancer family history, no prior biopsy, normal DRE, prostate volume 30, 42 and 57 cc, and 6 vs 12-core biopsy.
PCPTRC_AUA for Prostate Cancer
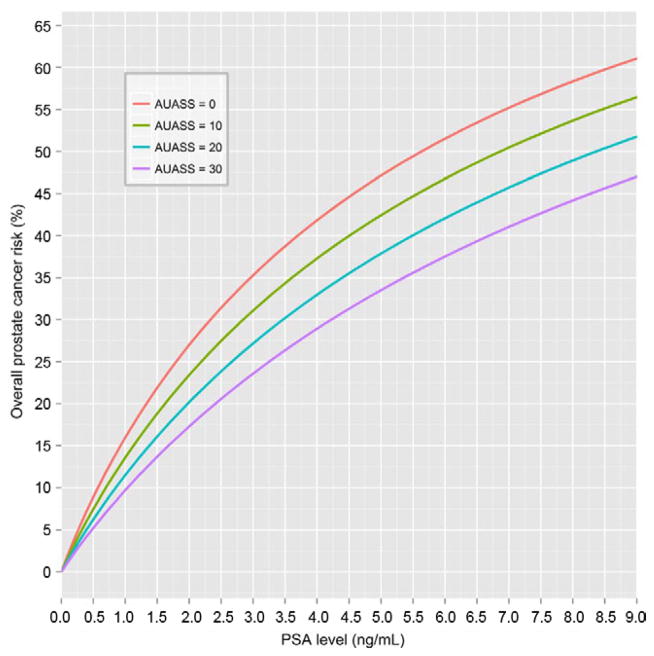
Excluding the clinical parameters prostate volume and number of cores for predicting prostate cancer but including AUASS with the previous PCPT risk factors led to the multivariable model PCP-TRC_AUA (see Appendix and fig. 3). This model had a considerable higher BIC, indicating worse fit, than PCPTRC_CLIN (4,783.78 vs 3,561.13). It included PSA (twofold PSA increase OR 1.95, 95% CI 1.81–2.09, p <0.0001), DRE (OR 2.91, 95% CI 2.35–3.60, p <0.0001), prostate cancer family history (OR 1.29, 95% CI 1.08–1.54, p = 0.006), negative biopsy history (OR 0.59, 95% CI 0.48–0.73, p <0.0001) and AUASS (1-point increase OR 0.98, 95% CI 0.97–0.99, p = 0.002).
Figure 3.
PCPTRC_AUA overall prostate cancer risk curves incorporating AUASS and assuming white race, age 65 years, no prostate cancer family history, no prior biopsy, normal DRE and AUASS 0, 10, 20 or 30.
PCPTHG_AUA for High Grade Prostate Cancer
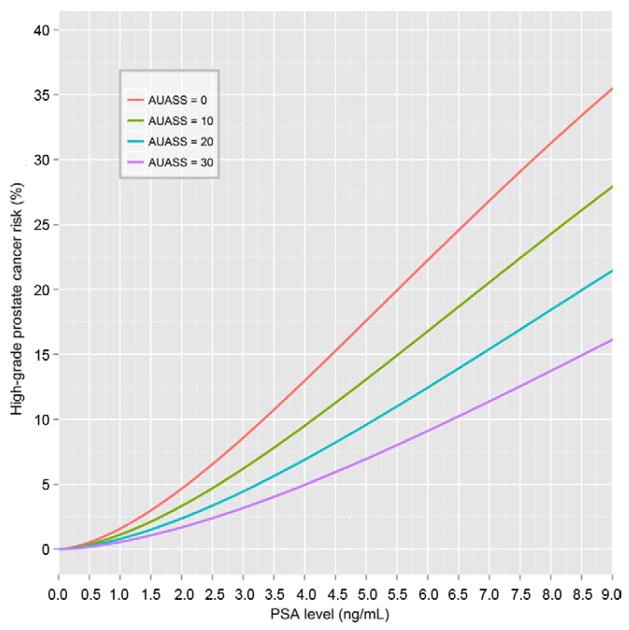
Similarly, constructing an AUASS based model for high grade disease detection led to the multivariable model PCPTHG_AUA (see Appendix and fig. 4). This model also had decreased BIC compared to PCPTHG_ CLIN (1,631.64 vs 1149.55). The optimal AUASS model included PSA (twofold PSA increase OR 3.05, 95% CI 2.60–3.58, p <0.0001), DRE (OR 3.15, 95% CI 2.22–4.45, p <0.0001), black race (OR 2.51, 95% CI 1.44–4.36, p = 0.001), history of negative biopsy (OR 0.55, 95% CI 0.37–0.81, p = 0.003), age (1-year increase OR 1.03, 95% CI 1.00–1.05, p = 0.04) and AUASS (1-point increase OR 0.97, 95% CI 0.94–0.99, p = 0.005).
Figure 4.
PCPTHG_AUA high grade prostate cancer risk curves incorporating AUASS and assuming white race, age 65 years, no prostate cancer family history, no prior biopsy, normal DRE and AUASS 0, 10, 20 or 30.
Evaluation on EDRN Data Set
When evaluated on the EDRN validation set, PCP-TRC_CLIN had a statistically significantly higher AUC than the original PCPTRC (p = 0.01) or the PCPTRC_AUA (p = 0.03). There was no difference between the latter 2 calculators (p >0.05). When using the PCPTHG for high grade disease detection, there was no statistically significant difference among the 3 calculators (figs. 5 and 6).
Figure 5.
ROC curves evaluated on EDRN data set for overall prostate cancer for PCPTRC, PCPTRC_AUA and PCPTRC_CLIN.
Figure 6.
ROC curves evaluated on EDRN dataset for high grade prostate cancer for PCPTHG, PCPTHG_AUA and PCPTHG_CLIN.
DISCUSSION
We explored the impact of prostate volume, AUASS and number of cores on prostate cancer and high grade disease detection rates in the PCPT. For prostate volume there is growing evidence that there is a greater risk of missing prostate cancer, especially high grade prostate cancer, in larger volume prostates simply due to sampling error.9 Our analysis confirms the observation that including prostate volume provides a modest benefit for predicting prostate cancer risk and it is probably best used in patients with a large prostate in whom the risk reduction is sufficiently great to no longer be favored by the patient or physician. For example, a 65-year-old man with PSA 5.0 ng/ml, no other risk factors and prostate volume 25 cc would have a predicted risk of cancer and high grade cancer of 60.6% and 20.7% for 6-core biopsy, and 68.3% and 39.0% for 12-core biopsy, respectively. If prostate volume were 90 cc, these predicted risks would decrease to 16.1% and 5.1% for 6-core biopsy, and 21.1% and 11.6%, respectively, for 12-core biopsy. We would encourage prostate volume inclusion only in patients with a palpably large prostate. Ultrasound in these men may sufficiently decrease the risk of cancer detection, such that the patient may elect to defer biopsy.
TRUS volume is not routinely assessed during clinical care but an AUASS questionnaire typically is assessed. If prostate volume were not known for the patient described but his AUASS was 0, the risk based on the AUA adjusted calculators would be 47.1% for prostate cancer and 17.6% for high grade disease. Risk would decrease significantly to 33.5% and 7.0%, respectively, if he presented with an AUASS of 30, which is often consistent with an enlarged prostate.
Our interest in the number of biopsy cores stemmed from current concerns about over detection of and subsequent overtreatment for prostate cancer in the United States.6 Contemporary biopsy schemes are based on 10 to 12 cores. However, if fewer cores maintain sensitivity for high grade disease detection, while reducing the detection of small, potentially inconsequential tumors, a minimal biopsy core strategy could decrease cost (fewer biopsy cores processed for pathological assessment) and might decrease the risk of sepsis, an increasing problem with prostate biopsy.
Our analysis of the small sample of biopsies that deviated from the PCPT 6-core protocol and were based on more cores revealed an independent association of the number of cores with prostate cancer and, more critically, with high grade disease. The conclusions of this particular analysis are limited because external factors determined whether the physician took additional cores during the procedure, that is external factors most likely linked to suspicion of high grade disease.
Limitations of our analysis are that the PCPT cohort differs in several respects from the average patient. To enter the study, participants had PSA 3.0 ng/ml or less and normal DRE. Participants were predominantly white and older than the general population. They were screened annually by required biopsy at the end of 7 years. Therefore, approximately 80% of the PSA values used to build the PCPT risk calculators were less than 3.0 ng/ml. In contrast, most existing biopsy cohorts only include PSA above this level since only these men are referred for biopsy. Nevertheless, external validations of the PCPT risk calculators on a range of international populations treated with different biopsy protocols have been more accurate than anticipated.10,11
Currently, there are more than 100 published prostate cancer nomograms/calculators, each developed on its own cohort and advocating its appropriate context and suite of optimal risk factors.12 Therefore, they return varying results for the individual.13 To predict prostate cancer on biopsy some tools unequivocally require prostate volume, while others do not and still others recommend using PSA density instead.14 Some tools, including ours, allow for the incorporation of newer markers, including percent free PSA and the urine marker PCA3. With so many prediction models now at our fingertips, our recommendation is to be guided by urologist preference, using only reputable calculators backed by published references.
CONCLUSIONS
Additional PCPT risk calculators incorporating prostate volume, AUASS and number of biopsy cores are now available on line. These calculators offer only modest improvements to the standard PCPT risk calculators.
Table 1.
Characteristics of 4,958 PCPT participants
| Neg Biopsy | Pos Biopsy | |||
|---|---|---|---|---|
| No. participants | 3,864 | 1,094 | ||
| Mean ± SD age (range) | 69.6±5.4 | (56–91) | 69.5±5.6 | (56–87) |
| No. race (%):* | ||||
| White | 3,710 | (96.0) | 1,041 | (95.2) |
| Black | 107 | (2.8) | 48 | (4.4) |
| Other | 47 | (1.2) | 5 | (0.5) |
| No. prior biopsy (%): | ||||
| Never | 3,320 | (85.9) | 944 | (86.3) |
| At least 1 | 544 | (14.1) | 150 | (13.7) |
| No. DRE (%):* | ||||
| Normal | 3,597 | (93.1) | 907 | (82.9) |
| Abnormal | 267 | (6.9) | 187 | (17.1) |
| No. family history (%):* | ||||
| No | 3,260 | (84.4) | 865 | (79.1) |
| Yes | 604 | (15.6) | 229 | (20.9) |
| Mean ± SD ng/ml (range) | 1.7±1.3 | (0.3–9.6) | 2.7±1.8 | (0.3–9.9)* |
| TRUS vol (cc): | ||||
| Mean ± SD cc (range) | 37.7±18.6 | (10.0–329.2) | 35.8±14.4 | (11.9–133.0) |
| No. unknown (%) | 726 | (18.8) | 232 | (21.2) |
| No. biopsy cores (%):* | ||||
| 1–5 | 9 | (0.2) | 15 | (1.4) |
| 6 | 2,729 | (70.6) | 750 | (68.6) |
| 7–10 | 467 | (12.1) | 150 | (13.7) |
| 11–17 | 138 | (3.6) | 48 | (4.4) |
| Unknown | 521 | (13.5) | 131 | (12.0) |
| Mean ± SD AUASS (range) | 8.7±6.0 | (0–320) | 8.5±5.7 | (0–30) |
| No. biopsy reason (%):* | ||||
| Interim or for cause | 453 | (11.7) | 432 | (39.5) |
| Study end | 3,411 | (88.3) | 662 | (60.5) |
| No. Gleason grade (%): | — | |||
| 4 or Less | 39 | (3.6) | ||
| 5 | 105 | (9.6) | ||
| 6 | 708 | (64.7) | ||
| 7 | 180 | (16.5) | ||
| 8 or Greater | 52 | (4.8) | ||
| Unknown | 10 | (0.9) | ||
p <0.05 vs negative biopsy.
Acknowledgments
Supported by Grants U01CA86402, U24CA115102 and 5P30 CA0541474-18.
Abbreviations and Acronyms
- BIC
Bayesian information criterion
- DRE
digital rectal examination
- PSA
prostate specific antigen
- TRUS
transrectal ultrasound
APPENDIX Cpt Risk Algorithms Incorporating Volume, Number of Cores and Aua Symptom Score
| PCPT Algorithms |
|---|
| Variables |
| L2PSA = log base 2 transformed PSA in ng/ml |
| DRE = 1 (suspicious for prostate cancer) vs 0 (normal) |
| PriorBiop = 1 (ever prior biopsy negative for prostate cancer) vs 0 (otherwise) |
| FamHist = 1 (prostate cancer in father, brother or son) vs 0 (otherwise) |
| AA = 1 (black) vs 0 (otherwise) |
| Age = age in years |
| L2VOL = log base 2 transformed prostate volume in cc |
| NCORES = number of biopsy cores |
| AUASS = total AUASS on 7 questions (range 0 to 35) |
| PCPTRC_CLIN: risk of any prostate cancer |
| Score = 0.663 + 2.008L2PSA + 1.408DRE + 0.231FamHist − 0.567L2VOL − 0.241L2PSA × L2VOL + 0.056NCORES |
| PCPTHG_CLIN: risk of high grade disease (Gleason grade 7 or greater) |
| Score = −.979 + 1.169L2PSA + 1.117DRE + 1.018AA − 0.855L2VOL + 0.149NCORES |
| PCPTRC_AUA: risk of any prostate cancer |
| Score = −1.661 + 0.665L2PSA + 1.067DRE + 0.254FamHist − 0.532PriorBiop − 0.019AUASS |
| PCPTHG_AUA: risk of high grade disease (Gleason grade 7 or greater) |
| Score = −5.881 + 1.115L2PSA + 1.146DRE + 0.919AA − 0.594PriorBiop + 0.027Age − 0.035AUASS |
| Risk = exp(Score)/[1 + exp(Score)] |
Footnotes
Study received institutional review board approval.
References
- 1.Thompson IM, Pauler DK, Goodman PJ, et al. Prevalence of prostate cancer among men with a prostate-specific antigen level <or = 4. 0 ng per milliliter. N Engl J Med. 2004;350:2239. doi: 10.1056/NEJMoa031918. [DOI] [PubMed] [Google Scholar]
- 2.Thompson IM, Ankerst DP, Chi C, et al. Assessing prostate cancer risk: results from the Prostate Cancer Prevention Trial. J Natl Cancer Inst. 2006;98:529. doi: 10.1093/jnci/djj131. [DOI] [PubMed] [Google Scholar]
- 3.Eyre SJ, Ankerst DP, Wei JT, et al. Validation in a multiple urology practice cohort of the Prostate Cancer Prevention Trial calculator for predicting prostate cancer detection. J Urol. 2009;182:2653. doi: 10.1016/j.juro.2009.08.056. [DOI] [PMC free article] [PubMed] [Google Scholar]
- 4.Parekh DJ, Ankerst DP, Higgins BA, et al. External validation of the Prostate Cancer Prevention Trial risk calculator in a screened population. Urology. 2006;68:1152. doi: 10.1016/j.urology.2006.10.022. [DOI] [PubMed] [Google Scholar]
- 5.Roobol MJ, Schroeder FH, Hugosson J, et al. Importance of prostate volume in the European Randomised Study of Screening for Prostate Cancer (ERSPC) risk calculators: results from the prostate biopsy collaborative group. World J Urol. 2012;30:181. doi: 10.1007/s00345-011-0804-y. [DOI] [PMC free article] [PubMed] [Google Scholar]
- 6.U.S. Preventive Services Task Force. [Accessed on July 2, 2012];Screening for Prostate Cancer. Available at http://www.uspreventiveservicestaskforce.org/prostatecancerscreening.htm.
- 7.Sokoll LJ, Sanda MG, Feng Z, et al. A prospective, multicenter National Cancer Institute Early Detection Research Network study of [-2]proPSA: improving prostate cancer detection and correlating with cancer aggressiveness. Cancer Epidem Biomarkers Prev. 2010;19:1193. doi: 10.1158/1055-9965.EPI-10-0007. [DOI] [PMC free article] [PubMed] [Google Scholar]
- 8.DeLong ER, DeLong DM, Clarke-Pearson DL. Comparing the areas under two or more correlated receiver operating characteristic curves: a nonparametric approach. Biometrics. 1988;44:837. [PubMed] [Google Scholar]
- 9.Kulkarni GS, Al-Azab R, Lockwood G, et al. Evidence for a biopsy derived grade artifact among larger prostate glands. J Urol. 2006;175:505. doi: 10.1016/S0022-5347(05)00236-3. [DOI] [PubMed] [Google Scholar]
- 10.Ankerst DP, Boeck A, Freedland SJ, et al. Evaluating the PCPT risk calculator in ten international biopsy cohorts: results from the prostate biopsy collaborative group. World J Urol. 2012;30:181. doi: 10.1007/s00345-011-0818-5. [DOI] [PMC free article] [PubMed] [Google Scholar]
- 11.Ankerst DP, Boeck A, Freedland SJ, et al. Evaluating the Prostate Cancer Prevention Trial High Grade prostate cancer risk calculator in ten international biopsy cohorts: results from the Prostate Biopsy Collaborative Group. World J Urol. doi: 10.1007/s00345-012-0869-2. Epub ahead of print April 22, 2012. [DOI] [PMC free article] [PubMed] [Google Scholar]
- 12.Vickers AJ. Prediction models: revolutionary in principle, but do they do more good than harm? J Clin Oncol. 2011;29:2951. doi: 10.1200/JCO.2011.36.1329. [DOI] [PubMed] [Google Scholar]
- 13.Vickers AJ, Cronin AM, Villers A, et al. The relationship between prostate-specific antigen and prostate cancer risk: the Prostate Biopsy Collaborative Group. Clin Cancer Res. 2010;16:4374. doi: 10.1158/1078-0432.CCR-10-1328. [DOI] [PMC free article] [PubMed] [Google Scholar]
- 14.Williams SB, Salami S, Regan MM, et al. Selective detection of histologically-aggressive prostate cancer: an early detection research network prediction model to reduce unnecessary prostate biopsies with validation in the Prostate Cancer Prevention Trial (PCPT) Cancer. 2012;118:2651. doi: 10.1002/cncr.26396. [DOI] [PMC free article] [PubMed] [Google Scholar]


