

Abstract
Keeping continuity with our previous study that revealed direct correlations between CRC metastasis and enhanced CacyBP protein levels, here we attempt to improve our understanding of the mechanisms involved within this enigmatic process. Overexpression of CacyBP (CacyBP-OE) in primary CRC cell and its knock down (CacyBP-KD) in the metastatic CRC cells revealed (through phenotypic studies) the positive impact of the protein on metastasis. Additionally, two individual 4-plex iTRAQ based comparative proteomics experiments were carried out on the CacyBP-OE and CacyBP-KD cells, each with two biological replicates. Mining of proteomics data identified total 279 (63.80% up-regulated and 36.20% down-regulated) proteins to be significantly altered in expression level for the OE set and in the KD set, this number was 328 (48.78% up-regulated and 51.22% down-regulated). Functional implications of these significantly regulated proteins were related to metastatic phenotypes such as cell migration, invasion, adhesion and proliferation. Gene ontology analysis identified integrin signaling as the topmost network regulated within CacyBP-OE. Further detection of caveolar mediated endocytosis in the top hit list correlated this phenomenon with the dissociation of integrins from the focal adhesion complex which are known to provide the traction force for cell movement when transported back to the leading edge. This finding was further supported by the data obtained from CacyBP-KD data set showing down-regulation of proteins necessary for integrin endocytosis. Furthermore, intracellular calcium levels (known to influence integrin mediated cell migration) were found to be lowered in CacyBP-KD cells indicating decreased cell motility and vice versa for the CacyBP-OE cells. Actin nucleation by ARP-WASP complex, known to promote cell migration, was also identified as one of the top regulated pathways in CacyBP-OE cells. In short, this study presents CacyBP as a promising candidate biomarker for CRC metastasis and also sheds light on the underlying molecular mechanism by which CacyBP promotes CRC metastasis.
Calcyclin-binding protein or CacyBP was identified as one of the potential candidate biomarkers for colorectal cancer (CRC)1 metastasis, in our previous study (1). This 30 kDa protein was first discovered as a binding partner of S100A6 (calcyclin) in Ehrlich ascites tumor cells from mouse brain (2) and was found to interact with S100A6 in a calcium dependent manner (3). Brain, liver, spleen, and stomach were the major organs of its distribution (4). In 2001, Matsuzawa et al. showed that, CacyBP is involved in a novel pathway for β-catenin degradation (5), suggesting a possible involvement of CacyBP in tumorigenesis, thereby opening up new directions for oncogenic research. Initially it was thought to be involved in multiple drug resistance (6, 7) associated with cancer therapy and was subsequently studied for its role in cell proliferation, tumorigenicity and invasion (8, 9) in gastric cancer cells. CacyBP was known to inhibit growth in gastric cancer and renal cell carcinoma (9, 10) and was also associated with clinical progression in breast cancer (11). However, these studies did not provide thorough knowledge on mechanistic involvement of CacyBP in corresponding biological processes. With respect to CRC research, this protein was only studied for its expression level in various stages of CRC and was known to undergo calcium dependent nuclear translocation (12). Recently we discovered that increased cellular level of CacyBP was associated with CRC metastasis (1) and our present study aims to investigate its underlying molecular mechanisms.
Considering our earlier finding, which correlates higher CacyBP levels with CRC metastasis, we have performed stable overexpression of CacyBP (CacyBP OE) on primary CRC cell HCT116 and stable knockdown of the same (CacyBP KD) on metastatic CRC cell SW620. Two nonisogenic cell lines were chosen to perform gene knock-in and knock-down studies for better representation of data to address the highly heterogenic behavior of clinical CRC. Cell migration, invasion, adhesion, and proliferation assays performed on these modified cells as a representation of their metastatic signature verified the hypothesis that CacyBP overexpression on primary cells will induce metastatic nature whereas its knockdown on metastatic cells will reduce it. Mechanistic investigation on this phenomenon was carried out by two individual proteomics (4-plex iTRAQ) experiments of the whole cell proteome from CacyBP-OE and CacyBP-KD cells. Beside the alterations in expression levels of proteins associated with cell migration, adhesion, proliferation, and invasion; integrin signaling, caveolar mediated endocytosis, and Actin nucleation by ARP-WASP complex were identified among the top hits of canonical pathways affected because of CacyBP-OE as predicted from the gene ontology analyses. Actin nucleation and polymerization is required for cell migration (13, 14) and integrin endocytosis is known to be directly associated with promotion of cell migration (15–17). An enhancement in both of these phenomena on CacyBP-OE suggested a possible mechanism behind CacyBP mediated CRC metastasis and this fact was further supported by our knockdown iTRAQ results. In addition, the fact that integrin endocytosis and cell migration process is affected by calcium sensing receptors (18, 19), was a valid reason to investigate the intracellular calcium levels in normal and modified CRC cells from different metastatic potentials that showed a reduction in intracellular Ca2+ on CacyBP-KD and an increase after CayBP-OE. Validation of proteins involved in integrin endocytosis was carried out from both OE and KD data set. In this study we demonstrate that CacyBP causes CRC cells to become more metastatic by enhancing cell migration and also propose possible mechanisms based on the proteomics results. This is the first study to report the molecular phenomenon observed in CRC metastasis and also present CacyBP as one of the promising candidate biomarkers thus opening up new windows for clinical research in CRC metastasis.
EXPERIMENTAL PROCEDURES
Generation of CacyBP Overexpression Construct
Full-length cDNA encoding human CacyBP/SIP was generated from CRC SW620 cells by RT-PCR. The specific primers for CacyBP/SIP were 5′ CCCAAGCTTGATATGGCTTCAGAAGAGCTA 3′ (sense) and 5′ CGGGATCCTCAAAATTCCGTGTCTCCTTTG 3′ (antisense) (8). The PCR product was cloned into pcDNA3.1(+) vector by restriction digestion at BamHI and HindIII sites followed by ligation reaction using T4DNA ligase (New England Biolabs, Ipswich, MA) to achieve the overexpression construct, pcDNA3.1(+) -CacyBP.
Generation of CacyBP- Knock-down Construct
The construct for CacyBP knock-down was purchased commercially from Origene (Rockville, MD). The gene specific shRNA sequence used for our study was GATGGAGACGATGATATGAAGCGAACCAT cloned into a shRNA expression vector named pGFP-V-RS.
Cell Transfection and Generation of Stable Cell Lines with CacyBP Overexpression and Knock-down
For generation of stable primary CRC cell line overexpressing CacyBP protein, HCT116 (Primary CRC cell line) was seeded in a 24-well plate with 2.4 × 10⁵ cells per well. The CacyBP sense vector [pcDNA3.1(+) -CacyBP] was cotransfected with Lipofectamine 2000 (Invitrogen) into HCT116 cells for 24 h and clones for stable overexpression were selected after 15 days of screening with G418 sulfate (800 μg/ml). Similar treatment was carried out with empty pcDNA3.1(+) vector separately, to create corresponding control cell line. The control and CacyBP overexpressed cells will be referred as HCT116-Control and HCT116-CacyBP OE respectively.
For generation of stable metastatic CRC cell line with CacyBP knock-down, SW620 (metastatic CRC cell line) was seeded in a 24-well plate with 2.4 × 10⁵ per well. The CacyBP ShRNA vector [pGFP-V-RS -Sh CacyBP] was cotransfected with Lipofectamine 2000 (Invitrogen) into SW620 cells for 24 h and clones for stable knock-down were selected after 12 days of screening with puromycin (0.8 μg/ml). Similar treatment was performed for generation of corresponding control cell lines where transfection was carried out using pGFP-V-RS vector with noneffective sequence henceforth referred to as “pGFP-V-RS- Scramble.”. The control and CacyBP knocked down cells will be referred as SW620-Scr Control and SW620-CacyBP KD respectively.
Validation of Stable Transfection by Western Blot and Immunofluorescence
Western Blot Analysis
Western blot analyses for the validation of protein expression level, were carried out as described previously (1). Primary antibody used included mouse anti- CacyBP/SIP antibody (diluted 1:30,000; Santa Cruz Biotechnology, Santa Cruz, CA), mouse anti- actin (diluted 1:4,000; BD Transduction LaboratoriesTM), mouse anti-KIF4 (diluted 1:500; Santa Cruz Biotechnology), mouse anti-clathrin (diluted 1:500; Santa Cruz Biotechnology), mouse anti-calpain (diluted 1:500; Santa Cruz Biotechnology), rabbit anti-VDAC-1 (diluted 1:500; abcam), mouse anti-nucleolin (diluted 1:2000; Santa Cruz Biotechnology), mouse anti-annexin A2 (diluted 1:1000; Santa Cruz Biotechnology), mouse anti-MARCKS (diluted 1:1000; Santa Cruz Biotechnology), and secondary antibodies were peroxidase-conjugated goat anti-mouse Igs antibody (diluted 1:5,000; BD PharminogenTM) and donkey anti- rabbit (diluted 1:5,000; Amersham Biosciences). For validation of protein expression levels from iTRAQ studies, we used two biological replicates to perform the Western blot.
Immunofluorescence Analysis
Immunofluorescence analysis was carried out as described previously (1). HCT116-Control and HCT116-CacyBP OE as well as SW620-Scr Control and SW620-CacyBP KD cells were used for staining with mouse monoclonal anti-CacyBP antibody (Santa Cruz Biotechnology; diluted 1:2000 in 1% bovine serum albumin (BSA) with PBSCM (phosphate buffered saline with 1 mm Ca++ and 1 mm Mg++)) followed by incubation with Alexa Fluor-555 conjugated rabbit anti-mouse IgG (Invitrogen) at 1:200 dilutions for 1 h each and mounted on glass slides with DAPI mounting solution (Santa Cruz Biotechnology). The immunofluorescence was analyzed under Carl Zeiss LSM 510 Meta.
Crystal Violet Cell Proliferation Assay
HCT116-Control and HCT116-CacyBP OE cells (10 × 103 cells per well) as well as SW620-Scr Control and SW620-CacyBP KD (30 × 103 cells per well) were seeded in a 24-well plate and allowed to attach overnight. After cell attachement, obseravations were made every 24 h from 0 to 72 h. Cells were fixed with 3% paraformaldehyde for 30 min and dried overnight before staining with crystal violet (0.5% in 20% methanol) for 10 min and dried overnight again. Finally cells were treated with 1% SDS for 30 min and absorbance was measured at 520 nm against a blank.
Adhesion Assay
Adhesion assay was performed as mentioned by (20) with certain modifications. Briefly, precoating of 96-well plate was performed with 10 μg/ml of fibronectin (Sigma) in PBS at 37 °C for 1 h. The wells were blocked with 0.5% BSA in culture medium and 0.1% BSA in medium was used as the washing buffer. HCT116-Control and HCT116-CacyBP OE cells as well as SW620-Scr Control and SW620-CacyBP KD cells were seeded as 20 × 103 cells per well of the 96-well plate. Images of cells under bright field after adhesion were taken using a digital compact camera (Olympus, C-7070) attached to the microscope. Absorbance was measured at 550 nm after lysing with 2% SDS.
Migration Assay
A 24-well companion plate (BD Biosciences) for transwell inserts was used to perform the cell migration assay. Briefly, the cell culture inserts were coated with 300 μl fibronectin at 4 °C overnight. HCT116-Control and HCT116-CacyBP OE cells (25 × 103) as well as SW620-Scr Control and SW620-CacyBP KD cells (40 × 103) were seeded on top of the insert with serum free media (400 μl) whereas the well at the bottom side of the insert was filled with media containing 10% fetal bovine serum (FBS) (500 μl). After a 48 h incubation in a humidified incubator at 37 °C the cells from the top part of the insert were removed using a cotton bud and the cells that migrated to the bottom part of the insert were fixed with paraformaldehyde followed by staining with crystal violet. Images for five random fields were taken and finally the absorbance was measured at 520 nm after solubilizing the dye with 1% SDS.
Invasion Assay
A 24-well companion plate (BD Biosciences) for Matrigel™ Invasion Chambers was used to perform the cell invasion assay. Briefly, the Matrigel™ Invasion Chambers were rehydrated with 500 μl of serum free media at 37 °C for 2 h. HCT116-Control and HCT116-CacyBP OE cells (25 × 103) as well as SW620-Scr Control and SW620-CacyBP KD cells (40 × 103) were seeded on the top chamber with serum free media (400 μl) whereas the well at the bottom side of the chamber was filled with media containing 10% FBS (500 μl). After 48 h incubation in a humidified incubator at 37 °C the cells from the top part of the insert were removed using a cotton bud and the cells that invaded through the matrigel were fixed with paraformaldehyde followed by staining with crystal violet. Images for five random fields were taken and finally the absorbance was measured at 520 nm after solubilizing the dye with 1% SDS.
Proteomics Sample Preparation
The samples were prepared by heating the harvested cells at 100 °C for 10 min with a lysis buffer containing 0.5 m triethylammonium bicarbonate (TEAB), pH 8.5 and 1% SDS with intermediate vortexing. The lysate was centrifuged at 12,500 × g for 1 h at 15 °C and the supernatant was stored at −80 °C until further use. Protein quantitation was performed using RCDC Protein Assay Kit (Bio-Rad); 100 μg of each sample was used for iTRAQ labeling.
iTRAQ Labeling
Two separate iTRAQ experiments were carried out with the CacyBP overexpression (OE) and knocked down (KD) sets using a pair of biological replicates in each case. iTRAQ labeling was carried out using iTRAQ Reagent 4-Plex kit (AB SCIEX) based on the manufacturer's protocol with minor modifications. A pair of HCT116-Control and HCT116-CacyBP OE whole cell lysates were labeled with iTRAQ labeling reagent 114 and 116, respectively, and likewise another pair of biological replicates of the same samples (whole cell lysate from another batch of culture of these two cell lines) were labeled with 115 and 117 iTRAQ labeling reagents, respectively. Similar labeling approach was followed for the pair of SW620-Scr Control and SW620-CacyBP KD whole cell lysate. The iTRAQ labeling workflow is clearly shown in Fig. 1. Briefly, the cell lysates were reduced with tris-(2-carboxyethyl) phosphine (TCEP), alkylated with methyl methane-thiosulfonate (MMTS), and diluted 20 times before digesting with trypsin (w/CaCl2; Promega) with a trypsin to protein ratio of 1:10 (w/w) at 37 °C for 16 h. The digested peptides were then dried and reconstituted with 0.5 m TEAB. The dried peptides were then labeled with respective isobaric tags, incubated at room temperature for 1 h before being combined.
Fig. 1.

Schematic representation of the experimental design for iTRAQ labeling showing biological replicates. In iTRAQ1, two biological replicates from HCT116-Control cells were labeled with 114 and 115 respectively, and from HCT116-CacyBP OE cells were labeled with 116 and 117 respectively. In iTRAQ2, two biological replicates from SW620-Scr Control cells were labeled with 114 and 115 respectively, and from SW620-CacyBP KD cells were labeled with 116 and 117 respectively.
Strong Cation Exchange (SCX) Chromatography
To remove all interfering substances such as dissolution buffer, organic solvents (like ethanol, acetonitrile), reducing agent (TCEP), alkylating agent (MMTS), SDS, calcium chloride, and excess iTRAQ reagents etc., strong cation exchange chromatography was carried out for the combined iTRAQ-labeled peptides using the cation exchange system provided in the iTRAQ Method Development Kit (AB SCIEX). The eluted fraction was desalted using Sep-Pak C18 cartridges (Waters), dried and then reconstituted with 100 μl of 5% acetonitrile and 0.05% formic acid for 2D LC_MS/MS analysis.
2D LC Analysis and Tandem Mass Spectrometry (MS/MS)
The first dimension peptide separation was performed using the Ultimate LC system (Dionex-LC-Packings, Sunnyvale, CA) connected to a strong cation-exchange (SCX) column. Ninety-six micrograms (via multiple injections) of the labeled peptide mixture was injected using the micro-pickup loop mode into a Zorbax Bio-SCX II column (Agilent, SantaClara, CA). SCX mobile phase A was 5% acetonitrile (ACN) and 0.05% formic acid and mobile phase B was 5% ACN, 500 mm NaCl and 0.05% formic acid . The flow rate was set at 10 μl/min. A total of 78 fractions were eluted (2 min each) and collected on a 96-well v-bottom plate using step gradients of mobile B as follows: 0% for 10 min, 0–20% for next 90 min, 20–60% for next 20 min, and 60–100% for last 10 min and continued at the same %B for another 25 min. The eluted fractions were subsequently combined to 10 and 12 fractions respectively for overexpression and knockdown iTRAQ batch and then desalted with Sep-Pak® tC18 μElution Plate (186002318, Waters Corp., Milford, MA) using a vacuum manifold (Millipore) in accordance to the manufacturer's recommendations before second-dimension reverse phase (RP) chromatography. From each fraction, 2 μg was trapped on a precolumn (200 μm × 0.5 mm) and then eluted on an analytical column (75 μm × 150 mm) for separation. Both columns were packed with Reprosil-Pur C18-AQ 3 μm 120Å phase (Eksigent, Dublin, CA). The RP mobile phase A was 98% H2O (with 0.1% formic acid) whereas RP mobile phase B was 98% ACN (with 0.1% formic acid). The peptides were separated by a linear gradient of 12–30% of mobile B in 90 min at a flow rate of 300 nl/min. The MS analysis was performed using a 5600 TripleTOF analyzer (QqTOF; AB SCIEX) in Information Dependent Mode. Precursor ions were selected across the mass range of 400–1800 m/z using 250 ms accumulation time per spectrum. A maximum of 20 precursors per cycle from each MS spectra were selected for MS/MS analyses with 100 ms minimum accumulation time for each precursor and dynamic exclusion for 15s. Tandem mass spectrometry was recorded in high sensitivity mode with rolling collision energy on and iTRAQ reagent collision energy adjustment on.
Peptide and Protein Identification
Protein identification and relative iTRAQ quantification were performed with ProteinPilot™ Software 4.2 (AB SCIEX) using the Paragon™ algorithm for the peptide identification, which was further processed by Pro GroupTM algorithm where isoform-specific quantification was adopted to trace the differences between expressions of various isoforms. The Pro Group Algorithm calculates protein ratios using only ratios from the spectra that are distinct to each protein or protein form and thus eliminates any masking of changes in expression because of peptides that are shared between proteins. User defined search parameters were as follows: (1) Sample Type: iTRAQ 4plex (Peptide Labeled); (2) Cysteine Alkylation: MMTS; (3) Digestion: Trypsin; (4) Instrument: TripleTOF 5600; (5) Special Factors: None; (6) Species: Homo sapiens; (7) ID Focus: Biological modifications; (8) Database: ipi.HUMAN.v3.87.fasta (182888 proteins searched); (9) Search Effort: Thorough; (10) FDR Analysis: Yes; (11) User Modified Parameter Files: No. For iTRAQ quantitation, the peptide for quantification was automatically selected by Pro GroupTM algorithm to calculate the reporter peak area, error factor (EF) and p value. The resulting data set was auto bias-corrected to remove any variations imparted because of the unequal mixing during the combination of different labeled samples. This software counts each modified peptide as unique one. The peak areas and the S/N ratios are extracted from the database by ProteinPilot to process the raw data to yield quantification data.
A reverse database search strategy was adopted to estimate the false discovery rate (FDR) for peptide identification. For both of our iTRAQ studies, a strict unused confidence score >1.3 was used as the qualification criteria, which corresponds to a peptide confidence level of 95%. With this filter, the corresponding false discovery rate (FDR = 0.0575% for the OE set and 0% for the KD set) was calculated from the decoy hits. The results were then exported into Microsoft Excel for manual data interpretation. Subsequently, the meaningful cutoff for up-regulation and down-regulation of proteins was finalized using a population statistics applied to the biological replicates as proposed by Gan et al. (1, 21).
Bioinformatics Analysis (Gene Ontology Study)
To better appreciate the data set generated, a protein list of significantly altered proteins was uploaded into Ingenuity Pathway Analysis (IPA) software server (http://www.ingenuity.com) and analyzed using the Core Analysis module to rank the proteins into top biological functions as well as canonical pathways involved. The reference set and parameters for Ingenuity Pathway Analysis (IPA) on a significantly altered protein list was as follows: (1) Reference set, Ingenuity Knowledge Base (Genes Only); (2) Relationship to include, Direct and Indirect; (3) Filter Summary, Consider only molecules and/or relationships where (species = Human OR Rat OR Mouse) AND (confidence = Experimentally Observed).
Intracellular Calcium Level Measurement
Cells were plated at low density and incubated overnight until attachment and 60% confluence. They were washed with PBSCM and incubated with 30 μm fluo-3AM (diluted in PBSCM) dye for 1 h. After washing out the dye with PBSCM, a 30 min interval was allowed for intracellular de-esterification of the dye before taking photographs with a Carl Zeiss LSM 510 Meta.
Statistical Analysis
Statistical analyses were conducted with GraphPad Prism 5 software. One way analysis of variance method was used to compare between HCT116, SW480 and SW620 cells (calcium level measurement), whereas comparison between HCT116-Control and HCT116-CacyBP OE as well as SW620-Scr Control and SW620-CacyBP KD (for all cell based assays) was performed using a two-tailed unpaired t test. A p value less than 0.05 was considered as statistically significant for each case. To verify whether the variations of protein abundance are significant, population statistics was applied to the iTRAQ ratios from all identified proteins to determine the meaningful fold cutoff. In short, the variation of ratios from 1 was determined and converted to the corresponding percentage variation and plotted against cumulative percentage coverage of data. Variation against 88% population coverage was considered as due to random biological effects and hence the population outside this was considered as significantly altered.
RESULTS
Our previous study (1) showed higher expression level of CacyBP in CRC metastatic cells compared with the primary cells and hence suggested possible involvement of this protein in the process of CRC metastasis. In present study, we carried out gene knock-in and knock-down experiments for CacyBP in CRC cells of different metastatic potential to investigate about the molecular mechanism through which CacyBP affects the process of CRC metastasis. Following the trend in expression level of CacyBP in our last proteomic experiment, we performed overexpression (OE) on primary CRC cell HCT116 and knock-down (KD) on metastatic CRC cell SW620.
Confirmation of Stable Overexpression and Knock-down of CacyBP in CRC Cell Lines
As mentioned in the experimental procedures, CacyBP was overexpressed in a primary CRC cell line, HCT116 and was knocked down in a metastatic CRC cell line, SW620. The expression level of CacyBP in HCT116-Control versus HCT116-CacyBP OE cells as well as SW620-Scr Control versus SW620-CacyBP KD cells were confirmed by Western blot as well as immunofluorescence (CacyBP staining was shown in red) studies (Fig. 2). Twenty-five pairs of cells were considered for the quantitative analysis (fluorescencent intensity: area) performed by the immunofluorescence study. The p value for quantitation against CacyBP staining was < 0.0001 for both OE and KD cells compared with their corresponding control cells when calculated by unpaired two tailed t test based on 25 observations from two independent experiments.
Fig. 2.

Validation of CacyBP overexpression and knock-down. A, Western blot validation of CacyBP expression level in HCT116-Control, HCT116-CacyBP OE, SW620-Scr Control and SW620-CacyBP KD cells. Actin was used as a loading control. B, Immunofluorescence analysis confirming overexpression of CacyBP in HCT116-CacyBP OE cells compared with HCT116-Control and knock-down of CacyBP in SW620-CacyBP KD cells compared with SW620-Scr Control cells. Red channel indicates CacyBP staining. C, Quantitation for fluorescent intensity for CacyBP expression level. Data represented as mean ± S.E. (n = 25) based on two independent experiments where *** indicates p < 0.0001 using two tailed unpaired t test.
CacyBP Overexpression and Knock-down Influence Cell Proliferation
Cell proliferation was monitored in the transfected cells using crystal violet staining assay that showed a reduced proliferation rate of primary HCT116 cells after CacyBP overexpression compared with the corresponding control. At the same time, an increased proliferation rate was observed on CacyBP knock-down on metastatic SW620 cells as compared with the corresponding control cell line (Fig. 3).
Fig. 3.

Effect of CacyBP expression level on cell proliferation. A, Decrease in cellular proliferation rate was observed in HCT116-CacyBP OE cells as compared with HCT116-Control cells. B, Increase in cellular proliferation rate was observed in SW620-CacyBP KD cells as compared with SW620-Scr Control cells.
CacyBP Expression has an Impact on Cellular Adhesion Characteristics
Cellular adhesion assay on trasfected cells using fibronectin as a coat, showed significant reduction in adhesion characteristics in HCT116-CacyBP OE cells as compared with HCT116-Control (Fig. 4A) whereas an increase in adhesion characteristics was observed in SW620-CacyBP KD cells when compared with SW620-Scr Control cells (Fig. 4B). Statistical significance for variation in cellular adhesion characteristics was determined using unpaired two-tailed t test between each OE/KD cells versus control cells based on nine observations from three independent experiments. The corresponding p values were <0.0001 for OE set and 0.007 for KD set respectively.
Fig. 4.

Effect of CacyBP expression level on cellular adhesion. A, Cellular adhesion was decreased in HCT116-CacyBP OE cells compared with HCT116-Control cells. B, Increase in cellular adhesion characteristics was observed in SW620-CacyBP KD cells as compared with SW620-Scr Control cells. Quantitation values for cellular adhesion was presented as mean ± S.E. (n = 9) based on three independent experiments where *** indicates p < 0.0001 and ** indicates p < 0.001 using two tailed unpaired t test.
CacyBP Affects Cell Migration
HCT116-CacyBP OE cells migrated significantly faster than HCT116-Control cells (Fig. 5A) when measured on a chemotaxis assay platform whereas migration was reduced in SW620-CacyBP KD cells compared with SW620-Scr Control cells (Fig. 5B). Statistical significance for migration characteristics was determined using unpaired two-tailed t test between each OE/KD cells versus control cells based on 10 observations from three independent experiments. The corresponding p values were 0.0029 for OE set and 0.011 for KD set respectively.
Fig. 5.

CacyBP affects cell migration. A, Cell migration was increased in HCT116-CacyBP OE cells compared with HCT116-Control cells. B, Decreased cell migration was observed in SW620-CacyBP KD cells as compared with SW620-Scr Control cells. Quantitation values for cell migration was presented as mean ± S.E. (n = 10) based on three independent experiments where * indicates p < 0.05 and ** indicates p < 0.001 using two tailed unpaired t test.
CacyBP Influences Cell Invasion
Invasion assay performed on a 24-well matrigel invasion assay chamber showed a significant increase in invasive nature for HCT116-CacyBP OE cells when compared with HCT116-Control cells (Fig. 6A), whereas SW620-CacyBP KD cells showed reduced invasion compared with SW620-Scr Control cells (Fig. 6B). Statistical significance for invasion characteristics was determined using unpaired two-tailed t test between each OE/KD cells versus control cells based on eight observations from two independent experiments. The corresponding p values were <0.0001 for OE set and 0.0175 for KD set respectively.
Fig. 6.

CacyBP has an impact on cell invasion. A, HCT116-CacyBP OE cells showed enhanced invasion as compared with HCT116-Control cells. B, Decreased cellular invasive nature was observed in SW620-CacyBP KD cells in comparison to SW620-Scr Control cells. Quantitation values for cell invasion was presented as mean ± S.E. (n = 8) based on two independent experiments where * indicates p < 0.05 and *** indicates p < 0.0001 using two tailed unpaired t test.
iTRAQ Profiling of HCT116- Control Versus CacyBP OE (OE set) and SW620-Scr Control Versus CacyBP KD (KD Set)
To understand the global proteomic alteration caused by CacyBP expression level change in CRC cell lines of different metastatic potential, protein extracts from HCT116-CacyBP OE and HCT116-Control cells (OE set) as well as SW620-CacyBP KD and SW620-Scr Control cells (KD set) were analyzed in two individual iTRAQ experiments (Fig. 1). Results of these two proteomics experiments were correlated to explain molecular phenomenon involved in CRC metastatic process. Two biological replicates for each cell line were used for labeling however analysis of the data set was performed by cross comparison between all four replicates (Replicate 1, 116:114; replicate 2, 117:114; replicate 3, 116:115, and replicate 4, 117:115). Among all the identified proteins, those having unused protein score ≥1.3 (correspond to those identified with 95% confidence against the theoretical database) were considered for further analysis. The unused protein score 1.3 corresponds to a 0.0575% global false discovery rate (global FDR) for OE set and 0% global FDR for KD set. With this filter, the iTRAQ experiment identified a total of 2335 proteins for the OE set and 2733 proteins for the KD set (Supplemental Table S9 and S10, Supporting Information). These identified proteins were then filtered using a population statistic to obtain the list of significantly altered proteins. This method aided in calculating the fold cutoff for corresponding up- or down-regulation of proteins for an individual data set. The variation between the average of four replicates (sample versus control ratios) and one was calculated and converted to the corresponding percentage variation. These percentage variations were then plotted against the cumulative percentage coverage (Fig. 7) and the variation against 88% coverage was taken into account to determine the fold cutoff considering the population outside 88% as significantly altered. Because biological variation has the highest variation with lower number of proteins covered when compared with technical or experimental replicates, fixing a cutoff with the biological variation enhances the certainty that the observed protein alteration is real and thereby eliminates the need for other types of replicates. Moreover, variation against 88% coverage of data corresponds to the cutoff for a significant population when biological replicates are considered, as reported by Gan et al. (21). Applying this method to both of our data sets; we observed about 44% variation for OE and 57% variation for KD data set corresponding to 88% coverage of data (Fig. 7). Based on this, the cutoff was fixed at 1.44-fold (44% variation) corresponding to the iTRAQ ratio of >1.44 for up-regulation and <0.69 (1/1.44) for down-regulation for the OE data set. Similarly for KD data set, the up-regulation cutoff was fixed as >1.57 and the down-regulation cut-off was fixed as <0.636 (1/1.57). These cut-off thresholds were then applied to the average of four biological replicates for both data sets. Finally, proteins that qualified these cut-off values in respective data sets were chosen as significantly altered ones. A total of 279 and 328 proteins (Supplemental Tables S1 and S2) were finally screened as significantly altered in the OE and KD data sets respectively. Out of these, 178 (63.8%) were up-regulated and 101 (36.2%) were down-regulated for the OE data set whereas 160 (48.78%) were up-regulated and 168 (51.22%) were down-regulated for the KD data set. Less than 15% of these proteins correspond to a single peptide match (supplemental Figs. S2 and S3, supplemental Tables S3 and S4).
Fig. 7.

Determination of experimental variation using all the identified proteins (Unused score > 1. 3) common in both biological replicates: The horizontal axis represents % variation of iTRAQ ratios of same protein from different biological replicate samples from 1. The primary vertical axis represents the corresponding number of proteins (bars) having different % variation. The secondary vertical axis represents the cumulative % of the counted proteins (lines). Variation against 88% coverage of population was considered for selecting cut-off. A, Corresponds to CacyBP-OE data set and B, Corresponds to CacyBP-KD data set.
Gene Ontology Study for the Significantly Altered Proteins
Gene Ontology studies using Ingenuity Pathway Analysis software classified the significantly altered proteins as per their biological functions (Table I and II) as well as ranked them as per their involvement in certain canonical pathways (Fig. 8; supplemental Fig. S1). Interestingly, integrin signaling together with caveolar mediated endocytosis were identified among the top hit list on CacyBP-OE. All integrin subunits associated with this pathway were found to be up-regulated. This phenomenon can be looked on as an enhanced endocytosis of integrins leading to increased cell migration (15, 17). Actin nucleation by ARP-WASP complex, which is known to promote cell migration, was also identified as one of the topmost pathways regulated on CacyBP-OE (13, 14).
Table I. Functional classification of the significantly altered proteins from CacyBP-OE data set. These proteins have met the criteria (i.e., unused protein score > 1.3 and change in expression level of at least 1.44-fold for HCT116-CacyBP OE vs. HCT116-Control cell) as defined in the “materials and method” as well as “results” section.
| Unused Protein score | % Sequence Coverage | Accession Number | Name | Species | Peptides (95%) | Expression pattern | iTRAQ Ratio (Mean± S.E.) |
|---|---|---|---|---|---|---|---|
| Proteins involved in cellular proliferation | |||||||
| 4.31 | 45.2 | IPI00946824.1 | FXN Uncharacterized protein | 9606 | 2 | ↓ | 0.43 ± 0.05 |
| 12.51 | 22.1 | IPI00795482.1 | STAT1 83 kDa protein | 9606 | 8 | ↑ | 2.44 ± 0.32 |
| Proteins involved in cell Migration | |||||||
| 23.1 | 17.1 | IPI00215995.1 | Isoform 1 of Integrin alpha-3 | 9606 | 18 | ↑ | 1.49 ± 0.18 |
| 14.86 | 23.9 | IPI00921401.1 | Isoform 9 of Integrin alpha-6 | 9606 | 11 | ↑ | 2.56 ± 0.04 |
| 10.99 | 24 | IPI00555991.2 | Isoform 2 of Integrin alpha-V | 9606 | 9 | ↑ | 1.89 ± 0.15 |
| 48.23 | 35.1 | IPI00220847.2 | Isoform Beta-4D of Integrin beta-4 | 9606 | 34 | ↑ | 1.47 ± 0.03 |
| 10 | 37.8 | IPI00719669.4 | Myosin regulatory light chain MRCL2 | 9606 | 5 | ↑ | 1.52 ± 0.1 |
| 4.07 | 41.6 | IPI00032313.1 | S100A4 Protein | 9606 | 2 | ↑ | 2.63 ± 0.2 |
| 12 | 73.2 | IPI00297714.2 | Gamma-synuclein | 9606 | 9 | ↑ | 2.32 ± 0.08 |
| 12.51 | 22.1 | IPI00795482.1 | STAT1 83 kDa protein | 9606 | 8 | ↑ | 2.45 ± 0.32 |
| 4 | 15.4 | IPI00219301.7 | Myristoylated alanine-rich C-kinase substrate | 9606 | 2 | ↑ | 43.71 ± 21.65 |
| 22.22 | 76.3 | IPI00219219.3 | Galectin-1 | 9606 | 33 | ↓ | 0.62 ± 0.01 |
| Proteins involved in cellular invasion | |||||||
| 4 | 5.8 | IPI01014165.1 | COL18A1 Uncharacterized protein | 9606 | 2 | ↑ | 1.83 ± 0.04 |
| 10.99 | 24 | IPI00555991.2 | Isoform 2 of Integrin alpha-V | 9606 | 9 | ↑ | 1.89 ± 0.15 |
| 48.23 | 35.1 | IPI00220847.2 | Isoform Beta-4D of Integrin beta-4 | 9606 | 34 | ↑ | 1.47 ± 0.03 |
| 4 | 15.4 | IPI00219301.7 | Myristoylated alanine-rich C-kinase substrate | 9606 | 2 | ↑ | 43.71 ± 21.65 |
| 16.4 | 49.1 | IPI00647915.1 | TAGLN2 24 kDa protein | 9606 | 13 | ↑ | 1.73 ± 0.10 |
| 6.11 | 55.3 | IPI01021488.1 | CBX5, 22 kDa protein | 9606 | 5 | ↓ | 0.54 ± 0.1 |
| Proteins engaged in cellular adhesion | |||||||
| 12.14 | 25.6 | IPI00395605.4 | ARHGEF1 Isoform 3 of Rho guanine nucleotide exchange factor 1 | 9606 | 7 | ↓ | 0.65 ± 0.07 |
| 11.89 | 29.5 | IPI00301058.5 | VASP Vasodilator-stimulated phosphoprotein | 9606 | 11 | ↓ | 0.59 ± 0.02 |
| Proteins involved in caveolar mediated endocytosis | |||||||
| 23.1 | 17.1 | IPI00215995.1 | Isoform 1 of Integrin alpha-3 | 9606 | 18 | ↑ | 1.49 ± 0.18 |
| 14.86 | 23.9 | IPI00921401.1 | Isoform 9 of Integrin alpha-6 | 9606 | 11 | ↑ | 2.56 ± 0.04 |
| 10.99 | 24 | IPI00555991.2 | Isoform 2 of Integrin alpha-V | 9606 | 9 | ↑ | 1.89 ± 0.15 |
| 48.23 | 35.1 | IPI00220847.2 | Isoform Beta-4D of Integrin beta-4 | 9606 | 34 | ↑ | 1.47 ± 0.03 |
| Proteins involved in ARP-WASP mediated actin nucleation | |||||||
| 23.1 | 17.1 | IPI00215995.1 | Isoform 1 of Integrin alpha-3 | 9606 | 18 | ↑ | 1.49 ± 0.18 |
Fig. 8.

Ingenuity Pathway Analysis for significantly altered proteins from CacyBP-OE data set. Top 6 cannonical pathways to which the significantly altered proteins are associated with (Diagram redrawn based on original output file shown in supplemental Fig. S1). Integrin signaling, caveolar mediated endocytotic signaling and actin nucleation via ARP-WASP complex were highlighted.
Relevance of iTRAQ Data Set Proteins with CRC Metastasis
To investigate CacyBP's role in the molecular events of CRC metastasis, we performed iTRAQ based proteomics analysis on whole cell lysate from CacyBP overexpressed and knocked down cells. Significantly altered proteins from both data sets (OE data set and KD data set) were classified based on their biological function as well as involvement in important canonical pathways.
Proteins from the CacyBP-OE-iTRAQ Data Set Explain CacyBP's Involvement in CRC Metastasis
Proteins Involved in Cell Proliferation
Overexpression of CacyBP on primary CRC cell line HCT116 caused up-regulation of proteins that inhibit cellular proliferation process and down-regulation of proteins that favor cell proliferation (Table I). For example, STAT1 (83 kDa protein) (22) was up-regulated whereas Frataxin (FXN) (23) was down-regulated interpreting an overall decrease in cellular proliferation rate, which is in conformity with the crystal violet assay results.
Proteins Involved in Cell Migration
An overall increase in cell migration ability was observed after CacyBP overexpression on HCT116 cells as compared with the corresponding control cells. This phenomenon can be explained by the differential expression pattern of certain proteins involved in cell migration (Table I). Up-regulation of migration facilitators such as Isoform 1 of Integrin alpha-3, Isoform 9 of Integrin alpha-6, Isoform 2 of Integrin alpha-V, Isoform Beta-4D of Integrin beta-4, Myosin regulatory light chain, S100A4 Protein, Gamma-synuclein, STAT1 protein, and MARCKS (17, 24–28) as well as down-regulation of migration inhibitors such Galectin-1 (29, 30) was observed in the OE iTRAQ data set.
Proteins Involved in Cell Invasion
Primary CRC cell HCT116 became more metastatic and hence more invasive in nature when CacyBP was overexpressed (as shown in the invasion assay). This finding is in conformity with the iTRAQ data set as we found up-regulation of proteins that have a positive impact on cellular invasion whereas down-regulation of proteins that inhibit invasion process (Table I). For example, COL18A1 protein, Isoform 2 of Integrin alpha-V, Isoform Beta-4D of Integrin beta-4, MARCKS, or Myristoylated alanine-rich protein kinase C substrate and transgelin (31–35) were found to be up-regulated. On the other hand, down-regulation of CBX5 22 kDa (36) protein was observed representing an overall increase in the invasive nature of the cells.
Proteins Involved in Cell Adhesion
Reduction in cellular adhesion characteristics on CacyBP overexpression can be correlated with the down-regulation of proteins that facilitate cellular adhesion (Table I) such as Isoform 3 of Rho guanine nucleotide exchange factor 1 and vasodilator stimulated phosphoprotein (37, 38).
Topmost Canonical Pathways Regulated on CacyBP Overexpression—Integrin Signaling, Caveolar Mediated Endocytosis and Actin Nucleation
Integrin signaling and caveolar mediated endocytosis were identified as regulated pathways among the top hits in our gene ontology analysis (Ingenuity Pathway Analysis or IPA). The proteins involved in this network were Isoform 1 of Integrin alpha-3, Isoform 9 of Integrin alpha-6, Isoform 2 of Integrin alpha-V, and Isoform Beta-4D of Integrin beta-4 all of which were up-regulated in OE-iTRAQ data set. This result showed a high possibility of increased integrin internalization via caveolar mediated endocytosis, which resulted in the ultimate increase in cell migration (15–17) caused on CacyBP overexpression (Table I). More proteins associated with this event were found to be differentially expressed in both of our iTRAQ data sets and are discussed in detail in the discussion section.
Actin nucleation by ARP-WASP complex was found to be another pathway among the hit-list and Isoform 1 of Integrin alpha-3 (up-regulated in the OE data set; Table I) was found to be associated with this pathway.
Proteins from the KD-iTRAQ Data Set Explain CacyBP's Involvement in CRC Metastasis
Proteins Involved in Cell Proliferation
The iTRAQ data set for CacyBP-KD showed overexpression of certain proteins (Table II) that were known to promote cell proliferation. These were Fos-related antigen 1 and S100A11 (39, 40), which concluded an overall increase in cell proliferation rate. Results from crystal violet assay for the measurement of cell proliferation also complied with this finding.
Table II. Functional classification of the significantly altered proteins from CacyBP-KD dataset. These proteins have met the criteria (i.e. unused protein score > 1.3 and change in expression level of at least 1.57 fold for SW620-CacyBP KD vs. SW620-Scr Control cell) as defined in the “materials and method” as well as “results” section.
| Unused Protein score | % Sequence Coverage | Accession Number | Name | Species | Peptides (95%) | Expression pattern | iTRAQ Ratio (Mean± S.E.) |
|---|---|---|---|---|---|---|---|
| Proteins involved in Cell proliferation | |||||||
| 4 | 30.6 | IPI00011590.1 | Fos-related antigen 1 | 9606 | 2 | ↑ | 2.07 ± 0.25 |
| 2 | 9.5 | IPI00013895.1 | S100A11 Protein | 9606 | 1 | ↑ | 1.72 ± 0.16 |
| Proteins involved in focal adhesion | |||||||
| 2.26 | 37.7 | IPI00018451.6 | Calcium and integrin-binding protein 1 | 9606 | 1 | ↑ | 1.70 ± 0.11 |
| 6 | 17.8 | IPI00029834.3 | Isoform 1 of Rhotekin | 9606 | 3 | ↓ | 0.31 ± 0.04 |
| 4.01 | 13.4 | IPI00014068.1 | Isoform 1 of Serine/threonine-protein kinase PAK 4 | 9606 | 3 | ↓ | 0.62 ± 0.07 |
| Proteins involved in cytoskeleton organization | |||||||
| 6 | 60.6 | IPI00791316.1 | Neuromodulin isoform 1 | 9606 | 3 | ↑ | 2.63 ± 0.25 |
| 97.37 | 68.8 | IPI00396171.4 | Isoform 1 of Microtubule-associated protein 4 | 9606 | 74 | ↑ | 1.63 ± 0.05 |
| 27.5 | 58.2 | IPI00000861.1 | Isoform 1 of LIM and SH3 domain protein 1 | 9606 | 36 | ↑ | 1.60 ± 0.04 |
| Proteins involved in integrin internalization | |||||||
| 11.39 | 23.5 | IPI00011285.1 | Calpain-1 catalytic subunit | 9606 | 7 | ↓ | 0.61 ± 0.07 |
| 8.89 | 25.9 | IPI00556059.1 | Isoform 2 of Chromosome-associated kinesin KIF4A | 9606 | 6 | ↓ | 0.37 ± 0.05 |
Proteins Involved in Cellular Assembly and Organization
Proteins involved in focal adhesion as well as maturation of intercellular junction were found to be differentially expressed on CacyBP knock-down in SW620 cells showing an overall effect of enhanced cellular adhesion (Table II). PAK4 or Isoform 1 of Serine/threonine-protein kinase PAK 4 was down-regulated in our data set explaining a more stable morphology because overexpression of this protein is related to epithelial messenchymal transition (41). On the other hand, proteins improving focal adhesion such as CIB1 or Calcium and integrin-binding protein 1 (42, 43) was up-regulated whereas RTKN or Isoform 1 of Rhotekin (44) was down-regulated providing a resultant outcome of improved cellular adhesion. Adhesion assay performed on SW620-CacyBP KD and SW620-Scr Control cells showed similar effect.
Proteins involved in cytoskeleton organization were also differentially expressed reflecting a more stable cellular backbone after CacyBP knock-down compared with the corresponding scrambled control cell line (Table II). Actin capping protein GAP43 neuromodulin isoform 1 (45) and microtubule dynamics controlling protein MAP4 or Isoform 1 of Microtubule-associated protein 4 (46) were found to be up-regulated in the KD iTRAQ data set which interprets differences in cytoskeleton organization from wild type metastatic cells. Moreover, LASP1 or Isoform 1 of LIM and SH3 domain protein 1 (47) was up-regulated in our data set and was found to be down-regulated in our previous iTRAQ study (1) when primary (SW480) versus metastatic (SW620) CRC whole cell proteome were compared. This created evidence in support of the reduced metastatic nature of SW620 cells on CacyBP knock-down.
Proteins Involved in Integrin Internalization and Calcium Signaling
Thorough screening of the KD iTRAQ data set picked up proteins related to integrin endocytosis (Table II). The expression trend of these proteins on CacyBP knock-down interpreted an effect opposite to that observed in the OE iTRAQ data set. Calpain-1 (48) and kinesin KIF4A (15–17) were down-regulated showing an overall reduction in integrin internalization and hence reduced migration of cells. Calpain-1 is a protease that is activated by intracellular calcium influx and dissociate integrins from focal adhesion complex (48). As per the data from our intracellular calcium level measurement, CacyBP-KD cells had a lower intracellular calcium level that might lead to calpain inactivation. On the other hand calcium homeostasis maintaining protein VDAC-1 was down-regulated suggesting one of the reasons behind the lower intracellular calcium (49). Additionally, isoform 2 of clathrin heavy chain 1(iTRAQ ratio 0.69) was down-regulated as verified by Western blot analysis although this protein did not appear in the screened list of differentially expressed proteins. This represents reduced endocytosis of integrins because clathrin is known to mediate endocytosis (16).
Validation of iTRAQ Data Set Proteins
Three proteins identified in the OE data set and five proteins identified in the KD data set were validated for their differential expression pattern using Western blot in all the biological replicates (two in each cell line) used for iTRAQ labeling. Annexin A2 and nucleolin were found to be down-regulated whereas MARCKS was up-regulated in CacyBP-OE cells compared with the control (Fig. 9A). This finding is in conformity with the iTRAQ results. Similarly, in CacyBP- KD cells, clathrin, kinesin, calpain, and VDAC-1 were found to be down-regulated whereas nucleolin was up-regulated compared with the corresponding control cell line, maintaining consistency with the iTRAQ data (Fig. 9B). Expression trend for low abundant protein such as MARCKS (2 peptide match) complied with the iTRAQ studies, which enhanced the reliability for the accuracy of both techniques.
Fig. 9.

Validation of iTRAQ results. A, Western-blot studies to validate differential expression pattern of 3 candidate proteins from OE data set: Annexin A2 and nucleolin were down-regulated whereas MARCKS was up-regulated in CacyBP- OE cells compared with the control cells which were in conformity with the iTRAQ results. B, Western blot validation of 5 candidate proteins from KD data set: clathrin, kinesin, calpain and VDAC-1 were found to be down-regulated whereas nucleolin was up-regulated. Actin was used as a loading control in both the cases.
Intracellular Calcium Level Measurement
Measurement of intracellular calcium abundance through the confocal microscopic method (Fluo 3AM staining showed in green channel) showed higher abundance in metastatic SW620 cells when compared with primary HCT116 and SW480 (Fig. 10A). Comparison of intracellular calcium levels between two primary cell lines (HCT116 and SW480) did not show any significant differences. Comparison was performed between HCT116-CacyBP OE and HCT116-Control cells as well as SW620-CacyBP KD and SW620-Scr Control cells. Overexpressed cells showed an increase in intracellular calcium level whereas knockdown of CacyBP resulted in a reduction in intracellular calcium level (Fig. 10B). Two-tailed unpaired t test was used to calculate statistical significance for the quantitation (fluorescencent intensity: area) between OE/KD cells versus control cells and one-way analysis of variance method was used to compare between HCT116, SW480, and SW620 cells. The p value for quantitation against intracellular calcium staining was 0.003 for OE set and <0.0001 for KD set whereas the p value for quantitation for HCT116 versus SW620 and SW480 versus SW620 was <0.05. All calculations were performed based on 20 observations from two independent experiments.
Fig. 10.
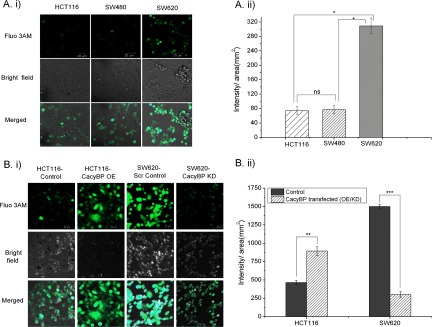
Intracellular Ca2+ level in normal and genetically modified CRC cells. A, Fluorescent image showing enhanced intracellular Ca2+ level in metastatic SW620 cells compared with primary HCT116 and SW480 cells. Statistical significance was calculated using one way analysis of variance method. B, Fluorescent image showing enhanced intracellular Ca2+ level in HCT116-CacyBP OE cells compared with HCT116-Control cells and reduced intracellular Ca2+ level in SW620-CacyBP KD cells as compared with SW620-Scr Control cells. Green channel indicates Fluo 3AM staining for intracellular calcium. Statistical significance was calculated using two tailed unpaired t test. Quantitation values for fluorescent intensity/area (mm2) were represented as mean ± S.E. (n = 20) based on two independent experiments where ns indicates not significant, * indicates p < 0.05, ** indicates p < 0.001 and *** indicates p < 0.0001.
DISCUSSION
CacyBP is a comparatively new protein candidate in oncology research. Though several studies have indicated its role in cell proliferation, tumorigenicity, and invasion for specific cancer subtypes (8), yet the underlying mechanisms involved in metastasis are not well understood. Some authors opine that CacyBP/SIP binds to Siah-1 and Skp 1 (components of ubiquitin ligase) to degrade β-Catenin (5), which is known for its capability to regulate many oncogenic signaling networks (50–52). Even then, the precise pathological role of CacyBP particularly in cancer metastasis remains unknown. We were the first to propose its contribution in CRC metastasis as observed through proteomics based experimentation (1) that subsequently lead us to investigate the detailed mechanisms as described here.
Considering that CacyBP might play a pivotal role in CRC metastasis, we performed overexpression and knock-down of the protein in (CRC) cells of different metastatic potential to confirm its complementary outcome. Two nonisogenic cell lines (Primary HCT116 and metastatic SW620) were used to perform these gene knock-in and knock-down experiments respectively, to normalize the heterogeneity exhibited by clinical CRC. Because cellular CacyBP level is enhanced in metastasis as confirmed from our previous study on metastatic and primary cells, we hypothesized that forced CacyBP expression in primary cells might develop metastatic phenotypes whereas reduced CacyBP levels might decrease the metastatic potential of a highly metastatic cell. Our experiments for cell migration, invasion, adhesion, and proliferation assays on the modified cells confirmed this hypothesis. Especially, overexpression of CacyBP on primary CRC cell, significantly increased its metastatic nature (Figs. 3 to 6). To further investigate the underlying molecular mechanisms we performed proteomics-based experiments on the overexpressed (OE) and knocked down (KD) cells. Two individual 4-plex iTRAQ experiments were carried out from the whole cell lysate of OE and KD cells and the comparison was performed against the corresponding control cells.
Proteomics data from both the data sets revealed differentially expressed proteins that are associated with different cellular processes relevant to metastasis. For instance, expression patterns of proteins identified in the OE set complied with our findings about the decreased cellular proliferation rate and adhesion characteristics as well as increased cellular migration and invasive nature on CacyBP overexpression. Decreased proliferation is known to be coupled with metastatic nature because epithelial messenchymal transition (EMT, one of the important phenomenon that happens during metastasis), is known to incorporate stem cell properties into cancer cells (53, 54). Similarly reduction in cell adhesion is also an inherent part of EMT caused by the down-regulation of cell adhesion molecules (55). Migration and invasion are required to be enhanced with increased metastatic potential to facilitate the journey of the cell through vascular path (56). However all these phenomena overlap and complement each other to turn out a successful metastasis. Gene ontology analysis with the differentially expressed protein list from the CacyBP-OE-iTRAQ data set (using Ingenuity Pathway Analysis software) identified networks associated with enhanced cell migration. Integrin signaling, caveolar mediated endocytosis and actin nucleation by ARP-WASP complex were identified among the top hits. The first two phenomena can be looked on as an enhanced integrin endocytosis following CacyBP overexpression. As per reported literature, integrin endocytosis is associated with their dissociation from the focal adhesion complex at the rear end followed by their internalization leading to two alternative fates (15): either they are transported back to the plasma membrane of the leading edge of the cell body or routed for lysosomal degradation (16). Transportation of integrins to the leading edges of the cell body provides the traction force for movement and thereby increases the cell motility (17). We found that all integrin subunits identified in our OE data set were up-regulated indicating their gathering at the leading edge that makes the cell more motile. The later one i.e. actin nucleation via ARP-WASP complex can be linked to cell protrusion formation that facilitates cell migration. Actin polymerization inducing protein WASP and protrusion formation protein Arp2/3 is directly associated with actin polymerization/de-polymerization cycle, which promotes cell migration (13, 14). From our CacyBP-OE-iTRAQ data set, up-regulation of integrin isoforms alpha-3 was found to be coupled with this phenomenon.
Simultaneously, mining of proteomics data from the KD set interpreted an overall reduction in metastatic characters as observed from expression patterns of proteins related to focal adhesion, cytoskeleton organization, and cellular proliferation. Up-regulation of proteins positively affecting cell proliferation and adhesion interpreted an increase in both whereas altered expression of several actin cytoskeleton associated proteins justified the site specific alteration in actin dynamics in a moving cell (57). Altogether, these effects represented an overall suppression in metastatic behavior and were in conformity with the results obtained from phenotypic assays. Although gene ontology analysis did not identify the integrin endocytosis process in its hit list, proteins that are essential for integrin internalization were found to be down-regulated on CacyBP knock-down. These include Clathrin heavy chain 1 (16), kinesin KIF4A, and Calpain-1 (15). Each of these proteins takes part in focal adhesion disassembly and integrin endocytosis and hence their down-regulation indicated an overall decrease in this process leading to reduced cell motility. Western blot validation further confirmed the differential expression pattern of these proteins (Fig. 9B). At the same time, up-regulation of Kinectin (although not appeared in the screened list of differentially expressed protein it possesses a high iTRAQ ratio 1.37), an integral member of focal adhesion and actin cytoskeletal assembly (58), implied intensified adherent junctions, further supporting the finding about reduction in cell motility on CacyBP knock-down.
On the other hand, integrin mediated cell migration is known to be affected by intracellular calcium (19, 48), which directed us to investigate the intracellular calcium levels in wild type and modified CRC cells. We found enhanced Ca2+ flux in metastatic SW620 compared with primary HCT116 and SW480 cells (Fig. 10A), which is in conformity with the earlier reports (18). Additionally, intracellular calcium level was increased on CacyBP overexpression whereas knock-down of CacyBP showed a reduced Ca2+ flux (Fig. 10B). This finding can be explained from our proteomics data as calcium homeostasis maintaining protein VDAC-1 (Voltage-dependent anion-selective channel protein 1) was down-regulated on CacyBP-KD (49). On the other hand, the protease calpain that breaks the linkage between integrin and actin cytoskeleton is known to be activated by intracellular calcium (Ca2+) flux (48). Therefore the reduced intracellular calcium level in CacyBP-KD cells might cause calpain inactivation, ultimately leading to impaired integrin trafficking followed by reduced cell migration.
In conclusion, this study demonstrated that changes in cellular expression level of CacyBP provide an impact on metastatic potential of CRC as confirmed from overall proteome signatures of both proteomics studies (Fig. 11). Moreover integrin signaling mediated cell migration was found to be the most highlighted phenomenon to be enhanced on CacyBP-OE and reduced on CacyBP-KD which lead us to conclude that CacyBP mediated cell migration is largely affected via integrin endocytosis in CRC. ARP-WASP mediated actin nucleation was found to be another important phenomenon as validated from both proteomics data sets. We also found a plausible role of intracellular Ca2+ flux in this process. This is the first study to shed light on the underlying mechanisms of CRC metastasis induced by CacyBP thereby opening up a new door for the diagnostic as well as therapeutic innovation of CRC metastasis. In the future CacyBP may be developed as a potentially useful diagnostic marker for CRC metastasis or it could be a target for the development of drugs to prevent or treat metastasis, which requires further validation on clinical background.
Fig. 11.

Summarizing overall findings from CacyBP-OE and CacyBP-KD iTARQ data sets. Proteins indicated in red ink represents up-regulation and those in green ink represents down-regulation. CacyBP-OE was shown to enhance overall metastatic signature whereas CayBP-KD was shown to inhibit it.
Supplementary Material
Footnotes
 This article contains supplemental Figs. S1 to S3 and Tables S1–S4, and S9–S10. Tables S5–S8 are not available online.
1 The abbreviations used are:
- CRC
- Colorectal Cancer
- FA
- focal adhesion
- SCX
- Strong cation exchange
- IPA
- Ingenuity Pathway Analysis
- FDR
- False discovery rate
- CacyBP
- Calcyclin binding protein
- OE
- Overexpression
- KD
- Knock-down
- CacyBP-OE
- CacyBP overexpressed
- CacyBP-KD
- CacyBP knocked-down.
REFERENCES
- 1. Ghosh D., Yu H., Tan X. F., Lim T. K., Zubaidah R. M., Tan H. T., Chung M. C., Lin Q. (2011) Identification of key players for colorectal cancer metastasis by iTRAQ quantitative proteomics profiling of isogenic SW480 and SW620 cell lines. J. Proteome Res 10, 4373–4387 [DOI] [PubMed] [Google Scholar]
- 2. Filipek A., Kuźnicki J. (1998) Molecular cloning and expression of a mouse brain cDNA encoding a novel protein target of calcyclin. J. Neurochem. 70, 1793–1798 [DOI] [PubMed] [Google Scholar]
- 3. Nowotny M., Bhattacharya S., Filipek A., Krezel A. M., Chazin W., Kuznicki J. (2000) Characterization of the interaction of calcyclin (S100A6) and calcyclin-binding protein. J. Biol. Chem. 275, 31178–31182 [DOI] [PubMed] [Google Scholar]
- 4. Jastrzebska B., Filipek A., Nowicka D., Kaczmarek L., Kuznicki J. (2000) Calcyclin (S100A6) binding protein (CacyBP) is highly expressed in brain neurons. J. Histochem. Cytochem. 48, 1195–1202 [DOI] [PubMed] [Google Scholar]
- 5. Matsuzawa S. I., Reed J. C. (2001) Siah-1, SIP, and Ebi collaborate in a novel pathway for β-catenin degradation linked to p53 responses. Mol. Cell 7, 915–926 [DOI] [PubMed] [Google Scholar]
- 6. Shi Y., Hu W., Yin F., Sun L., Liu C., Lan M., Fan D. (2004) Regulation of drug sensitivity of gastric cancer cells by human calcyclin-binding protein (CacyBP). Gastric Cancer 7, 160–166 [DOI] [PubMed] [Google Scholar]
- 7. Hu W., Yin F., Jin X., Fan D. (2002) Effect of human calcyclin binding protein encoding gene on development of multiple drug resistance in gastric cancer. Zhonghua zhong liu za zhi [Chinese J. Oncol. 24, 426–429 [PubMed] [Google Scholar]
- 8. Ning X., Sun S., Hong L., Liang J., Liu L., Han S., Liu Z., Shi Y., Li Y., Gong W., Zhang S., Chen Y., Guo X., Cheng Y., Wu K., Fan D. (2007) Calcyclin-binding protein inhibits proliferation, tumorigenicity, and invasion of gastric cancer. Mol. Cancer Res. 5, 1254–1262 [DOI] [PubMed] [Google Scholar]
- 9. Ning X. X., Sun S. R., Li Y., Gong W. Q., Liu L. L., Sun L., Liang J., Pang Y. L., Cheng Y., Wu K. C., Fan D. M. (2006) The effect of calcyclin binding protein on gastric cancer proliferation. Natl. Med. J. China 86, 3264–3268 [PubMed] [Google Scholar]
- 10. Sun S., Ning X., Liu J., Liu L., Chen Y., Han S., Zhang Y., Liang J., Wu K., Fan D. (2007) Overexpressed CacyBP/SIP leads to the suppression of growth in renal cell carcinoma. Biochem. Biophys. Res. Commun. 356, 864–871 [DOI] [PubMed] [Google Scholar]
- 11. Wang N., Ma Q., Wang Y., Ma G., Zhai H. (2010) CacyBP/SIP expression is involved in the clinical progression of breast cancer. World J. Surgery 34, 2545–2552 [DOI] [PubMed] [Google Scholar]
- 12. Zhai H. H., Chen X., Lu Y. Y., Wang X., Fan D. M. (2008) Expression and nucleus translocation of calcyclin binding protein in colon cancer cells. World Chinese J. Digestol. 16, 3953–3957 [Google Scholar]
- 13. Yamaguchi H., Lorenz M., Kempiak S., Sarmiento C., Coniglio S., Symons M., Segall J., Eddy R., Miki H., Takenawa T., Condeelis J. (2005) Molecular mechanisms of invadopodium formation: The role of the N-WASP-Arp2/3 complex pathway and cofilin. J. Cell Biol. 168, 441–452 [DOI] [PMC free article] [PubMed] [Google Scholar]
- 14. Kaverina I., Stradal T. E. B., Gimona M. (2003) Podosome formation in cultured A7r5 vascular smooth muscle cells requires Arp2/3-dependent denovo actin polymerization at discrete microdomains. J. Cell Sci. 116, 4915–4924 [DOI] [PubMed] [Google Scholar]
- 15. Nagano M., Hoshino D., Koshikawa N., Akizawa T., Seiki M. (2012) Turnover of focal adhesions and cancer cell migration. Int. J. Cell Biol. Available at: 10.1155/2012/310616 [DOI] [PMC free article] [PubMed] [Google Scholar]
- 16. Margadant C., Monsuur H. N., Norman J. C., Sonnenberg A. (2011) Mechanisms of integrin activation and trafficking. Current Opinion Cell Biol, 23, 607–614 [DOI] [PubMed] [Google Scholar]
- 17. Rathinam R., Alahari S. K. (2010) Important role of integrins in the cancer biology. Cancer Metastasis Rev. 29, 223–237 [DOI] [PubMed] [Google Scholar]
- 18. Bastatas L., Martinez-Marin D., Matthews J., Hashem J., Lee Y. J., Sennoune S., Filleur S., Martinez-Zaguilan R., Park S. (2012) AFM nano-mechanics and calcium dynamics of prostate cancer cells with distinct metastatic potential. Biochim. Biophys.Acta 1820, 1111–1120 [DOI] [PubMed] [Google Scholar]
- 19. Tharmalingam S., Daulat A. M., Antflick J. E., Ahmed S. M., Nemeth E. F., Angers S., Conigrave A. D., Hampson D. R. (2011) Calcium-sensing receptor modulates cell adhesion and migration via integrins. J. Biol. Chem. 286, 40922–40933 [DOI] [PMC free article] [PubMed] [Google Scholar]
- 20. Murphy LD, V. E., Tsokos M, Mickley LA, Rosen N, Bates SE. (1990) Modulation of EGF receptor expression by differentiating agents in human colon carcinoma cell lines. Cancer Commun 2, 345–355 [DOI] [PubMed] [Google Scholar]
- 21. Gan C. S., Chong P. K., Pham T. K., Wright P. C. (2007) Technical, Experimental, and Biological Variations in Isobaric Tags for Relative and Absolute Quantitation (iTRAQ). J. Proteome Res. 6, 821–827 [DOI] [PubMed] [Google Scholar]
- 22. Jiang L. J., Zhang N. N., Ding F., Li X. Y., Chen L., Zhang H. X., Zhang W., Chen S. J., Wang Z. G., Li J. M., Chen Z., Zhu J. (2011) RA-inducible gene-I induction augments STAT1 activation to inhibit leukemia cell proliferation. Proc. Natl. Acad. Sci. U. S. A. 108, 1897–1902 [DOI] [PMC free article] [PubMed] [Google Scholar]
- 23. Lu C., Schoenfeld R., Shan Y., Tsai H. J., Hammock B., Cortopassi G. (2009) Frataxin deficiency induces Schwann cell inflammation and death. Biochim. Biophys.Acta - 1792, 1052–1061 [DOI] [PMC free article] [PubMed] [Google Scholar]
- 24. Huang L., Xu Y., Cai G., Guan Z., Cai S. (2012) Downregulation of S100A4 expression by RNA interference suppresses cell growth and invasion in human colorectal cancer cells. Oncol. Reports 27, 917–922 [DOI] [PMC free article] [PubMed] [Google Scholar]
- 25. Greenwood C., Metodieva G., Al-Janabi K., Lausen B., Alldridge L., Leng L., Bucala R., Fernandez N., Metodiev M. V. (2012) Stat1 and CD74 overexpression is co-dependent and linked to increased invasion and lymph node metastasis in triple-negative breast cancer. J. Proteomics. [DOI] [PubMed] [Google Scholar]
- 26. Park I., Han C., Jin S., Lee B., Choi H., Kwon J. T., Kim D., Kim J., Lifirsu E., Park W. J., Park Z. Y., Kim D. H., Cho C. (2011) Myosin regulatory light chains are required to maintain the stability of myosin II and cellular integrity. Biochem. J. 434, 171–180 [DOI] [PubMed] [Google Scholar]
- 27. Techasen A., Loilome W., Namwat N., Takahashi E., Sugihara E., Puapairoj A., Miwa M., Saya H., Yongvanit P. (2010) Myristoylated alanine-rich C kinase substrate phosphorylation promotes cholangiocarcinoma cell migration and metastasis via the protein kinase C-dependent pathway. Cancer Sci. 101, 658–665 [DOI] [PMC free article] [PubMed] [Google Scholar]
- 28. Li M., Yin Y., Hua H., Sun X., Luo T., Wang J., Jiang Y. (2010) The reciprocal regulation of γ-synuclein and IGF-I receptor expression creates a circuit that modulates IGF-I signaling. J. Biol. Chem. 285, 30480–30488 [DOI] [PMC free article] [PubMed] [Google Scholar]
- 29. Alge-Priglinger C. S., André S., Kreutzer T. C., Deeg C. A., Kampik A., Kernt M., Schöffl H., Priglinger S. G., Gabius H. J. (2009) Inhibition of human retinal pigment epithelial cell attachment, spreading, and migration by the human lectin galectin-1. Mol. Vision 15, 2162–2173 [PMC free article] [PubMed] [Google Scholar]
- 30. Alge C. S., Priglinger S. G., Kook D., Schmid H., Haritoglou C., Welge-Lussen U., Kampik A. (2006) Galectin-1 influences migration of retinal pigment epithelial cells. Invest. Ophthalmol. Visual Sci. 47, 415–426 [DOI] [PubMed] [Google Scholar]
- 31. Gerson K. D., Shearstone J. R., Maddula V. S. R. K., Seligmann B. E., Mercurio A. M. (2012) Integrin β4 regulates SPARC protein to promote invasion. J. Biol. Chem. 287, 9835–9844 [DOI] [PMC free article] [PubMed] [Google Scholar]
- 32. Van Den Hoogen C., Van Der Horst G., Cheung H., Buijs J. T., Pelger R. C. M., Van Der Pluijm G. (2011) Integrin αv expression is required for the acquisition of a metastatic stem/progenitor cell phenotype in human prostate cancer. Am. J. Pathol. 179, 2559–2568 [DOI] [PMC free article] [PubMed] [Google Scholar]
- 33. Lee E. K., Han G. Y., Park H. W., Song Y. J., Kim C. W. (2010) Transgelin promotes migration and invasion of cancer stem cells. J. Proteome Res. 9, 5108–5117 [DOI] [PubMed] [Google Scholar]
- 34. Micallef J., Taccone M., Mukherjee J., Croul S., Busby J., Moran M. F., Guha A. (2009) Epidermal growth factor receptor variant III-induced glioma invasion is mediated through myristoylated alanine-rich protein kinase C substrate overexpression. Cancer Res. 69, 7548–7556 [DOI] [PubMed] [Google Scholar]
- 35. Jarvenpaa J., Vuoristo J. T., Savolainen E. R., Ukkola O., Vaskivuo T., Ryynanen M. (2007) Altered expression of angiogenesis-related placental genes in pre-eclampsia associated with intrauterine growth restriction. Gynecol.l Endocrinol. 23, 351–355 [DOI] [PubMed] [Google Scholar]
- 36. Thomsen R., Christensen D. B., Rosborg S., Linnet T. E., Blechingberg J., Nielsen A. L. (2011) Analysis of HP1α regulation in human breast cancer cells. Mol. Carcinogenesis 50, 601–613 [DOI] [PubMed] [Google Scholar]
- 37. Hartney J. M., Brown J., Chu H. W., Chang L. Y., Pelanda R., Torres R. M. (2010) Arhgef1 regulates α5β1 integrin-mediated matrix metalloproteinase expression and is required for homeostatic lung immunity. Am. J. Pathol. 176, 1157–1168 [DOI] [PMC free article] [PubMed] [Google Scholar]
- 38. Kris A. S., Kamm R. D., Sieminski A. L. (2008) VASP involvement in force-mediated adherens junction strengthening. Biochem. Biophys. Res. Commun. 375, 134–138 [DOI] [PMC free article] [PubMed] [Google Scholar]
- 39. Hao J., Wang K., Yue Y., Tian T., Xu A., Xiao X., He D. (2012) Selective expression of S100A11 in lung cancer and its role in regulating proliferation of adenocarcinomas cells. Mol. Cell. Biochem. 359, 323–332 [DOI] [PubMed] [Google Scholar]
- 40. Pennanen P. T., Sarvilinna N. S., Toimela T., Ylikomi T. J. (2011) Inhibition of FOSL1 overexpression in antiestrogen-resistant MCF-7 cells decreases cell growth and increases vacuolization and cell death. Steroids 76, 1063–1068 [DOI] [PubMed] [Google Scholar]
- 41. Wallace S. W., Durgan J., Jin D., Hall A. (2010) Cdc42 regulates apical junction formation in human bronchial epithelial cells through PAK4 and Par6B. Mol. Biol. Cell 21, 2996–3006 [DOI] [PMC free article] [PubMed] [Google Scholar]
- 42. Kostyak J. C., Naik M. U., Naik U. P. (2012) Calcium- and integrin-binding protein 1 regulates megakaryocyte ploidy, adhesion, and migration. Blood 119, 838–846 [DOI] [PMC free article] [PubMed] [Google Scholar]
- 43. Naik M. U., Naik U. P. (2003) Calcium- and integrin-binding protein regulates focal adhesion kinase activity during platelet spreading on immobilized fibrinogen. Blood 102, 3629–3636 [DOI] [PubMed] [Google Scholar]
- 44. Nagata K. I., Ito H., Iwamoto I., Morishita R., Asano T. (2009) Interaction of a multi-domain adaptor protein, vinexin, with a Rho-effector, Rhotekin. Med.l Mol. Morphol. 42, 9–15 [DOI] [PubMed] [Google Scholar]
- 45. Bolsover S. R. (2005) Calcium signalling in growth cone migration. Cell Calcium 37, 395–402 [DOI] [PubMed] [Google Scholar]
- 46. Matsushima K., Tokuraku K., Hasan M. R., Kotani S. (2012) Microtubule-associated protein 4 binds to actin filaments and modulates their properties. J. Biochem. 151, 99–108 [DOI] [PubMed] [Google Scholar]
- 47. Khurana T., Khurana B., Noegel A. A. (2002) LIM proteins: Association with the actin cytoskeleton. Protoplasma 219, 1–12 [DOI] [PubMed] [Google Scholar]
- 48. Leitinger B., McDowall A., Stanley P., Hogg N. (2000) The regulation of integrin function by Ca2+. Biochimica et Biophysica Acta - Mol. Cell Res. 1498, 91–98 [DOI] [PubMed] [Google Scholar]
- 49. Rostovtseva T. K., Bezrukov S. M. (2012) VDAC inhibition by tubulin and its physiological implications. Biochim. Biophys. Acta 1818, 1526–1535 [DOI] [PMC free article] [PubMed] [Google Scholar]
- 50. Sangkhathat S., Kusafuka T., Miao J., Yoneda A., Nara K., Yamamoto S., Kaneda Y., Fukuzawa M. (2006) In vitro RNA interference against β-catenin inhibits the proliferation of pediatric hepatic tumors. Int. J. Oncol. 28, 715–722 [PubMed] [Google Scholar]
- 51. Lowy A. M., Clements W. M., Bishop J., Kong L., Bonney T., Sisco K., Aronow B., Fenoglio-Preiser C., Groden J. (2006) β-catenin/Wnt signaling regulates expression of the membrane type 3 matrix metalloproteinase in gastric cancer. Cancer Res. 66, 4734–4741 [DOI] [PubMed] [Google Scholar]
- 52. Mezhybovska M., Wikström K., Öhd J. F., Sjölander A. (2006) The inflammatory mediator leukotriene D4 induces β-catenin signaling and its association with antiapoptotic Bcl-2 in intestinal epithelial cells. J. Biol. Chem. 281, 6776–6784 [DOI] [PubMed] [Google Scholar]
- 53. Polyak K., Weinberg R. A. (2009) Transitions between epithelial and mesenchymal states: Acquisition of malignant and stem cell traits. Nat. Rev. Cancer 9, 265–273 [DOI] [PubMed] [Google Scholar]
- 54. Mani S. A., Guo W., Liao M. J., Eaton E. N., Ayyanan A., Zhou A. Y., Brooks M., Reinhard F., Zhang C. C., Shipitsin M., Campbell L. L., Polyak K., Brisken C., Yang J., Weinberg R. A. (2008) The Epithelial-Mesenchymal Transition Generates Cells with Properties of Stem Cells. Cell 133, 704–715 [DOI] [PMC free article] [PubMed] [Google Scholar]
- 55. Mitra S. K., Hanson D. A., Schlaepfer D. D. (2005) Focal adhesion kinase: In command and control of cell motility. Nat. Rev. Mol. Cell Biol. 6, 56–68 [DOI] [PubMed] [Google Scholar]
- 56. Geiger T. R., Peeper D. S. (2009) Metastasis mechanisms. Biochim. Biophys. Acta - Reviews on Cancer 1796, 293–308 [DOI] [PubMed] [Google Scholar]
- 57. Mofrad M. R. K., Kamm R. D. (2006) Cytoskeletal Mechanics, Cambridge University Press [Google Scholar]
- 58. Zhang X., Tee Y. H., Heng J. K., Zhu Y., Hu X., Margadant F., Ballestrem C., Bershadsky A., Griffiths G., Yu H. (2010) Kinectin-mediated endoplasmic reticulum dynamics supports focal adhesion growth in the cellular lamella. J. Cell Sci. 123, 3901–3912 [DOI] [PMC free article] [PubMed] [Google Scholar]
Associated Data
This section collects any data citations, data availability statements, or supplementary materials included in this article.