

Abstract
Endothelial cell caveolar-rafts are considered functional platforms that recruit several pro-angiogenic molecules to realize an efficient angiogenic program. Here we studied the differential caveolar-raft protein composition of endothelial colony-forming cells following stimulation with VEGF, which localizes in caveolae on interaction with its type-2 receptor. Endothelial colony-forming cells are a cell population identified in human umbilical blood that show all the properties of an endothelial progenitor cell and a high proliferative rate. Two-dimensional gel electrophoresis analysis was coupled with mass spectrometry to identify candidate proteins. The twenty-eight differentially expressed protein spots were grouped according to their function using Gene Ontology classification. In particular, functional categories relative to cell death inhibition and hydrogen peroxide metabolic processes resulted enriched. In these categories, Peroxiredoxin-2 and 6, that control hydrogen peroxide metabolic processes, are the main enriched molecules together with the anti-apoptotic 78 kDa glucose regulated protein. Some of the proteins we identified had never before identified as caveolar-raft components. Other identified proteins include calpain small subunit-1, known to mediates angiogenic response to VEGF, gelsolin, which regulates stress fiber assembly, and annexin A3, an angiogenic mediator that induces VEGF production. We validated the functional activity of the above proteins, showing that the siRNA silencing of these resulted in the inhibition of capillary morphogenesis. Overall, our data show that VEGF stimulation triggers the caveolar-raft recruitment of proteins that warrant a physiological amount of reactive oxygen species to maintain a proper angiogenic function of endothelial colony-forming cells and preserve the integrity of the actin cytoskeleton.
On recruitment from bone marrow, endothelial progenitor cells (EPCs)1 are involved in adult neovascularization, a process referred to as “postnatal vasculogenesis” (1, 2). In a way similar to mature endothelial cells (ECs), EPCs form endothelial colonies in vitro, migrate and differentiate into tubular-like structures, showing at the same time a high proliferation potential, which is uncommon for mature ECs. For this reason, EPCs have been intensively investigated as a source of cells potentially able to produce a more efficient revascularization with respect to mature ECs.
We have previously shown (3) that vascular endothelial growth factor (VEGF)-dependent angiogenesis by endothelial colony forming cells (ECFCs), a particular subset which recapitulates all the characteristics of EPCs coupled with a particularly high proliferation potential (4, 5), requires localization of the full-length form of the urokinase plasminogen activator receptor (uPAR) in caveolar-rafts. uPAR is critical in angiogenesis because it is involved both in urokinase plasminogen activator (uPA)-mediated ECM degradation and uPAR-dependent cell adhesion (6). VEGF stimulates a caveolar-raft redistribution of uPAR coupled with inhibition of EPC production of matrix-metalloproteinase-12 (MMP12) (3), the main enzyme responsible for cleavage of uPAR between its domain 1 and 2. Such a cleavage deprives uPAR of its angiogenesic properties by elimination of its domain-1-uPA-binding ability and by loss of uPAR integrity, which is required in order for uPAR to retain its domain-2/3 affinity for vitronectin (VN) and EC membrane integrins (7). In ECFCs uPAR, a typical glycosyl-phosphatidyl-inositol (GPI)-anchored protein, preferentially partitions on caveolar-rafts. Lipid-rafts are dynamic microdomains of the cell membrane, rich in cholesterol, sphingolipids and glycolipids, trans-membrane protein receptors, integrins and a large number of signaling molecules (8).
Caveolar-raft microdomains (also referred to as caveolae) are functionally and morphologically distinct forms of lipid-raft microdomains characterized by the presence of the protein caveolin-1. They are particularly abundant in ECs, playing a fundamental role in their function (9). VEGF localizes in caveolar-raft microdomains on interaction with its type-2 receptor (VEGFR2), thus providing a “functional platform,” together with other signaling molecules, involved in angiogenesis (10, 11). Thus, the overall emerging picture clearly indicates that the angiogenesis activity of VEGF involves a coordinated sequence of events taking place on caveolar-raft microdomains.
To identify candidate proteins whose occurrence in ECFC caveolar-raft microdomains was modified by VEGF, we performed a proteomic analysis coupled with mass spectrophotometry of caveolar-rafts, before and after VEGF stimulation. We identified 28 protein spots, including several proteins endowed with anti-apoptotic functions and involved in stress response. Our observations offer new insights into how changes in protein caveolar-raft microdomain organization may affect prosurvival pathways, giving further support to the concept of caveolar-rafts as “floating islands of death or survival” (12).
EXPERIMENTAL PROCEDURES
Cell Isolation, Culture Conditions, and VEGF Treatment
EPCs were isolated from > 50 ml human umbilical cord blood (UCB) of healthy newborns, essentially as described (3, 5, 13). The selected cord blood units had a total of < 1.3 × 10⁹ nucleated cells (threshold of suitability for the banking established by the Umbilical Cord Bank of Careggi, Firenze, Italy) Blood samples were taken after maternal informed consent and was in compliance with Italian legislation. UCB was diluted 1:1 with Hank's balanced salt solution (HBSS, EuroClone) and was overlaid on an appropriate volume of density gradient separation medium (Lympholyte®, CEDARLANE). Centrifugation, resuspension, and seeding of EPCs on gelatin-coated tissue culture plates, were performed according to a previously described protocol, until EPC colonies appeared in cell cultures after 2–3 weeks, as circumvented monolayers of cobblestone-like cells. These cells were referred to as ECFCs, as previously described (3, 5). The colonies were mechanically picked from the original plate and seeded onto another gelatin coated well with EGM-2 10% fetal bovine sera (FBS) for expansion. ECFCs were analyzed for the expression of surface antigens (CD45, CD34, CD31, CD105, ULEX, vWF, KDR, and uPAR) by flow-cytometry procedures, as described (3). ECFCs were cultured in complete Endothelial cells Growth Medium (EGM-2, Lonza), supplemented with 10% FBS (Hyclone) and 5IU/ml heparin (3). Experiments involving VEGF stimulation (50 ng/ml) were performed with semiconfluent ECFC monolayers previously washed with Hank's balanced salt solution and supplemented with EGM-2 and 2%fetal calf serum (FCS). To prepare caveolar-raft microdomains, ECFCs were challenged with VEGF for 12 h. All the experiments were performed with ECFCs within the tenth passage in culture.
Isolation and Characterization of ECFC Membrane Caveolar-rafts
Isolation of caveolar-raft fractions from ECFC lysates (control ECFCs and ECFCs stimulated for 12 h with 50 ng/ml VEGF) was performed using the Caveolae/Rafts isolation kit of Sigma, based on separation on an OptiPrep density gradient, according to the manufacturer's instruction (3). As previously described (3), caveolar-raft and nonraft fractions were determined by Western blotting with anti-Caveolin-1 antibodies and anti-Flotillin-1 antibodies (both from Sigma) for caveolar fractions (fractions 2–6). Anti-integrinβ1 antibodies (Santa Cruz Biotechnology, Santa Cruz, CA) were used to identify detergent-soluble (DS) nonraft fractions (fractions 7–9). In the present work we used ECFC preparations obtained from 3 different newborns. Each population was expanded until an average amount of 200 μg of caveolar-raft-associated proteins were obtained after five different density gradient separations for each UCB sample.
Solubilization of Caveolar-raft Microdomain Proteins
Lyophilized caveolar-raft proteins were solubilized as previously described (14). Briefly, caveolar rafts were lysed in modified lysis buffer formed by 9 m urea, 2 m thiourea, 100 mm dithiotreitol, 2% CHAPS, 60 mm n-octyl-β—d-glucopyranoside, protease inhibitor mixture (Sigma), and 2% IPG buffer, pH4–7 (GE Healthcare). Samples were vortexed for 20 min and bath-sonicated for 30 min. After centrifugation at 14,000 rpm the supernatant was recovered. Proteins quantification was performed using the Bradford method.
Two-dimensional Electrophoresis
Isoelectric focusing (first dimension) was carried out on nonlinear wide-range immobilized pH gradients (pH 4.0–7; 18 cm long IPG strips (GE Healthcare) and achieved using the Ettan™ IPGphor™ system (GE Healthcare). Analytical-run IPG strips were rehydrated with 40 μg of total protein in 350 μl of lysis buffer for 1 h at 0 V and for 8 h at 30 V, at 20 °C. The strips were focused at 20 °C according to the following conditions: 200 V for 1 h, from 300 V to 3500 V for 30 min, 3500 V for 3 h, from 3500 V to 8000 V in 30 min, and 8000 V until a total of 80,000 V/h was reached. After focusing, analytical IPG strips were equilibrated for 12 min in 6 m urea, 30% glycerol, 2% SDS, 2% DTT in 0.05 m Tris-HCl buffer, pH 6.8, and subsequently for 5 min in the same urea/SDS/Tris buffer solution, where DTT was substituted with 2.5% iodoacetamide. The second dimension was carried out on 9–16% polyacrylamide linear gradient gels (18 cm × 20 cm × 1.5 mm) at 10 °C and 40 mA/gel constant current until the dye front reached the bottom of the gel. Analytical gels were stained with ammoniacal silver nitrate (15) as previously described. Six hundred micrograms of sample were used for preparative purposes and gels were stained with colloidal Coomassie (16).
Images Analysis
The silver stained gels were acquired with an Epson expression 1680 PRO scanner. For each condition, three biological replicates and two analytical replicates were performed and only the spots present in all the replicates were taken into consideration for subsequent analysis. Computer-aided 2D image analysis was carried out using Image-Master 2-DE Platinum software version 6.0 (GE Healthcare). The relative spot volume calculated as %V (V single spot/V total spots, where V = integration of OD over the spot area) was used for quantitative analysis to decrease experimental error. The normalized %V of the spots on replicate 2D gels was averaged and standard deviation was calculated for each condition. A two-tiled nonpaired Student's t test was performed to select significant differences. A fold change of 1.7 was then chosen as threshold of expression variation.
Mass Spectrometry Analysis
Protein identification was carried out by peptide mass fingerprinting on an Ultraflex III MALDI-TOF/TOF mass spectrometer (BrukerDaltonics) equipped with a 200 Hz smartbeam™ I laser. After visualization by colloidal Comassie staining protocol, spots were mechanically excised, destained in 2.5 mm ammonium bicarbonate and 50% (v/v) acetonitrile and finally dehydrated in acetonitrile. They were then rehydrated in trypsin solution and in-gel protein digestion was performed by overnight incubation at 37 °C. From each protein digest 0.75 μl were spotted onto the MALDI target and allowed to air dry at room temperature. Then, 0.75 μl of matrix solution (saturated solution of α-cyano-4-hydroxycinnamic acid in 50% (v/v) acetonitrile and 0.5% (v/v) trifluoroacetic acid) was applied to the sample and crystallized by air drying at room temperature for 5 min. MS analysis was performed in the positive reflector mode according to defined parameters, as follows: 80 ns of delay; ion source 1: 25 kV; ion source 2: 21.75 kV; lens voltage: 9.50 kV; reflector voltage: 26.30 kV; and reflector 2 voltage: 14.00 kV. The applied laser wavelength and frequency were 353 nm and 100 Hz, respectively, and the percentage was set to 46%. Final mass spectra were produced by averaging 1500 laser shots targeting five different positions within the spot. Spectra were acquired automatically and the Flex Analysis software version 3.0 (Bruker) was used for their analysis and for the assignment of the peaks. The applied software generated a list of peaks up to 200, using a signal-to-noise ratio of 3 as threshold for peak acceptance. Recorded spectra were calibrated using, as internal standard, peptides arising from trypsin autoproteolysis. The mass lists were filtered for contaminant removal: mass matrix-related ions, trypsin autolysis and keratin peaks. Protein identification by Peptide Mass Fingerprint search was performed using the on-line-available search engine MASCOT (Matrix Science, London, UK, http://www.matrixscience.com) through the UniProtKB database. Taxonomy was limited to Homo sapiens, a mass tolerance of 100 ppm was allowed, and the number of accepted missed cleavage sites was set to one. Alkylation of cysteine by carbamidomethylation was considered a fixed modification, whereas oxidation of methionine was considered as a possible modification. The criteria used to accept identifications included the extent of sequence coverage, the number of matched peptides, and a probabilistic score at p < 0.05.
Protein spot digests were also subjected to tandem MS analysis on the Ultraflex III MALDI-TOF/TOF instrument and several protein identifications were confirmed by MS/MS sequencing of selected peptides. Two to three peptide mass fingerprinting peaks showing a high intensity were CID fragmented using Argon as collision gas. Accelerating voltages for ion sources 1 and 2 were 8.00 kV and 7.15 kV, respectively, whereas reflector 1 and reflector 2 voltages were respectively set to 29.50 kV and 14 kV with Lift 1 and Lift 2 set to 19 kV and 2.80 kV, respectively. Lens voltage was 3.60 kV. Fragmented ions were analyzed using the Flex Analysis software v.3.0 and the MS/MS database searching was carried out in the UniProtKB database using the on-line-available MASCOT MS/MS ion search software. Taxonomy was limited to Homo sapiens, peptide precursor charge was set to +1, mass tolerance of ±1.2 Da for precursor peptide and ±0.6 Da for fragment peptides were allowed, and the number of accepted missed cleavage sites was set to one. Alkylation of cysteine by carbamidomethylation was assumed as fixed modification, whereas oxidation of methionine was considered as a possible modification. We judged significant peptides with individual ion scores p < 0.05.
Protein Molecular Functional Clustering and GO Enrichment
Proteins were grouped according to their function using GO classification. Database for Annotation, Visualization and Integrated Discovery (DAVID bioinformatics, david.abcc.ncifcrf.go) (17) resources was used to find significantly enriched biological processes. Fisher's exact test was used to check for significant over-representation (p < 0.05) of GO terms in the differentially expressed protein list against the Homo sapiens genome. Biological processes were considered significant if the p value was ≤ 0.05. Furthermore Benjamini multiple testing was performed to globally correct the p value controlling family-wide false discovery rate (p value ≤ 0.1).
RT-PCR Analysis
Selected genes were evaluated before and after 4 h of VEGF challenge (50 ng/ml) of semiconfluent ECFCs. Total RNA was prepared using Nucleospin RNA II (Macherey-Nagel, Germany), agarose gel checked for integrity, and reverse transcribed with iScript cDNA Synthesis Kit (Bio-Rad, Hercules, CA) using random primers according to manufacturer's instructions. Quantitative Real-Time (RT)–PCR was performed with an Applied Biosystem 7500 Fast Real Time PCR System (Applied Biosystems, Milano, Italy) using a SYBR Green based detection (SYBR Green Master mix; Applied Biosystems) with the default PCR setting: 40 cycles of 95 °C for 15 s and of 60 °C for 60 s . Primers (IDT, TemaRicerca, Italy) used for RT-PCR were as follows:
18S-rRNA: sense, 5′-CCAGTAAGTGCGGGTCATAAG-3′, and antisense, 5′-GCCTCACATAACCATCCAATC-3′;
PRDX2: sense, 5′-GTCCCTCGCCAGATCACTGTT-3′, and antisense, 5′-CATGCTCGTCTGTGTACTGGA-3′;
PRDX6: sense, 5′- TCA TGG GGC ATT CTC TTC TC- 3′, and antisense, 5′-TCTTCTTCACGGATGGTTGG-3′;
ANXA3: sense, 5′-TCAAGGCAAAGGTGGGATATC-3′, and antisense 5′-CCTCTCAGTCAGAATGCTGAT-3′;
GRP78: sense, 5′-GACATCAAGTTCTTGCCGTT-3′, and antisense, 5′-CTCATAACATTTAGGCCAGC-3′;
CAPNS1: sense 5′-ACCCACTCCGTAACCTC-3′, and antisense, 5′-GGGTAGCAACCGTGAA-3′
The “Delta-delta method” was used for comparing relative gene expression results. Expression of target genes was normalized to 18S rRNA used as the calibrator and “fold-change” is relative to control RNA.
Western Blot Analysis
Aliquots of caveolar-raft preparations (prepared from control ECFCs and from ECFCs stimulated 12 h with 50 ng/ml VEGF) were subjected to Western blot analysis, as described (3, 18). The primary antibody was: anti-caveolin-1 (1:1000) (C3237, rabbit polyclonal antibody, Sigma) and anti-Flotillin-1 (1:1000) (F1180, rabbit polyclonal antibody, Sigma) for raft fractions and anti-integrinβ1 antibodies (1:1000) (Santa Cruz Biotechnology) for nonraft fractions. After incubation with horseradish peroxidase (HRP)-conjugated anti-rabbit IgG (1:5,000) for 1 h (Amersham Biosciences), immune complexes were detected with the enhanced chemiluminescence detection system (Amersham Biosciences). The membranes were exposed to autoradiographic films (Hyperfilm MP; Amersham Biosciences) for 1–30 min. For uPAR detection, two dimensional electrophoresis was performed as previously described (3). After running, gels were blotted overnight on polyvinylidene fluoride (PVDF) membrane. The PVDF membranes were incubated over night at 4 °C with the primary antibody solution consisting of a 1:1,000 dilution of the anti-uPAR antibody (Santacruz) in phosphate-buffered saline (PBS) containing 3.0% nonfat dry milk. After washing with PBS, 0.1% (v/v) Tween, the blots were incubated with the goat anti-rabbit IgG/HRP conjugate (1:5,000 dilution in PBS/Milk) for 1 h at room temperature. Protein extracts from whole ECFC lysates and from caveolar-raft microdomain fraction (ranging from 20 to 70 μg) were separated by 12% SDSPAGE and transferred onto a PVDF membrane (Millipore). The relative amount of calpain small subunit-1, peroxiredoxin-2, peroxiredoxin-6, annexin-A3, 78 kDa glucose-regulated protein (GRP78) protein was assessed by Western-blot with appropriate antibodies (1:1000) (GeneTex). The intensity of the immunostained bands were normalized for the total protein intensities measured by Coomassie brilliant blue R-250 from the same blot or for the intensity of β-tubulin band. The images were subjected to densitometric analysis performed using Quantity One Software (Bio-Rad). Statistical analysis of the data was performed by Student's t test; p values < 0.05 were considered statistically significant.
siRNA Treatment
Specific silencing of selected genes was performed by transfection of ECFCs with small-interfering-RNA (siRNA) obtained from Riboxx Life Sciences/Euroclone (IBONI siRNA-pool, each pool targeting a single protein: human PRDX2, PRDX6, ANXA3, GRP78, and CAPNS1, respectively), according to the manufactures' s instruction, as previously described (3). Not-targeting RNA constructs were used as negative control. To validate gene silencing, the relevant mRNA levels were determined by a quantitative Real-Time (RT)–PCR, as described previously.
Capillary Morphogenesis Assay
In vitro capillary morphogenesis was performed as described (3), in tissue culture wells coated with Matrigel. ECFCs were plated (60 × 103/well) in complete EBM-2 medium, supplemented with 2% FCS and incubated at 37 °C, 5% CO2. Some experiments were performed under VEGF stimulation (50 ng/ml). Plates were photographed at 6 h and at 24 h. Results were quantified by measuring the percentage of the photographic field occupied by endothelial cell capillary projections by image analysis. Six to nine photographic fields from three plates were scanned for each point. Results were expressed as percent field occupancy with respect to control taken as 100% ± S.D.
Immunoflurescence
Immunofluorescence was performed as previously described (1). ECFCs were grown on coverslips in EGM-2 10% fetal bovine serum. Once at confluence, TRITC-labeled phalloidin (P1951, Sigma) was applied to the cells to visualize the arrangement of actin cytoskeleton. Nuclei were stained with the fluorescent Hoechst 33342 dye (10 μg/ml) (Invitrogen) for 15 min at RT. The coverslips containing the labeled cells were mounted with an anti-fade mounting medium (Biomeda, Foster City, CA) and observed under a Bio-Rad MRC 1024 ES Confocal Laser Scanning Microscope (Bio-Rad, Hercules, CA) equipped with a 15 mW Krypton/Argon laser source for fluorescence measurements. The cells were examined with a Nikon Plan Apo X60-oil immersion objective using an excitation wavelength appropriate for Alexa 488 (495 nm). Series of optical sections (XY: 512 × 512 pixels) were then taken through the depth of the cells with a thickness of 1 μm at intervals of 0.8 μm (Z step). A single composite image was obtained by superimposition of twenty optical sections for each sample observed. The collected images were analyzed by ImageJ software.
Statistical Analysis
Results are expressed as means ±S.D. Multiple comparisons were performed by the Student test. Statistical significances were accepted at p < 0.05.
RESULTS
Comparative Proteomic Analysis of Membrane Caveolar-raft Microdomains Fraction from Control and VEGF Treated Cells
To evaluate whether the VEGF treatment of ECFCs can induce a rearrangement of membrane caveolar-raft microdomains, proteins were separated by 2-DE as described in Materials and Methods. The proteins were separated and resolved in all areas of the gels. An average of 1120 ± 130 spots (control) and 1464 ± 160 spots (VEGF stimulation) were detected on silver-stained gels using ImageMaster 2D Platinum software, version 6.0. Three biological replicas were performed. Each protein sample was run in duplicate to obtain statistically significant results.
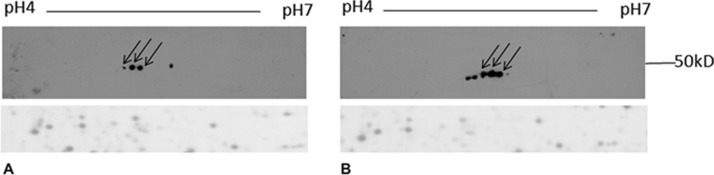
Fig. 1 reports representative gel images of caveolar-raft microdomains from control (A) and VEGF-treated ECFCs (B). The variation among protein levels was considered significant if the t test resulted less than 0.05 (p < 0.05).
Fig. 1.

2-D gels of caveolar-raft fractions. Silver-stained 2-D gels of caveolar-raft membrane fractions from control (A) and VEGF-stimulated ECFCs (VEGF: 50 ng/ml for 12 h) (B). Proteins (40 μg) were separated by their pI on 4–7 linear IPG strips and by their molecular weight on 9–16% polyacrylamide linear gradient gels. Black circles indicate spots that presented a differential occurrence in micro-domain after VEGF stimulation. Numbers indicate spot identified by mass spectrometry. The insets of each panel show the Western blotting with anticaveolin, antiflotillin and anti-integrinβ1 antibodies of fractions obtained by density-gradient centrifugation of ECFCs lysates (the caveolin-rich fractions Western blotting in each panel is representative of 20 different experiments performed with preparative purposes, to collect the amount of material to be subjected to mass-spectrometry analysis). Caveolin and flotillin positive fractions were collected and used in the 2-D gels. Molecular weights are reported on the right.
We selected spots whose fold change was ≥1.7. Sixty-eight spots satisfied these criteria (circled in the panels of Fig. 1). Only 10 spots presented an increased level in caveolar-raft microdomains of control cells. Of the remaining 58 spots, 29 resulted increased upon VEGF stimulation. Twenty nine spots were exclusively detectable following VEGF stimulation.
Mass Spectrometry Identification
To identify spots of interest, a preparative gel was performed and stained with Coomassie. The protein load increment caused a decrease of protein resolution. Thereby, several spots detected in silver stained gels were not clearly resolved in preparative gels. Furthermore several spots, present in very low amounts in analytical gels, were not visible after colloidal Coomassie staining of preparative gels.
We identified 28 protein spots corresponding to 25 gene products that are listed in Table I. Detailed mass data are reported in Online Resource 1. Several of identified proteins have been previously reported to be associated with membrane caveolar-raft microdomains. In particular Heat-shock proteins (Hsps) (19, 20), Stomatin-like protein-2, and Prohibitin, which belong to prohibitin homology (PHB) domain proteins (21). Other proteins are known to participate to VEGF signaling. Among these, peroxiredoxin-2 colocalizes with VEGFR2 in the caveolae and prevents VEGFR2 oxidation and inactivation (22).
Table I. MALDI-TOF analysis of proteins whose expression levels significantly differs between VEGF stimulated and control cells.
| Spot numbera | Accession numberb | Fold changec | p valued | Mascot search resultse |
Protein | ||
|---|---|---|---|---|---|---|---|
| No. of matched peptides | Sequence coverage (%) | Score | |||||
| 1 | P35232 | −1.7 | 0.0008 | 10/24 | 52 | 128 | Prohibitin |
| FDAGELITQR IFTSIGEDYDER | |||||||
| 2 | P78417 | 3.1 | 0.02 | 9/19 | 31 | 107 | Glutathione S-transferase omega |
| GSAPPGPVPEGSIR | |||||||
| 3 | Q99497 | 3.1 | 0.0019 | 9/16 | 52 | 125 | Protein DJ-1 |
| EGPYDVVVLPGGNLGAQNLSESAAVK | |||||||
| 4 | P49720 | 1.8 | 0.0095 | 13/21 | 51 | 152 | Proteasome subunit beta type-3 |
| FGPYYTEPVIAGLDPK LYIGLAGLATDVQTVAQR | |||||||
| 5 | P30040 | 2.2 | 0.011 | 10/17 | 33 | 120 | Endoplasmic reticulum resident protein 2 |
| 6 | P09211 | 1.7 | 0.012 | 11/29 | 69 | 131 | Glutathione S-transferase P |
| FQDGDLTLYQSNTILR | |||||||
| 7 | Q15181 | 2 | 0.014 | 10/20 | 35 | 133 | Inorganic pyrophosphatase |
| 8 | P32119 | 1.7 | 0.014 | 10/19 | 42 | 152 | Peroxiredoxin-2 |
| QITVNDLPVGR EGGLGPLNIPLLADVTR | |||||||
| 9 | P09525 | −2 | 0.018 | 13/18 | 41 | 160 | Annexin A4 |
| GLGTDEDAIISVLAYR ISQTYQQQYGR | |||||||
| 10 | P48643 | 1.7 | 0.018 | 15/24 | 35 | 147 | T-complex protein 1 subunit epsilon |
| IADGYEQAAR LGFAGLVQEISFGTTK | |||||||
| 11 | Q9UJZ1 | 1.8 | 0.02 | 9/12 | 26 | 121 | Stomatin-like protein 2 |
| 12 | P02792 | 1.9 | 0.02 | 7/14 | 35 | 104 | Ferritin light chain |
| DDVALEGVSHFFR LNQALLDLHALGSAR | |||||||
| 13 | O00299 | 1.64 | 0.02 | 13/29 | 66 | 177 | Chloride intracellular channel protein 1 |
| EEFASTCPDDEEIELAYEQVAK VLDNYLTSPLPEEVDETSAEDEGVSQR | |||||||
| 14 | P38646 | −1.9 | 0.029 | 19/28 | 31 | 192 | Stress-70 protein, mitochondrial |
| SQVFSTAADGQTQVEIK STNGDTFLGGEDFDQALLR | |||||||
| 15 | P12429 | 1.9 | 0.031 | 13/21 | 40 | 168 | Annexin A3 |
| GAGTNEDALIEILTTR | |||||||
| 16 | P11142 | Only in VEGF | 25/40 | 42 | 226 | Heat shock cognate 71 kDa protein | |
| 17 | Q8NBS9 | 2 | 0.005 | 21/50 | 49 | 219 | Thioredoxin domain-containing protein 5 |
| VDCTQHYELCSGNQVR | |||||||
| 18 | P06396 | Only in VEGF | 12/16 | 15 | 139 | Gelsolin | |
| 19 | P11021 | 2.5 | 0.009 | 29/43 | 47 | 297 | 78 kDa glucose-regulated protein |
| 20 | P11021 | Only in VEGF | 25/57 | 41 | 222 | 78 kDa glucose-regulated protein | |
| DNHLLGTFDLTGIPPAPR IEIESFYEGEDFSETLTR | |||||||
| 21 | P11021 | 2.3 | 0.009 | 33/55 | 5 | 292 | 78 kDa glucose-regulated protein |
| 22 | P25786 | Only in VEGF | 12/22 | 44 | 132 | Proteasome subunit alpha type-1 | |
| NQYDNDVTVWSPQGR | |||||||
| 23 | P04632 | 1.9 | 0.01 | 9/16 | 30% | 124 | Calpain small subunit 1 |
| THYSNIEANESEEVR ILGGVISAISEAAAQYNPEPPPPR | |||||||
| 24 | P09936 | 2.1 | 0.014 | 13/26 | 71% | 173 | Ubiquitincarboxyl-terminal hydrolaseisozyme L1 |
| VDDKVNFHFILFNNVDGHLYELDGR | |||||||
| 25 | P34932 | Only in VEGF | 16/24 | 23% | 145 | Heat shock 70 kDa protein 4 | |
| 26 | P46108 | Only in VEGF | 10/16 | 36% | 144 | Adapter molecule crk | |
| 27 | Q14764 | Only in VEGF | 16/20 | 19% | 184 | Major vault protein | |
| 28 | P30041 | 1.7 | 0.04 | 9/13 | 40% | 140 | Peroxiredoxin-6 |
| PGGLLLGDVAPNFEANTTVGR | |||||||
a Spot numbers match those reported in the representative 2-DE images shown in Fig. 1.
b Accession number in Swiss-Prot/UniprotKB.
c Fold change (VEGF stimulated vs. control) was calculated as follow: %VVEGF/%Vcontrol. (V = integration of OD over the spot area; %V = V single spot/V total spots).
d Student's t-test was performed to determine if the relative change was statistically significant (p < 0.05).
e MASCOT search results: number of matched peptides correspond to peptide masses matching the top hit from Ms-Fit PMF, searched peptide are also reported; sequence coverage indicates [number of identified residues/total number of amino acid residues in the protein sequence] × 100%; score corresponds to MASCOT score (MatrixScience, London, UK; http.//www.matrixscience.com).
To globally analyze proteomic results and to determine whether the identified proteins showed an enrichment for a particular group of biological process, the proteins whose expression in rafts was modified by VEGF challenge were submitted to GO analysis using DAVID. The results are reported in Table II. These data clearly indicate that VEGF stimulation induces a reorganization of caveolar-raft microdomain protein composition characterized by the occurrence of several proteins involved in pathways that can be connected to each others. In particular, the categories correlated with an inhibition of cellular death (anti-apoptosis, negative regulation of cell death, negative regulation of programmed cell death, negative regulation of apoptosis) are enriched. Is noteworthy that also the category “hydrogen peroxide metabolic processes” is strongly over-represented. This last observation is in agreement with the redox regulation of VEGF signaling in angiogenesis (23).
Table II. Detailed composition and statistical parameters of the top enriched GO terms.
| Term | Count | p valuea | Protein name | Fold Enrichmentb | Benjaminic |
|---|---|---|---|---|---|
| Anti-apoptosis (GO:0006916) | 6 | 1,7E-05 | dAnnexin A4, Glutathione S-transferase P, Thioredoxin domain-containing protein 5, 78 kDa glucose-regulated protein, Peroxiredoxin-2, Stress-70 protein, mitochondrial | 17,13 | 0,0078 |
| Negative regulation of apoptosis (GO:0043066) | 6 | 2,2E-04 | 9,97 | 0,0499 | |
| Negative regulation of programmed cell death (GO:0043069) | 6 | 2,4E-04 | 9,83 | 0,0358 | |
| Negative regulation of cell death (GO:0060548) | 6 | 2,4E-04 | 9,80 | 0,0273 | |
| Negative regulation of cellular process (GO:0048523) | 10 | 7,4E-04 | Prohibitin, Gelsolin, Proteasome subunit alpha type-1, Proteasome subunit alpha type-1, Glutathione S-transferase P, Thioredoxin domain-containing protein 5, 78 kDa glucose-regulated protein, Peroxiredoxin-2, Proteasome subunit beta type-3, Stress-70 protein, mitochondrial | 3,54 | 0,0652 |
| Hydrogen peroxide metabolic process (GO:0042743) | 3 | 7,4E-04 | Peroxiredoxin-6, Peroxiredoxin-2, Protein DJ-1 | 70,58 | 0,0553 |
| Response to stress (GO:0006950) | 10 | 8,2E-04 | Peroxiredoxin-6, Heat shock 70 kDa protein 4, Ubiquitincarboxyl-terminal hydrolaseisozyme L1, Heat shock cognate 71 kDa protein, Chlorideintracellularchannelprotein 1, Gelsolin, 78 kDa glucose-regulatedprotein, Peroxiredoxin-2, Stress-70 protein, mitochondrial, Protein DJ-1 | 3,49 | 0,0523 |
| Negative regulation of biological process (GO:0048519) | 10 | 1,4E-03 | Prohibitin, Gelsolin, Proteasome subunit alpha type-1, Annexin A4, Glutathione S-transferase P, Thioredoxin domain-containing protein 5, 78 kDa glucose-regulated protein, Peroxiredoxin-2, Proteasome subunit beta type-3, Stress-70 protein, mitochondrial | 3,25 | 0,0768 |
| Regulation of apoptosis (GO:0042981) | 7 | 1,5E-03 | *Prohibitin, Annexin A4, Glutathione S-transferase P, Thioredoxin domain-containing protein 5, 78 kDa glucose-regulated protein, Peroxiredoxin-2, Stress-70 protein, mitochondrial | 5,12 | 0,0719 |
| Regulation of programmed cell death (GO:0043067) | 7 | 1,5E-03 | 5,07 | 0,0683 | |
| Regulation of cell death (GO:0010941) | 7 | 1,6E-03 | 5,05 | 0,0634 |
a p value with a modified Fisher exact test was used to select the top enriched categories.
b Fold enrichment indicates the magnitude of enrichment.
c Benjamini multiple testing was performed to globally correct the p value controlling family-wide false discovery rate (π value ≤ 0.1).
d These proteins are the same for all GO terms of the corresponding columns.
uPAR Detection by Western Blot
We previously demonstrated that VEGF stimulates a caveolar-raft redistribution of uPAR (3). The proteomic analysis performed in the present work does not allow the identification of uPAR. This could be caused both by a protein level under detection limit or by a differential expression level lower than the threshold selected for the identification by mass spectrometry. To confirm uPAR redistribution after VEGF stimulation we performed a 2-DE followed by Western blot with anti-uPAR antibodies. Fig. 2 shows several spots detected by specific uPAR antibody without background. VEGF stimulation induces both an increase of protein level (three spots show an increased intensity) and the appearance of two new spots. This probably indicates the occurrence of post-translational modifications.
Fig. 2.
uPAR detection by Western blotting. Caveolar-raft proteins (150 μg) were separated by their pI on 4–7 linear IPG strips and by their molecular weight on 9–16% polyacrylamide linear gradient gels. After 2-DE, gels were blotted on PVDF membrane and uPAR was detected with specific antibody. Arrows represent corresponding spots between the two blots. A, control cells; B, VEGF stimulated cells. The same blots were stained with Coomassie brilliant blue (a representative part of PVDF membrane is reported) to confirm that protein load was the same.
Functional Characterization of Selected Proteins in VEGF-dependent Angiogenesis
To verify the involvement of the identified proteins in VEGF dependent angiogenesis, some specific proteins were selected. In particular we selected Peroxiredoxin-2, because of its presence in all the resulting GO terms, and its cognate molecule Peroxiredoxin-6. The heat shock protein 78 kDa glucose-regulated protein was chosen in virtue of its reported membrane localization and its role in angiogenesis (24). Moreover, this protein is present in almost all the GO terms. Although not present in the top enriched GO biological processes, Annexin-3 and Calpain small subunit-1 were selected on the basis of their documented role in VEGF-dependent angiogenesis (25, 26).
Initially we determined by quantitative RT-PCR the mRNA expression level of each selected protein under control conditions and upon 4 h of 50 ng/ml VEGF stimulation. The corresponding protein amount was verified in total cell extract after 12 h of VEGF stimulation. Fig. 3A shows that VEGF stimulation did not significantly modify mRNA expression of Calpain small subunit-1, Annexin-3 and Peroxiredoxin-2, thus suggesting that VEGF produces a selective caveolar-raft enrichment of these proteins. On the contrary, both 78 kDa glucose-regulated protein and Peroxiredoxin-6 mRNAs resulted strongly up-regulated by VEGF, thus suggesting a possible nonselective caveolar-raft enrichment of the relevant protein. These results were confirmed by Western blotting on whole cell lysates (Figs. 3B). Furthermore Western blotting on both in caveolar-raft and non-caveolar raft-fractions under control and after 12 h of VEGF stimulation, was performed. The relative results confirmed proteomic findings showing an increase of the selected proteins in caveolar-raft fractions upon VEGF treatment (Fig. 3C).
Fig. 3.

Quantitative RT-PCR and Western blotting analisys of selected caveolar raft-enriched proteins before and after VEGF stimulation. A, Real time PCR showing gene expression levels of calpain small subunit-1 (CAPNS1), peroxiredoxin-2 (PRDX2), peroxiredoxin-6 (PRDX6), annexin-A3 (ANXA3), and 78 kDa glucose-regulated protein (GRP78). Transcripts were quantified by real-time PCR in ECFCs before and after 4 h of VEGF challenge (50 ng/ml). Data shown are the mean of three different experiments performed in triplicate. The two-tailed, nonpaired Student's t test was performed. * indicates a p value < 0.05. B; Western blotting analisys of selected proteins in whole lysates before and after 12 h VEGF treatment (50 ng/ml). Intensity of immunostained bands was normalized against tubulin. Histograms, reporting the normalization in arbitrary units, are the mean of three different experiments performed in triplicate. The two-tailed, nonpaired Student's t test was performed. * indicates a p value < 0.05. C, Western blotting analysis of selected proteins in caveolar-raft and nonraft fractions before and after 12 h of VEGF treatment. The protein load was checked by staining the PVDF membrane with Coomassie. RC: raft fraction, control; RV: raft fraction, VEGF stimulation; NRC: non-raft fraction, control; NRV: non-raft fraction, VEGF stimulation. Each blotting shows the result of a typical experiment of three that gave similar results.
To validate the functional involvement of the selected proteins in ECFC angiogenesis, their mRNAs were silenced by specific siRNA and ECFC angiogenesis properties in vitro were evaluated by the capillary morphogenesis assay. Fig. 4 reports quantitative RT-PCR and Western blotting experiments showing that specific siRNA treatments were very efficient in inhibiting mRNA and protein expression with respect to both transfection reagents alone (RiboFECT) and not-targeting RNA (siControl).
Fig. 4.

Quantitative RT-PCR and Western blotting analysis of selected caveolar raft-enriched proteins following siRNA treatment. Real time PCR showing gene expression levels before and after ECFCs treatment with specific siRNA to CAPNS1, PRDX2, PRDX6, ANXA3, GRP78. RiboFECT: ECFCs treated with transfection reagents alone; siCONTROL: ECFCs treated with a not-inhibiting RNA; siRNA: siRNA treatment for each specific gene. Data shown are the mean of three different experiments performed in triplicate. The two-tailed, non-paired Student's t test was performed. * indicates a p value < 0.05. Under each histogram the Western blotting of the protein is shown. Each blotting represents a typical experiment out of three that gave similar results.
Fig. 5 shows the results of siRNA treatment on capillary morphogenesis under control conditions (ECFCs treated with transfection reagents alone, RiboFECT, or with not-targeting RNA: siCONTROL) and after 4 h of 50 ng/ml VEGF stimulation. Data clearly show that the promorphogenetic activity of VEGF on ECFCs is almost completely inhibited upon silencing of each selected protein. A similar activity of siRNA treatments, although weaker, was revealed also in control, not stimulated ECFCs, indicating a role of each protein in spontaneous capillary-morphogenesis which has been previously shown to depend on VEGF autocriny by EPCs (27). We have also evaluated whether apoptosis was involved in the effects elicited by each specific siRNA treatment on capillary morphogenesis, obtaining negative results in each condition (not shown).
Fig. 5.
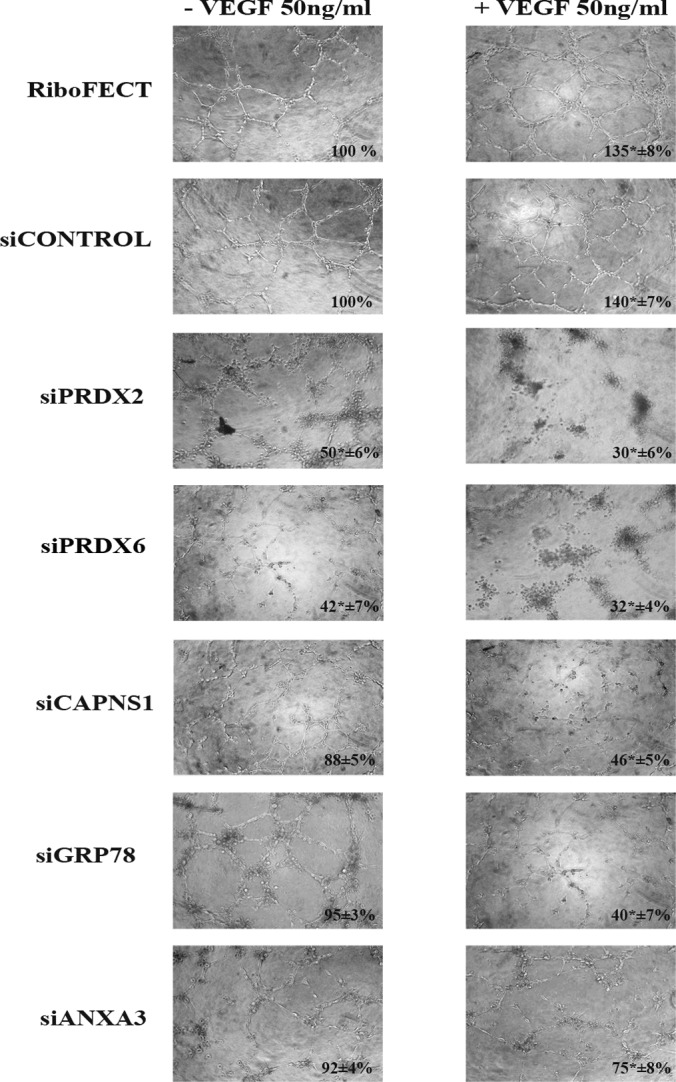
Capillary-morphogenesis of control and VEGF-challenged ECFCs, before and after siRNA treatment. The left column of pictures shows capillary morphogenesis of not stimulated ECFCs. The right column of pictures shows capillary morphogenesis of ECFCs in the presence of VEGF (50 ng/ml). Numbers in each figure indicate the percentage occupancy of optic field by ECFCs capillary projections (±S.D.). Images were collected and analyzed by ImageJ software. Percentage occupancy of control ECFCs treated with RiboFECT and siCONTROL, was taken as 100%. Pictures shown are representative of four different experiments, performed in triplicate. The two-tailed, non-paired Student's t test was performed. * indicates a p value < 0.05. RiboFECT: treatment with transfection reagents alone; siCONTROL: treatment with not-targeting siRNA; siPRDX2: treatment with siRNA smart pool targeting Peroxiredoxin-2; siPRDX6: treatment with siRNA smart pool targeting Peroxiredoxin-6; siCAPNS1: treatment with siRNA smart pool targeting Calpain small subunit 1; siGRP78: treatment with siRNA smart pool targeting 78 kDa-glucose-regulated-protein; siANXA3: treatment with siRNA smart pool targeting Annexin A3.
Because previous studies have shown that calpain mediates VEGF-induced angiogenic effects by modulating actin cytoskeleton organization (26), the ECFCs actin structure was evaluated, before and after calpain siRNA silencing, in the same conditions used in the experiments shown in Figs. 4 and 5. The results shown in Fig. 6 indicate that VEGF treatment (50 ng/ml for 6 h) strengthened stress fiber formation in ECFCs. Calpain-siRNA treatment limited actin organization in stress fibers under control conditions. Instead, actin organization under VEGF stimulation was completely impaired, accounting for ECFCs capillary morphogenesis inhibition and showing, at the same time, the additional value of caveolar-rafts-localized calpain in the stress-fibers-promoting activity in ECFCs.
Fig. 6.

Actin stress fibers organization in ECFCs before and after calpain small subunit-1 silencing. The organization of actin stress fibers in ECFCs was revealed using TRITC-labeled phalloidin. The upper lane shows actin stress organization in cells not stimulated by VEGF; while lower lane shows actin stress fibers organization upon VEGF challenge. The figure represents the results of a typical experiment out of three experiments performed in triplicate. Abbreviations used are the same of other figures. Original magnification: ×60.
DISCUSSION
VEGF is best known for its angiogenic activity on mature endothelial cells as well as on EPCs, but increasing evidence indicates that VEGF can also act in an autocrine manner, inducing a stress response that has a protective/survival effect on a number of cell types, including endothelial cells, embryonic stem cells, and hematopoietic stem cells (27–30). Here, we performed proteomic analysis of EPC caveolar-rafts before and after VEGF stimulation, coupled with mass spectrophotometry to identify candidate proteins whose occurrence in caveolar-rafts was modified by VEGF. We observed a VEGF-dependent caveolar-raft enrichment of proteins correlated with an inhibition of cellular death (anti-apoptosis, negative regulation of cell death, negative regulation of programmed cell death, negative regulation of apoptosis), in agreement with the reported prosurvival activity of VEGF. Also the category “hydrogen peroxide metabolic processes” was strongly over-represented, according to the known redox regulation of VEGF signaling in angiogenesis (23). In particular, we would like to discuss the function of the differentially caveolar-raft-associated proteins that we have validated in this study, showing that siRNA inhibition of each relevant molecule abolished the VEGF-dependent capillary morphogenesis of EPCs.
Chronic exposure to reactive oxygen species (ROS) and the resulting oxidative stress, viewed as the overproduction of ROS, the failure of the anti-oxidant defense of the organism, or both, play a critical role in human pathology (31). Nevertheless, it is now recognized that endothelial cells need physiological amounts of ROS to function properly. More specifically, because Sundaresan and coworkers (32) showed that platelet-derived growth factor (PDGF)-induced H2O2 generation is required for the tyrosine phosphorylation in vascular smooth muscle cells, several studies have reported that H2O2 plays a signaling role in receptor tyrosine kinase (RTK)-mediated signal transduction (33). Specifically, H2O2 is known to trigger the reversible oxidation of protein tyrosine phosphatases, which results in the transient blunting of the phosphatase activity and in the sustained signaling activity of the relevant receptor (34). Also the endothelial cell VEGF receptor-2 (VEGFR2)-dependent pro-angiogenic activity has recently been shown to depend on such a regulation (35). Additionally, in parallel with the classical phosphorylation signaling, VEGFR2 seems to usee ROS as a downstream signal mediator. In fact several studies demonstrated the involvement of superoxide-producing enzyme NADPH oxidase (NOX) in VEGF signaling and endothelial functions such as adhesion (36) and actin filament assembly (37). Nevertheless, ROS still have potential damaging activity on VEGFR2 pathways that need to be controlled to maintain a finely tuned pro-angiogenic ROS concentration. In particular, the endothelial caveolar-raft localized VEGFR2 has an oxidation-sensitive cysteine residue whose functionally active reduced state is preserved specifically by peroxiredoxin-2 (22).
Peroxiredoxins (Prxs) are a family of proteins showing peroxidase activities that degrade H2O2 to H2O, thereby abolishing H2O2 toxicity. The peroxiredoxin-2-mediated VEGF2R protection is achieved by association of the two proteins in the caveolae (22). Our observation that not only peroxiredoxin-2, but also peroxiredoxin-6 is located in the caveolar-rafts, point to a possibly convergent role of the two enzymes as safeguards of the redox-sensitive VEGFR2 (38). As shown in Table II, the GO term referred to as “hydrogen peroxide metabolic process” (represented by peroxiredoxin-2, peroxiredoxin-6 and protein DJ-1) undergoes the highest fold enrichment at the EPC caveolar-raft level upon VEGF stimulation (more than 70-fold).
Alongside, all the GO terms related to the control of apoptosis/programmed cell death (including also some heat shock proteins) (Table II) are significantly overexpressed in VEGF-challenged EPCs. The caveolar-raft localization of such molecules further reinforces the need of EPCs to strictly control ROS production/activity, as well as elimination and/or inactivation of damaged molecules. Such molecules may result upon the NADPH oxidase generation of spatially and temporally VEGF signaling-dependent ROS production at leading edge, focal adhesions/complexes, caveolae/lipid rafts, and cell-cell junctions in EC (39). Among these molecules, we have validated the angiogenesis-related activity of the cell's membrane 78 kDa glucose-regulated protein, which results present at the caveolar-raft level only after VEGF stimulation (Table I) and whose silencing results in capillary morphogenesis impairment in EPCs. Although not present in the enriched GO terms, we also silenced annexin A3 (ANXA3), and calpain small subunit 1, in view of their established functions in angiogenesis. ANXA3 induces migration and tube formation of human umbilical vein EC. High levels of vascular endothelial growth factor (VEGF) are also detected in conditioned medium obtained from cells transfected with ANXA3 expression plasmid. Reporter assays show that ANXA3 enhances hypoxia-inducible factor-1 (HIF-1) transactivation activity. All these data suggest that ANXA3 is a novel angiogenic factor that induces VEGF production through the HIF-1 pathway (25).
Calpains are a family of calcium-activated nonlysosomal neutral cysteine endopeptidases, which act via limited proteolysis of substrate proteins. Caveolar-raft localization of calpains has been described in myotubes (40), Jurkat T-cells (41), neutrophils subjected to chemotactic stimulation (42). The silencing of calpain small subunit-1 by siRNA resulted into capillary morphogenesis impairment, in agreement with the indication that calpain mediates VEGF-induced angiogenic effects by a PKC and Rho GTPase. These two molecules, in turn, mediate an intracellular signaling that promotes the actin cytoskeletal organization required for the lamellipodia formation (26, 43). Another interesting molecule found expressed only in VEGF-stimulated ECFCs is gelsolin, which is the best-characterized member of a superfamily of actin binding proteins that sever, cap, and in some cases nucleate and bundle actin filaments (44). Gelsolin has a well established activity on actin organization, but it has never been described before as a lipid-raft-associated molecule. However, the identification of gelsolin in such specialized signaling platforms in ECFCs could account for its reported activity in modulating the tyrosine phosphorylation of raft-associated proteins and subsequent downstream signal transduction (45).
In conclusion, our data on the differential caveolar-raft proteomic profiling of VEGF-stimulated ECFCs permit identification of two main categories of molecules involved in the process of angiogenesis and associated to specialized membrane caveolar-raft microdomains: the first one, in terms of enrichment and function, respond to the need of ECFCs to control physiological amounts of ROS and to remove ROS-damaged molecules to function properly; the second one entails a proper functioning of the ECFCs actin cytoskeleton whose activity is indispensable to an adequate angiogenic program. These data open new perspectives for an in-depth investigation of VEGF angiogenesis through a holistic approach.
Footnotes
* This study was supported by grants of the Istituto Toscano Tumori (ITT), Ente cassa di Risparmio di Firenze, Ministero Italiano della Pubblica Istruzione (PRIN, Progetti di Ricerca di Interesse nazionale).
1 The abbreviations used are:
- EPC
- endothelial progenitor cells
- 2-DE
- two dimensional electrophoresis
- ECs
- endothelial cells
- ECFCs
- endothelial colony-forming cells
- siRNA
- small interfering RNA
- uPAR
- urokinase plasminogen activator receptor
- VEGF
- Vascular Endothelial Growth Factor.
REFERENCES
- 1. Carmeliet P. (2000) Mechanisms of angiogenesis and arteriogenesis. Nat. Med. 6, 389–395 [DOI] [PubMed] [Google Scholar]
- 2. Asahara T., Murohara T., Sullivan A., Silver M., van der Zee R., Li T., Witzenbichle B., Schatteman G., Isner J. M. (1997) Isolation of putative progenitor endothelial cells for angiogenesis. Science 275, 964–967 [DOI] [PubMed] [Google Scholar]
- 3. Margheri F., Chillà A., Laurenzana A., Serratì S., Mazzanti B., Saccardi R., Santosuosso M., Danza G., Sturli N., Rosati F., Magnelli L., Papucci L., Calorini L., Bianchini F., Del Rosso M., Fibbi G. (2011) Endothelial progenitor cell-dependent angiogenesis requires localization of the full-length form of uPAR in caveolae. Blood 118, 3743–3755 [DOI] [PubMed] [Google Scholar]
- 4. Ingram D. A., Mead L. E., Tanaka H., Meade V., Fenoglio A., Mortell K., Pollok K., Ferkowicz M. J., Gilley D., Yoder M. C. (2004) Identification of a novel hierarchy of endothelial progenitor cells using human peripheral and umbilical cord blood. Blood 104, 2752–2760 [DOI] [PubMed] [Google Scholar]
- 5. Yoder M. C., Mead L. E., Prater D., Krier T. R., Mroueh K. N., Li F., Krasich R., Temm C. J., Prchal J. T., Ingram D. A. (2007) Redefining endothelial progenitor cells via clonal analysis and hematopoietic stem/progenitor cell principals. Blood 109, 1801–1809 [DOI] [PMC free article] [PubMed] [Google Scholar]
- 6. Del Rosso M., Margheri F., Serratì S., Chillà A., Laurenzana A., Fibbi G. (2011) The urokinase receptor system, a key regulator at the intersection between inflammation, immunity, and coagulation. Curr. Pharm. Des. 17, 1924–1943 [DOI] [PubMed] [Google Scholar]
- 7. Eden G., Archinti M., Furlan F., Murphy R., Degryse B. (2011) The urokinase receptor interactome. Curr. Pharm. Des. 17, 1874–1889 [DOI] [PubMed] [Google Scholar]
- 8. Staubach S., Hanisch F. G. (2011) Lipid rafts: signaling and sorting platforms of cells and their roles in cancer. Expert Rev. Proteomics 8, 263–277 [DOI] [PubMed] [Google Scholar]
- 9. Frank P. G., Woodman S. E., Park D. S., Lisanti M. P. (2003) Caveolin, caveolae, and endothelial cell function. Arterioscler. Thromb. Vasc. Biol. 23, 1161–1168 [DOI] [PubMed] [Google Scholar]
- 10. Tahir S. A., Park S., Thompson T. C. (2009) Caveolin-1 regulates VEGF-stimulated angiogenic activities in prostate cancer and endothelial cells. Cancer Biol. Ther. 8, 2286–2296 [DOI] [PMC free article] [PubMed] [Google Scholar]
- 11. Liao W. X., Feng L., Zhang H., Zheng J., Moore T. R., Chen D. B. (2009) Compartmentalizing VEGF-induced ERK2/1 signaling in placental artery endothelial cell caveolae: a paradoxical role of caveolin-1 in placental angiogenesis in vitro. Mol. Endocrinol. 23, 1428–1444 [DOI] [PMC free article] [PubMed] [Google Scholar]
- 12. George K. S., Wu S. (2012) Lipid raft: A floating island of death or survival. Toxicol. Appl. Pharmacol. 259, 311–319 [DOI] [PMC free article] [PubMed] [Google Scholar]
- 13. Corselli M., Parodi A., Mogni M., Sessarego N., Kunkl A., Dagna-Bricarelli F., Ibatici A., Pozzi S., Bacigalupo A., Frassoni F., Piaggio G. (2008) Clinical scale ex vivo expansion of cord blood-derived outgrowth endothelial progenitor cells is associated with high incidence of karyotype aberrations. Exp. Hematol. 36, 340–349 [DOI] [PubMed] [Google Scholar]
- 14. Kim K. B., Lee J. S., Ko Y. G. (2008) The isolation of detergent-resistant lipid rafts for two-dimensional electrophoresis. Methods Mol. Biol. 424, 413–422 [DOI] [PubMed] [Google Scholar]
- 15. Hochstrasser D. F., Patchornik A., Merril C. R. (1988) Development of polyacrylamide gels that improve the separation of proteins and their detection by silver staining. Anal. Biochem. 173, 412–423 [DOI] [PubMed] [Google Scholar]
- 16. Neuhoff V., Arold N., Taube D., Ehrhardt W. (1988) Improved staining of proteins in polyacrylamide gels including isoelectric focusing gels with clear background at nanogram sensitivity using Coomassie Brilliant Blue G-250 and R-250. Electrophoresis 9, 255–262 [DOI] [PubMed] [Google Scholar]
- 17. Huang da W., Sherman B. T., Lempicki R. A. (2009) Systematic and integrative analysis of large gene lists using DAVID bioinformatics resources. Nat Protoc 4, 44–57 [DOI] [PubMed] [Google Scholar]
- 18. D'Alessio S., Fibbi G., Cinelli M., Guiducci S., Del Rosso A., Margheri F., Serratì S., Pucci M., Kahaleh B., Fan P., Annunziato F., Cosmi L., Liotta F., Matucci-Cerinic M., Del Rosso M. (2004) Matrix metalloproteinase 12-dependent cleavage of urokinase receptor in systemic sclerosis microvascular endothelial cells results in impaired angiogenesis. Arthritis Rheum. 50, 3275–3285 [DOI] [PubMed] [Google Scholar]
- 19. Shin. B. K., Wang H., Yim A. M., Le Naour F., Brichory F., Jang J. H., Zhao R., Puravs E., Tra J., Michael C. W., Misek D. E., Hanash S. M. (2003) Global profiling of the cell surface proteome of cancer cells uncovers an abundance of proteins with chaperone function. J. Biol. Chem. 278, 7607–7616 [DOI] [PubMed] [Google Scholar]
- 20. Horváth I., Multhoff G., Sonnleitne A., Vígh L. (2008) Membrane-associated stress proteins: more than simply chaperones. Biochim. Biophys. Acta 1778, 1653–1664 [DOI] [PubMed] [Google Scholar]
- 21. Morrow I. C., Parton R. G. (2005) Flotillins and the PHB Domain Protein Family: Rafts, Worms and Anaesthetics. Traffic 6, 725–740 [DOI] [PubMed] [Google Scholar]
- 22. Kang D. H., Lee D. J., Lee K. W., Park Y. S., Lee J. Y., Lee S. H., Koh Y. J., Koh G. Y., Choi C., Yu D. Y., Kim J., Kang S. W. (2011) Peroxiredoxin II is an essential antioxidant enzyme that prevents the oxidative inactivation of VEGF receptor-2 in vascular endothelial cells. Mol. Cell. 44, 545–558 [DOI] [PubMed] [Google Scholar]
- 23. Shroder K. (2010) Isoform specific functions of Nox protein-derived reactive oxygen species in the vasculature. Curr. Opin. Pharmacol. 10, 122–126 [DOI] [PubMed] [Google Scholar]
- 24. Raiter A., Weiss C., Bechor Z., Ben-Dor I., Battler A., Kaplan B., Hardy B. (2010) Activation of GRP78 on endothelial cell membranes by an ADAM15-derived peptide induces angiogenesis. J. Vascular Res. 47, 399–411 [DOI] [PubMed] [Google Scholar]
- 25. Park J. E., Lee D. H., Lee J. A., Park S. G., Kim N. S., Park B. C., Cho S. (2005) Annexin A3 is a potential angiogenic mediator. Biochem. Biophys. Res. Commun. 337, 1283–1287 [DOI] [PubMed] [Google Scholar]
- 26. Su Y., Cui Z., Li Z., Block E.R. (2006) Calpain-2 regulation of VEGF-mediated angiogenesis. FASEB J. 20, 1443–1451 [DOI] [PubMed] [Google Scholar]
- 27. Byrne A. M., Boucher-Hayes D. J., Harmey J. H. (2005) Angiogenic and cell survival functions of Vascular Endothelial Growth Factor (VEGF). J. Cell. Mol. Med. 9, 777–794 [DOI] [PMC free article] [PubMed] [Google Scholar]
- 28. Gerber H. P., Malik A. K., Solar G. P., Sherman D., Liang X. H., Meng G., Hong K., Marsters J. C., Ferrara N. (2002) VEGF regulates haematopoietic stem cell survival by an internal autocrine loop mechanism. Nature 417, 954–958 [DOI] [PubMed] [Google Scholar]
- 29. Brusselmans K., Bono F., Collen D., Herbert J. M., Carmeliet P., Dewerchin M. (2005) A novel role for vascular endothelial growth factor as an autocrine survival factor for embryonic stem cells during hypoxia. J. Biol. Chem. 280, 3493–3499 [DOI] [PubMed] [Google Scholar]
- 30. Nör J. E., Christensen J., Mooney D. J., Polverini P. J. (1999) Vascular endothelial growth factor (VEGF)-mediated angiogenesis is associated with enhanced endothelial cell survival and induction of Bcl-2 expression. Am. J. Pathol. 154, 375–384 [DOI] [PMC free article] [PubMed] [Google Scholar]
- 31. Galli F., Piroddi M., Annetti C., Aisa C., Floridi A. (2005) Oxidative stress and reactive oxygen species. Contrib. Nephrol. 149, 240–260 [DOI] [PubMed] [Google Scholar]
- 32. Sundaresan M., Yu Z. X., Ferrans V. J., Irani K., Finkrl T. (1995) Requirement for generation of H2O2 for platelet growth factor signal transduction. Science 270, 296–299 [DOI] [PubMed] [Google Scholar]
- 33. Rhee S. G., Kang S. W., Jeong W., Chang T. S., Yang K. S., Woo H. A. (2005) Intracellular messenger function of hydrogen peroxide and its regulation by peroxiredoxins. Curr. Opin. Cell Biol. 17, 183–189 [DOI] [PubMed] [Google Scholar]
- 34. Tonks N. K. (2006) Protein tyrosine phosphatases: from genes, to function, to disease. Nat. Rev. Mol. Cell Biol. 7, 833–846 [DOI] [PubMed] [Google Scholar]
- 35. Oshikawa J., Urao N., Kim H. W., Kaplan N., Razvi M., McKinney R., Poole L. B., Fukai T., Ushio-Fukai M. (2010) Extracellular SOD-derived H2O2 promotes VEGF signaling in caveolae/lipid rafts and post-ischemic angiogenesis in mice. PLoS One 5, e10189. [DOI] [PMC free article] [PubMed] [Google Scholar]
- 36. Abid M. R., Spokes K. C., Shih S. C., Aird W. C. (2007) NADPH oxidase activity selectively modulates vascular endothelial growth factor signaling pathways. J. Biol. Chem. 282, 35373–35385 [DOI] [PubMed] [Google Scholar]
- 37. Moldovan L., Mythreye K., Goldschmidt-Clermont P. J., Satterwhite L. L. (2006) Reactive oxygen species in vascular endothelial cell motility. Roles of NAD(P)H oxidase and Rac1. Cardiovasc. Res. 71, 236–246 [DOI] [PubMed] [Google Scholar]
- 38. Lien Y. C., Feinstein S. I., Dodia C., Fisher A. B. (2012) The roles of peroxidase and phospholipase A2 activities of peroxiredoxin 6 in protecting pulmonary microvascular endothelial cells against peroxidative stress. Antioxid. Redox. Signal 16, 440–451 [DOI] [PMC free article] [PubMed] [Google Scholar]
- 39. Ushio-Fukai M. (2007) VEGF signaling through NADPH oxidase-derived ROS. Antioxid. Redox. Signal. 9, 731–739 [DOI] [PubMed] [Google Scholar]
- 40. Goudenege S., Dargelos E., Claverol S., Bonneu M., Cottin P., Poussard S. (2007) Comparative proteomic analysis of myotubecaveolae after milli-calpain deregulation. Proteomics 7, 3289–3298 [DOI] [PubMed] [Google Scholar]
- 41. Morford L. A., Forrest K., Logan B., Overstreet L. K., Goebel J., Brooks W. H., Roszman T. L. (2002) Calpain II colocalizes with detergent-insoluble rafts on human and Jurkat T-cells. Biochem. Biophys. Res. Commun. 295, 540–546 [DOI] [PubMed] [Google Scholar]
- 42. Nuzzi P. A., Senetar M. A., Huttenlocher A. (2007) Asymmetric localization of calpain 2 during neutrophil chemotaxis. Mol. Biol. Cell 18, 795–805 [DOI] [PMC free article] [PubMed] [Google Scholar]
- 43. Sato K., Kawashima S. (2001) Calpain function in the modulation of signal transduction molecules. Biol. Chem. 382, 743–751 [DOI] [PubMed] [Google Scholar]
- 44. McGough A. M., Staiger C. J., Min J. K., Simonetti K. D. (2003) The gelsolin family of actin regulatory proteins: modular structures, versatile functions. FEBS Lett. 552, 75–81 [DOI] [PubMed] [Google Scholar]
- 45. Morley S. C., Sung J., Sun G. P., Martelli M. P., Bunnell S. C., Bierer B. E. (2007) Gelsolin overexpression alters actin dynamics and tyrosine phosphorylation of lipid raft-associated proteins in Jurkat T cells. Mol. Immunol. 44, 2469–2480 [DOI] [PMC free article] [PubMed] [Google Scholar]