Abstract
The purpose of this study was to generate a basis for the decision of what protein quantities are reliable and find a way for accurate and precise protein quantification. To investigate this we have used thousands of peptide measurements to estimate variance and bias for quantification by iTRAQ (isobaric tags for relative and absolute quantification) mass spectrometry in complex human samples. A549 cell lysate was mixed in the proportions 2:2:1:1:2:2:1:1, fractionated by high resolution isoelectric focusing and liquid chromatography and analyzed by three mass spectrometry platforms; LTQ Orbitrap Velos, 4800 MALDI-TOF/TOF and 6530 Q-TOF. We have investigated how variance and bias in the iTRAQ reporter ions data are affected by common experimental variables such as sample amount, sample fractionation, fragmentation energy, and instrument platform. Based on this, we have suggested a concept for experimental design and a methodology for protein quantification. By using duplicate samples in each run, each experiment is validated based on its internal experimental variation. The duplicates are used for calculating peptide weights, unique to the experiment, which is used in the protein quantification. By weighting the peptides depending on reporter ion intensity, we can decrease the relative error in quantification at the protein level and assign a total weight to each protein that reflects the protein quantitation confidence. We also demonstrate the usability of this methodology in a cancer cell line experiment as well as in a clinical data set of lung cancer tissue samples. In conclusion, we have in this study developed a methodology for improved protein quantification in shotgun proteomics and introduced a way to assess quantification for proteins with few peptides. The experimental design and developed algorithms decreased the relative protein quantification error in the analysis of complex biological samples.
Recent developments in methods and instruments for mass spectrometry enable quantitative proteomics analysis of complex samples with good coverage (1–4). Several techniques for quantification by mass spectrometry exist, both using isotopic labeling and label free methods (5, 6). Quantification by isotopic labeling can be done on precursor ion level or by quantifying isobaric label fragments in fragment spectra. Isotope-coded affinity tag (7), isobaric tags for relative and absolute quantification (iTRAQ)1 (8), and stable isotope labeling by amino acids in cell culture (SILAC) (9) are among the most commonly used labeling methods based on stable isotopes. iTRAQ allows for simultaneous relative quantification of up to eight samples within a single run. Quantification by mass spectrometry is however a challenge, and several factors contribute to the uncertainty in the quantitative estimate; differences in labeling efficiency, protein digestion, precursor mixing, ion suppression, peak detection, data preprocessing, and data analysis (10). The quality of quantitation methods can be measured in terms of precision and accuracy. Precision is affected by random errors, that is, random fluctuations around the true value (variance). Lack of accuracy is caused by systematic errors, that is, differences between true and observed values (bias).
Several studies have shown that iTRAQ labeling is associated with bias; fold changes are compressed toward one (11–14). It has been suggested that this underestimation of fold change is caused by co-eluting peptides with similar m/z values that are isolated together, creating mixed iTRAQ intensities in complex samples (14). Concerning precision, iTRAQ data has been reported to exhibit variance heterogeneity. The coefficient of variance (CV) of the signal depends on the intensity, with larger CV for low intensity peaks (11, 12, 15, 16). Measurements of iTRAQ intensities for quantification are made in the MS/MS spectra of the peptides, and thereafter combined to calculate a summarized relative protein quantity. There are several different approaches for combining the iTRAQ peptide data to compute a reliable protein ratio. Methods to improve the protein quantification by addressing the variance heterogeneity have been based on excluding low intensity peptide data (17, 18), weighting the peptide data according to intensity (18–21) or stabilizing the variance (12).
Quantitative studies of complex human samples are subject to even more challenges related to large biological variation, large and unknown complexity of the human proteome and a large concentration range of proteins. This in turn results in many peptides and a large variety of peptides that can cause interference and related problems in the mass spectrometry analysis. In, for example, biomarker discovery research the goal is to measure quantitative changes or differences in protein levels between two or more clinical conditions. It is therefore crucial to achieve as accurate and precise quantitative information from the data as possible as well as to correctly estimate the limitations of the quantification. Setting adequate standards for quantitative proteomics analysis is hence essential for being able to detect relevant changes in protein abundance, select important proteins, and further use those proteins to interpret the biological and clinical meaning (10, 22). Selecting a protein as significant and taking it to further validation in other clinical material using complementary techniques is time consuming and costly (23). For successful use of iTRAQ labeling in biomarker discovery, and to avoid false discoveries, it is hence essential to assess the accuracy and precision of the methodology.
A common approach to study variance and bias in mass spectrometry based protein quantification is to spike a set of standard proteins into a sample and then measure the CV and bias of the intensities of those peptides. Spike-in of proteins has the benefit of looking at a small controlled set of peptides and how they behave in the studied system. This strategy has been used in several of the previously mentioned papers that address iTRAQ quantification (11–14). However, the number of data points studied may be unlikely to represent the complexity of a real biological sample, which often contains thousands of proteins (24). In the current study, all peptides detected in a complex human cell line sample (A549) are used to get an estimate of the quantitative accuracy and precision. This experimental setup is hence more similar to a real biomarker discovery study with high complex human proteome samples. The quality of the protein quantifications is compared among several different mass spectrometers in this work; also the influence of different loaded peptide amounts and the use of different methods for sample separation are examined. Factors such as variance and bias of peptide quantification by iTRAQ are systematically evaluated in those high complex samples. Further, methods for improving the protein quantification are investigated; by filtering on the peptide level to remove low quality intensities and by weighting the peptide values to account for the higher risk of errors at low intensities (20).
We have described the factors contributing to bias and variance in protein quantification by iTRAQ labeling. This has generated guidelines for how to estimate the accuracy of protein quantities, which will be an essential tool in both biomarker discovery and studies of biological systems. Based on the results, we suggest an experimental design where each labeling set (e.g., iTRAQ) includes duplicate samples, and we describe how these duplicates are used for calculating peptide weights that can be used in addressing the accuracy of protein quantities. This novel approach is shown to improve protein quantification by iTRAQ in six data sets of A431 cell line samples treated with drug and a clinical data set of lung cancer tissue samples.
EXPERIMENTAL PROCEDURES
Experimental Design
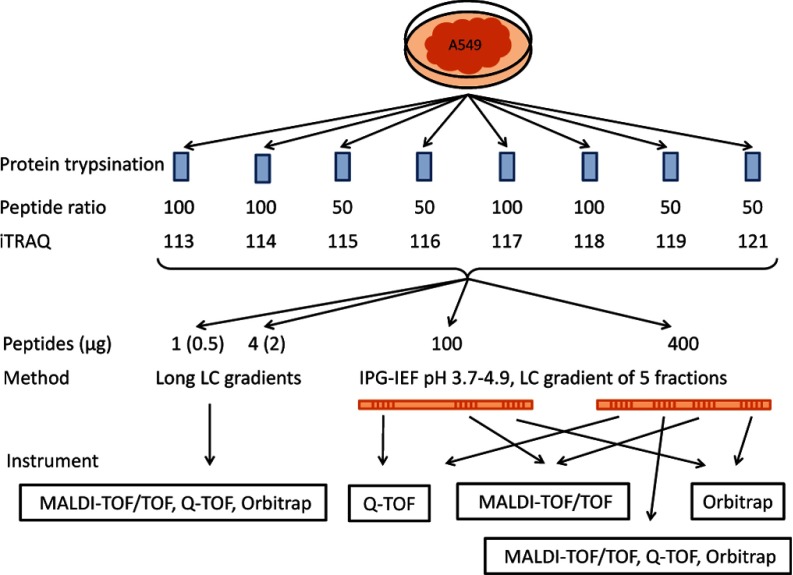
Several mass spectrometry experiments were performed as outlined in Fig. 1. Different loaded peptide amounts were compared as well as different sample separation methods. Mass spectrometry data was acquired using three different instruments (LTQ Orbitrap Velos (Thermo Scientific), 4800 MALDI-TOF/TOF (Applied Biosystems/Sciex, Foster City, CA) and 6350 QTOF (Agilent, Santa Clara, CA). Further, different settings for collision energy for HCD and fragmentation time, as well as the number of target ions, were investigated for the Orbitrap MS setup. Detailed information on experimental procedures is available in supplementary File S1.
Fig. 1.
Experimental outline for standard data set. Tryptic peptides from A549 cells were labeled with iTRAQ in 2:2:1:1:2:2:1:1 ratio. Peptides were analyzed by LC-MS alone or prefractionated before LC-MS using narrow range IPG-IEF, pH 3.7–4.9 strip fractionated into 72 fractions. A mix of all peptides or extracted peptide fractions from the IPG-IEF were analyzed on three different LC-MS platforms. Five fractions out of the 72 were used for the different runs, one fourth of each of the five fractions were injected to the LC. IPG-IEF: immobilized pH gradient isoelectric focusing, pH range 3.7–4.9, peptide μg in parentheses denotes Orbitrap loads.
Cell Line Sample Preparation
Lysates of lung cancer cell line A549 were reduced by dithiothreitol and alkylated by iodoacetamide followed by overnight trypsinization (Promega, Charbonnières, France). Different amounts of peptides at 2:2:1:1:2:2:1:1 ratios were labeled with iTRAQ 8plex tags according to the manufacturer's protocol (Applied Biosystems). iTRAQ labeled peptides were separated by two different methods: a long reverse phase liquid chromatography (LC) gradient or by two dimensional fractionation by immobilized pH gradient - isoelectric focusing (IPG-IEF) on a narrow range pH 3.7–4.9 strip followed by reverse phase LC as described previously (25).
Mass Spectrometry Analysis
A mix of all peptides or extracted peptide fractions from the IPG-IEF were analyzed on three different LC-MS platforms; Thermo Scientific LTQ Orbitrap Velos, ABI 4800 MALDI TOF/TOF and Agilent 6530 QTOF.
Before analysis by LTQ Orbitrap Velos (Thermo Scientific), peptides were separated using an 1200 nano-LC system (Agilent) by a reversed phase C18 column, NTCC-360/100–5-153 (Nikkyo Technos., Ltd). The LTQ Orbitrap Velos was operated in a data dependent manner, selecting five precursors for sequential fragmentation by CID (collision induced dissociation) and HCD (higher-energy collisional dissociation), and analyzed by the Linear iontrap and Orbitrap, respectively. Proteome discoverer 1.1 with Mascot 2.2 (Matrix Science) was used for peptide and protein identifications.
For Nano-LC-MALDI MS/MS analysis on ABI 4800 MALDI-TOF/TOF, peptides were separated on an Ultimate 3000 LC system controlled by Chromeleon software version 6.8 (Dionex/LC Packings, Sunnyvale, CA) coupled to a Probot MALDI spotting device. Peptide identification from the MALDI-TOF/TOF data was carried out using the Paragon algorithm (26) in the ProteinPilot 2.0 software package (Applied Biosystems).
Nano-LC-ESI MS/MS analysis on Agilent 6530 QTOF was carried out using an Agilent 1200 nano-LC system coupled to an Agilent 6530 QTOF equipped with a Chip-Cube controlled by the Masshunter Acquisition software. Peptide identifications from the QTOF data were carried out using the Spectrum Mill Protein Identification software (Agilent).
For comparison between platforms, peptide identifications were performed using Mascot Daemon 2.3.2 with Mascot 2.4 for fractions 32 to 36 from IPG-IEF with 400 μg loaded peptides.
Database and False Discovery Rate
Searches were performed against the IPI database (build 3.64) limited to human sequences (84032 protein entries), allowing two missed cleavages. False discovery rate (FDR) was estimated by searching the data against a database consisting of both forward and reversed sequences and set to <1% at the protein level using MAYU (27). Peptides corresponding to a <1% protein FDR rate were used in the calculations of quantities. iTRAQ reporter ions were corrected for isotope distribution by standard correction factors. For simplicity, iTRAQ reporter ion intensity is referred to as peptide intensity from now on.
Data Preprocessing
All the following data analysis steps were performed in the R programming language (28). Box plots of log2 peptide intensities were established to assess data distribution and global biases between iTRAQ channels. The distributions of missing values over the iTRAQ channels were also investigated. Peptides from keratins were removed, because they might reflect contaminations and thus will have outlying intensities. The peptides were further filtered to include only those with reporter ions present in at least 75% of samples at both ratio levels (2 and 1). The remaining peptide intensities were then used to assess the quantitative accuracy and precision.
Estimating Bias and Variance
The error of peptide quantification was evaluated by root mean square error (RMSE). RMSE reflects a weighted average of the differences between the measured values by mass spectrometry (y2) and the ideal values (y1). To make RMSE independent on signal intensity, the measured values were scaled to be on the same level. The scaling was done by dividing the measured values with the slope of the regression line of measured values versus ideal values. The slope was established by robust linear regression, a regression method not so sensitive to outliers, and called scaling factor.
 |
The resulting scaled RMSE value (RMSEs) can be seen as quantification error in percent, including both variance and bias.
To be able to study the variance only, not including the bias, all peptide intensity data was normalized so that the median peptide intensity was equal between samples. The standard deviation then reflected only the variance in quantification. Relative Standard Deviation (RSD) was calculated as the standard deviation of peptide measurements over all samples divided by the minimum peptide intensity.
The bias was investigated by plotting the iTRAQ peptide ratios against the minimum peptide intensity.
RMSEs was selected for the calculations on the peptide level, calculated over all iTRAQ channels, because we do not want to select a certain iTRAQ channel to create the ratios from, in comparison to the “relative error” which is calculated based on each ratio individually. On the protein level on the other hand, the ratios were already calculated and thus we used the relative error for evaluation of the protein quantification. The relative error was calculated as the deviation of the observed protein ratio from the expected protein ratio divided by the expected ratio. To calculate ratios the intensities were divided by the mean of 113 and 114, the expected ratios are thus 1,1, 0.5, 0.5, 1, 1, 0.5, 0.5 for the 113, 114, 115, 116, 117, 118, 119, and 121 iTRAQ channels respectively. For the evaluation of the cell line data set, duplicate ratios were calculated, for the clinical data set the ratio of internal standards was calculated, and compared with the expected ratio of one.
Protein Quantification
The relative protein quantification was estimated by two methods. Either the peptide values were filtered to remove low peptide intensities, or all peptide values were used and weighted according to their uncertainty (determined by their intensity). Those two methods were also compared with calculating a regular mean or median of all the relative peptide intensities that had been mapped to the same protein.
The weighted mean approach is based on the method developed by Onsongo et al. (20), with some adjustments. This method accounts for the larger variance of low intensity peptides by giving them a smaller weight in the protein quantification according to:
 |
Here N is the number of peptides identifying a protein. To determine the peptide weights, the peptide ratios were sorted from lowest to highest minimum intensity and grouped into bins (supplementary Fig. S1). For each peptide, the deviation of the peptide ratio to expected ratio was calculated, here called error. The weights for the bins were then calculated as one divided by the median error of the peptide ratios within that bin. In the original method by Onsongo et al., the peptide ratios are sorted based on the product of reporter ion intensities and the weight is calculated as one divided by the mean error within each bin. The peptide data used to calculate the weights was from two technical replicates within the iTRAQ setup, and is referred to as the training data. To make sure that the selected training data did not bias the resulting protein quantities, weights were calculated based on all possible ratios of the samples in the iTRAQ setup. Different bin sizes were also compared. The accuracy of the resulting relative protein quantities was evaluated by the relative error.
Quantitative Proteomics Data Set to Test Method
The weighted mean method was evaluated on six data sets of A431 cell line samples treated with drug. The data sets were time series of whole cells and the different subcellular fractions light, medium, and heavy. At each time point, and fraction, there are two replicates. The 113/114 ratio was used as internal training data to calculate the weights in all the data sets. The resulting protein quantities were evaluated based on the relative error of duplicate ratios (expected ratio one). The method was further evaluated on a clinical data set consisting of lung cancer tissue samples (Ethical approval Institut Gustave Roussy, Paris, France, 10 September 2008). The samples were analyzed in three iTRAQ runs; two internal standards were included in two of the runs, four internal standards in one run. The internal standards were used to calculate weights and evaluate the protein quantities.
Algorithm and Data availability
All programs were written in R version 2.14.1. The R code for calculating weights based on duplicates and apply those weights to calculate weighted proteins quantities, as well as the code for generating Fig. 6 and corresponding excel Table is available in supplementary File S7. The next version of PQPQ (protein quantification and peptide quality control) (29) will include the option to calculate weighted protein quantities according to the herein described method. The MS raw data files from the standard dataset (Fig. 1) may be downloaded from ProteomeCommons.org Tranche using the following hash:
Fig. 6.
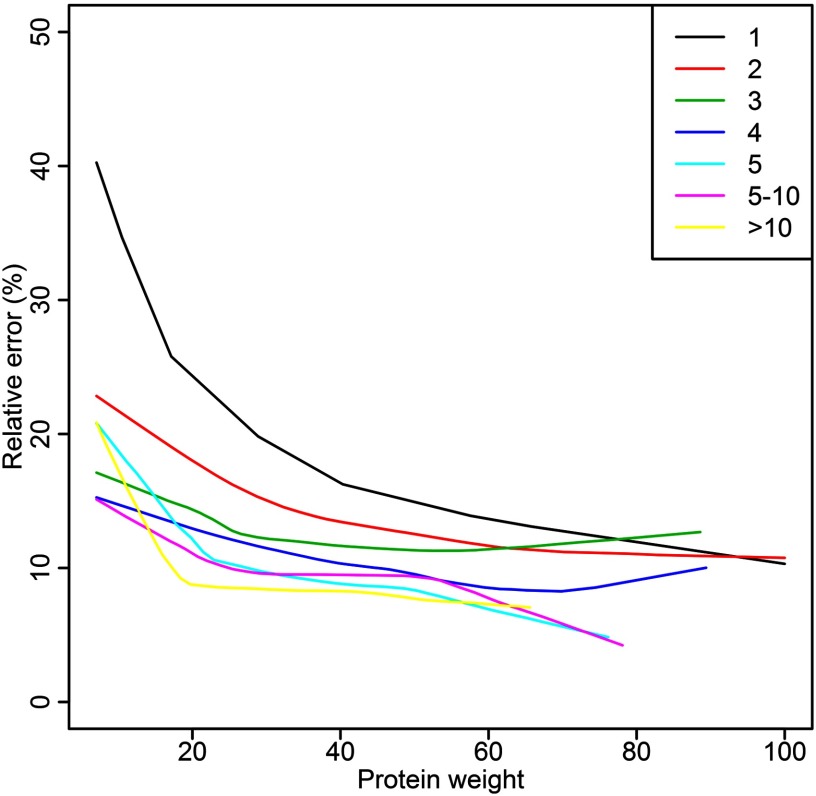
Impact of the number of peptides per protein on quantification. The relative error of weighted protein quantity in percentage is plotted against protein weight for proteins with different number of peptides. The figure is based on Orbitrap data using 400 μg loaded peptide amount and prefractionation by IPG-IEF. Lines represent smoothed 95% upper limit of relative error, see Fig. 2 for definition. The protein weight is calculated as the mean of peptide weights.
cMuJmOgapaGcyIVZJZ4Wdcf9cfWx/ab2IPNISd1e3RyCQo6e4 PMwvpqRZ2BSgoHN7Iiq6nm6YYX8pHAdKX3UDhZnzvIAAAAAAAb0 × g = =
RESULTS
Peptide and Protein Identification
The experimental outline for the standard data set can be seen in Fig. 1 and the results from the LC-MS/MS analysis of all the samples and instrumental setups are reported in Table I and supplementary Table S1. Table I presents the number of peptide and protein identifications for the three instruments by using the Mascot search engine. The corresponding numbers generated by using the MS vendor provided search engines are presented in supplementary Table S1. Peptide and protein data for all experiments can be found in supplementary Files S3, S4, and S5. Increasing the amount of loaded peptides fourfold increased the number of identified peptides and proteins in all settings except for the long LC gradient (240 min) on Orbitrap. Analyzing five fractions out of the 72 from IPG-IEF with a 45 min gradient yielded more identifications than running a 240 min LC-gradient. This data shows that generally, increased sample amount and fractionation enable a more diverse set of potentially low abundant peptides to be identified. The number of identified peptides varied largely with the mass spectrometry instrument, the Orbitrap generated more than five times as many identifications as the MALDI and QTOF. The approach resulting in the largest number of identifications and quantifications was the 400 μg loaded peptide amount, IPG-IEF prefractionated samples ran on the Orbitrap. In the following sections, the results will first be presented for that setup, followed by a comparison to the other approaches.
Table I. Comparison of instruments. The table presents the number of PSMs, unique peptide readings, and number of proteins identified with the different instruments using Mascot search engine at 1% protein FDR. IPG-IEF, immobilized pH gradient isoelectric focusing; PSM, peptide spectrum match; The table is based on IPG-IEF using 400 μg loaded peptide amount, analyzing fractions 32–36 with a 45 min LC gradient.
| Instr. | Identification |
Quantification |
||
|---|---|---|---|---|
| PSM | PSM | Peptides | Proteins | |
| Orbitrap | 19512 | 11022 | 4153 | 2453 |
| MALDI | 1074 | 1039 | 816 | 620 |
| QTOF | 1818 | 1765 | 290 | 238 |
RMSEs of Peptide Quantification
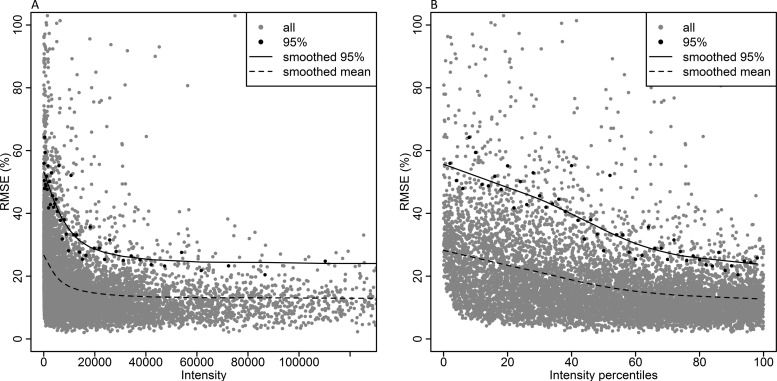
The quality of the peptide quantification was evaluated by scaled root mean square error (RMSEs). The RMSEs includes both bias and variance and measures the average magnitude of the error per peptide over all eight iTRAQ channels. The RMSEs values were plotted against the reporter ion with the smallest signal intensity of the eight iTRAQ channels, see Fig. 2. The complete scatter in gray shows the full spread of RMSEs values related to intensity, highlighted in black, are the values at the 95% upper limit of RMSEs. Each black highlighted point is calculated from the RMSEs values within intervals of 2% of the intensity values (intensity percentiles). Hence, each highlighted point is based on the same number of RMSEs measurements. A running median LOESS (locally weighted polynomial regression) smoother (30) of the highlighted values was used to plot the smoothed curves. The results were evaluated at the 95% upper limit of RMSEs rather than the mean. The mean reflects the full spread of errors for certain intensity and is not so informative for setting the lower intensity limit of quantification. By using the 95% upper limit, most RMSEs values are included while still excluding the most outlying measurements. As seen by the smoothed RMSEs curves in Fig. 2, the error in quantitation is intensity dependent and decreases as the peptide intensity increases.
Fig. 2.
RMSEs is dependent on peptide intensity. RMSEs values are plotted against the reporter ion with the smallest iTRAQ signal intensity of the eight channels. All RMSEs measurements are shown in gray, the 95% upper limit of RMSEs values are highlighted in black and a running median LOESS smoother for the highlighted values is shown by the black solid line. A running median LOESS smoother for the mean values is shown by the black dotted line. In A the x axis is proportional to the raw intensity values, in B the x axis is scaled according to the data distribution. Intensity percentile 50 represents 50% of the data points, regardless of the raw intensity at that point.
Variance of Peptide Quantities
The measurements of error estimated by RMSEs include both variance and bias. If no bias exists, the RMSEs will match the standard deviation. To be able to study only the variance in the peptide quantifications, the peptide intensities were normalized to equal sample median. Normalization of the samples to equal median results in a loss of the 1:2 relations between iTRAQ channels in this setup. For the normalized data, the RSD per peptide over the eight iTRAQ channels was calculated. RSD was plotted against the minimum signal intensity (supplementary Fig. S2). The RSD was overall smaller than RMSEs showing that we have a bias in the un-normalized data. RSD and RMSEs shows the same trend with decreasing RSD when intensity increases.
Bias of iTRAQ Peptide Ratios
To assess bias of iTRAQ ratios, all possible iTRAQ ratios of high versus low level (2:1) were related to minimum signal intensity. There was a slight bias in all ratios, independent on intensity level. The bias seems to be stabilizing at around +-5% from the expected ratio of two. For ratios with 115, 116, and 119 as denominators (113/115, 114/115, 117/115, 118/115, 113/116, 114/116, 117/116, 118/116, 113/119, 114/119, 117/119, and 118/119) the mean ratio is 1.9. For ratios with 121 as denominator (113/121, 114/121, 117/121, and 118/121) the mean ratio is 2.1. The fold change for all peptides was calculated and related to minimum peptide signal intensity (supplementary Fig. S3). A bias toward one can be seen independent on intensity level; the mean fold change is stabilizing at around 1.9, which is 5% under the expected fold change of two. What also can be seen from the ratio and fold change plots is that the upper limit of detection (saturation) is not reached in this experiment; the intensity is still linear at the maximum measurements.
Comparison between Experiments on Peptide Level
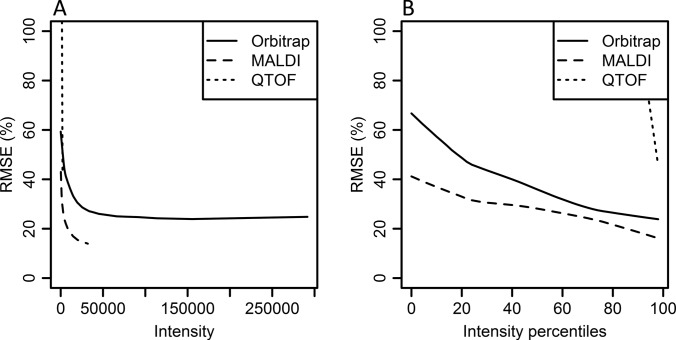
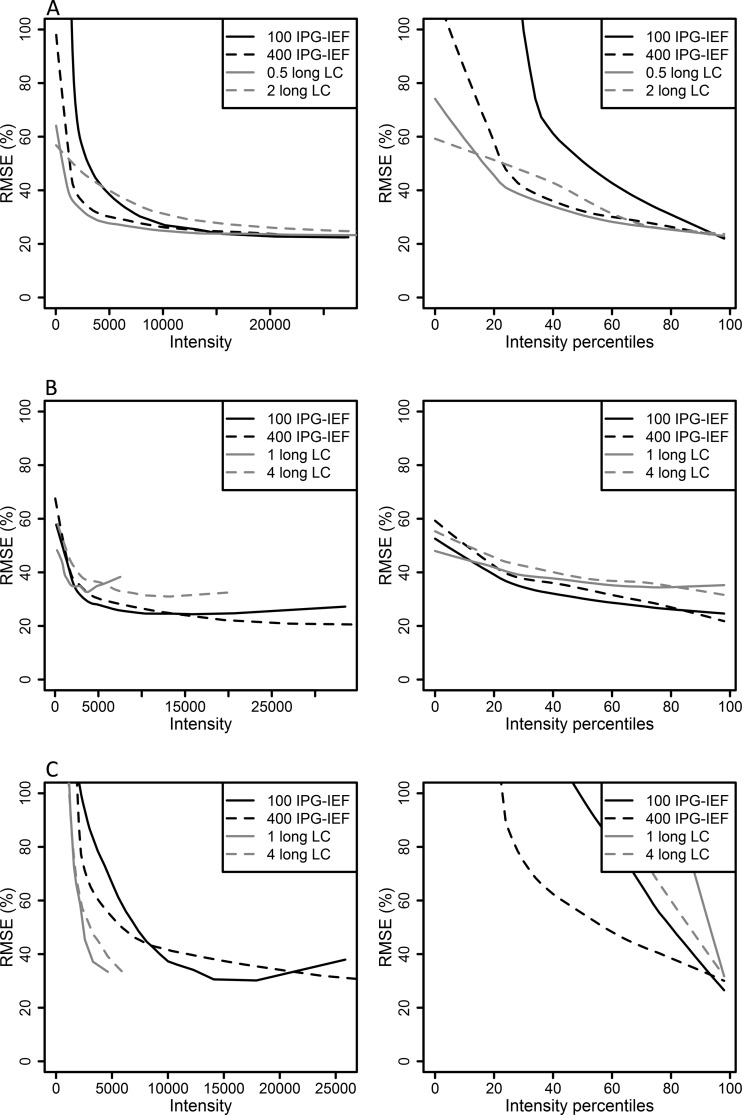
RMSEs was calculated to compare instruments, loaded peptide amount, and separation method. The resulting RMSEs values can be seen in Figs. 3 and 4 as well as in supplementary Fig. S4. In Fig. 3, comparing instrument data processed by Mascot search engine, the peptide quantities from the Orbitrap and MALDI have rather similar RMSEs values, whereas QTOF peptide quantities have much higher RMSEs values. Fig. 4 reveals that the RMSEs values are improved for Orbitrap and QTOF by using higher peptide amount and prefractionation by IPG-IEF. In contrast, MALDI is not so dependent on loaded peptide amount and separation method.
Fig. 3.
Comparison of RMSEs for instruments. RMSEs values are plotted against minimum iTRAQ reporter intensity for the different instruments used in this study. In A, the x axis is proportional to the raw peptide intensity values, in B, the x axis is scaled according to the data distribution. Intensity percentile 50 represents 50% of the data points, regardless of the raw intensity at that point. Lines represent smoothed 95% upper limit of RMSEs, see Fig. 2 for definition. Data from all three instruments are processed by Mascot search engine.
Fig. 4.
Comparison of RMSEs for loaded peptide amount and separation method. RMSEs values are plotted against minimum iTRAQ reporter intensity for the different experimental settings tested in this study. Black lines represent pre-fractionation by narrow range IPG-IEF, pH 3.7–4.9, solid lines are for 100 μg loaded peptide amount and dotted lines for 400 μg loaded peptide amount. Five of the 72 fractions extracted from the IPG-IEF strip were analyzed using 45 min gradients. Gray lines represent long LC gradient (240 min), solid lines are for 1 μg loaded peptide amount (0.5 μg for Orbitrap) and dotted lines for 4 μg loaded peptide amount (2 μg for Orbitrap). In A, are results from Orbitrap, in B from MALDI and in C from QTOF. In the left panel the x axis is proportional to the raw intensity values, in the right panel the x axis is scaled according to the data distribution. Intensity percentile 50 represents 50% of the data points, regardless of the raw intensity at that point. Lines represent smoothed 95% upper limit of RMSEs, see Fig. 2 for definition. Data is processed by the MS vendor provided search engines.
To study the dependence of iTRAQ quantification on peptide fragmentation, normalized collision energy (NCE) and fragmentation time was varied in the Orbitrap (supplementary Tables S2, S3, and supplementary Fig. S5). Optimal setting of NCE is a tradeoff between RMSEs for peptide quantities and number of identifications. In our view, for our instrument, NCE of 37.5 seems to give a good balance. Increasing the fragmentation time from 30 ms to 100 ms results in a slight decrease in the number of peptide spectrum matches (PSMs) for identification and similar RMSEs for quantification. Stepped fragmentation was recently introduced, enabling separate fragmentation at different collision energies and then combined analysis in the Orbitrap. Based on the above results, 35 and 50 was chosen to represent optimal NCE for identification and quantification respectively. Results from the stepped HCD are presented in supplementary Table S4 and supplementary Fig. S6. Stepped HCD slightly decrease RMSEs but it also decrease the number of identified HCD spectra, by ∼10–15%, compared with our standard method of using NCE 37.5.
Protein Quantification Method
In this study, two alternative approaches for combining the iTRAQ peptide data to compute a reliable protein ratio were compared: a weight approach based on peptide intensity and a filtering approach excluding low intensity peptides before calculation of protein quantities. The weights were calculated based on an internal training data and then applied to calculate weighted protein ratios in the standard data set; 113/mean(113,114), 114/mean(113,114), 115/mean(113,114), 116/mean(113,114), 117/mean(113,114), 118/mean(113,114), 119/mean(113,114), and 121/mean(113,114). To rule out possible bias depending on which iTRAQ channels that were chosen for the weight calculation, all possible iTRAQ ratios were used as training set to calculate weights. The resulting protein quantities were independent on which training ratios that was used (supplementary Figs. S7 and S8). Because no difference was seen between the training data, the following weight calculations were based on using 113/114 as an internal training set. The effect of the size of the peptide intensity bins used for weight calculation was also analyzed. The results showed that the bin size 100 to 1000 peptide measurements in each bin does not affect the quality of the resulting protein quantities (data not shown). The largest bin size (eight bins in total, around 1000 peptides in each bin) was selected to speed up calculations as well as to make sure experiments with fewer peptides identified will have enough number of peptides in each bin. For the filtering approach the threshold was set at 10,000 raw peptide intensity signal to exclude peptide measurements with more than 40% RMSEs (25% RSD) (Figs. 2 and supplementary Fig. S2).
Evaluation of Protein Quantities
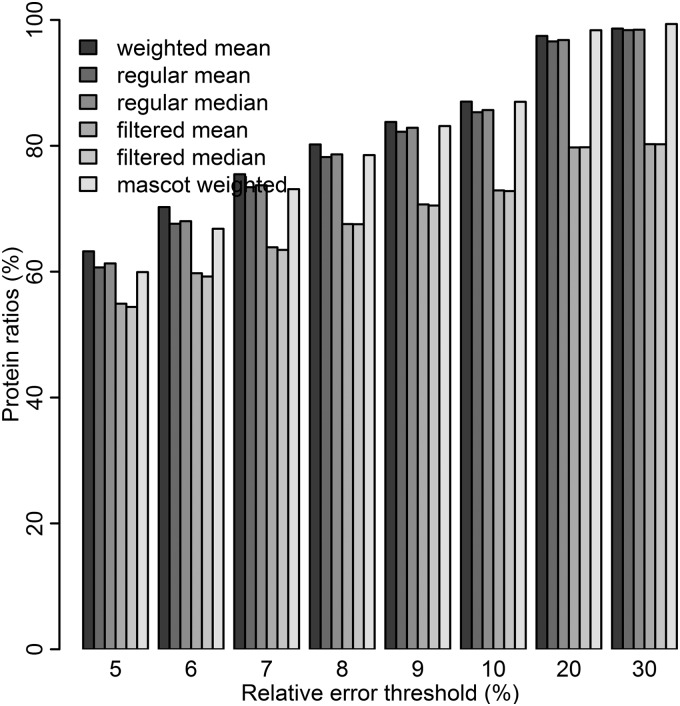
The weighted mean method was compared with filtering out low intensity peptides before calculating a regular mean, as well as to using all peptides for the calculation of a regular mean. Moreover the method was compared with the weighted mean method in Mascot. The measured protein ratios were compared with the expected ratios and the relative error was calculated for all protein quantification approaches (Fig. 5). The weighted mean method shifts protein quantities to lower errors and generate more accurate protein quantities than the regular mean/median and filtered mean/median does (Fig. 5). It can be seen in Fig. 5 that more proteins are calculated with a lower relative error when using the weighted mean as compared with the other methods. In Fig. 6, the relative error of protein quantity is related to protein weight (calculated as the mean of peptide weights) for proteins with different number of peptides. Seen in the figure, the relative error of the protein quantity is very much dependent on the number of peptides used for quantification of the protein. For proteins with few peptides, the intensity of the peptides (visualized by protein weight) influence the relative error strongly, while for proteins with large number of peptides the intensity of the peptides has smaller impact on error. Even at low protein weight the relative error is rather small for proteins with multiple peptides for quantification. The results from Fig. 6 could be used to set a lower threshold on protein weight for accurate protein quantification. The same kind of plot was generated for ratios 117/114 and 118/114 (same level as 113). The resulting figure (supplementary Fig. S9) confirms that 113/114 have a behavior similar to the other ratios at the same level, 117/114 and 118/114, and is hence representative for the relationship between relative error and protein weight in this data set.
Fig. 5.
Comparison of methods to calculate protein quantities based on peptides. The bars represent percentage of protein ratios passing different relative error thresholds, for weighted protein mean, regular protein mean/median, filtered protein mean/median, and Mascot weighted protein mean. Proteins with one peptide are excluded from the comparison because weighting will not affect those proteins.
For assessment, the weighted mean method presented in this study was compared with the weighted mean method described by Onsongo et al. (20), which revealed no difference between the methods when applied to the standard dataset in this study (data not shown), but a slight improvement when applied to the clinical lung cancer dataset (supplementary Fig. S10). The approach of using an internal training set to calculate weights was furthermore compared with training the weights on an external dataset (supplementary Fig. S10).
Comparison between Experiments on Protein Level
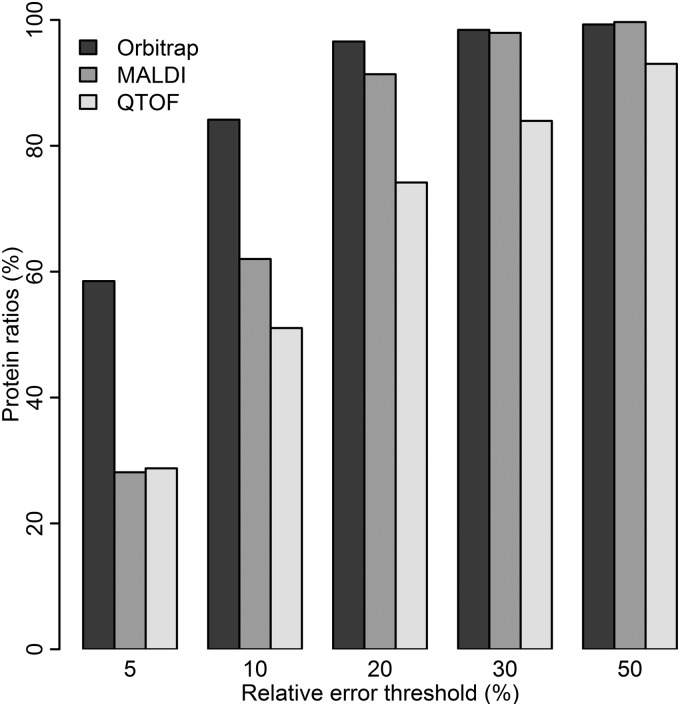
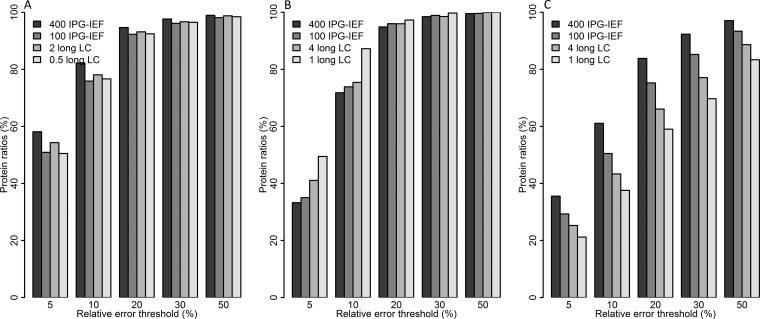
Because it was confirmed that the 113/114 ratio is representative for the other ratios in the experiment, the 113/114 ratio was used to calculate weighted protein ratios for all the other experimental settings. The relative error for protein ratios were calculated and compared between settings. The results mainly confirm the results from the comparison on the peptide level; the Orbitrap performs best followed by MALDI, and then QTOF (Fig. 7 and supplementary Fig. S11). When it comes to loaded peptide amount and separation method, the Orbitrap performs best with the largest loaded peptide amount and prefractionation by IPG-IEF, the same is true for the QTOF, whereas the MALDI seem to perform slightly better with the smallest loaded peptide amount and a long LC gradient instead (Fig. 8). Once again the number of proteins quantified is very different for the three instruments, more than 2400 proteins were quantified by the Orbitrap whereas only around 600 proteins were quantified by MALDI and 240 by QTOF (Table I).
Fig. 7.
Comparison of relative error for instruments. The bars represent percentage of weighted protein ratios passing different relative error thresholds, for the different instruments used in this study. The amount of loaded peptides is 400 μg and samples are prefractionated by IPG-IEF for all the three instruments. Data from all instruments are processed by Mascot search engine.
Fig. 8.
Comparison of relative error for loaded peptide amount and separation method. The bars represent percentage of weighted protein ratios passing different relative error thresholds, for the different experimental settings tested in this study. Fig. A depicts results from Orbitrap, B from MALDI, and C from QTOF. Data is processed by the MS vendor provided search engines.
Application of the Method to Independent Data Sets
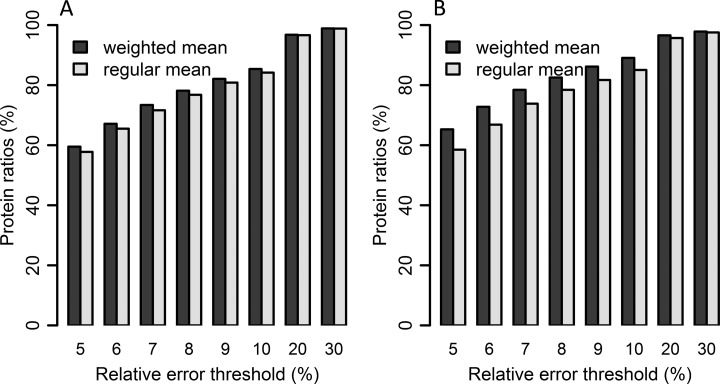
The method of calculating weights based on an internal training set was also applied to independent data sets of A431 cell line samples and lung cancer tissue samples. The weights were used to calculate weighted protein ratios of all duplicates in the A431 experiment, as well as to calculate weighted protein ratios of internal standards in the lung cancer experiment. The relative error of the weighted protein ratios were calculated and compared with using a regular mean over the peptides for calculating the protein ratio (Fig. 9 and supplementary Fig. S12). As seen in the figures, the weighted mean performs slightly better than the regular mean for the tested data sets, confirming the results from the original standard data set. To further facilitate the use of protein weights to evaluate and filter the protein ratio data, a table containing the weighted protein ratios, protein weights, number of peptides, and the relative error was created (see example output table from the A431 data set in supplementary File S6). The relative error estimation was based on the smoothed LOESS curves in supplementary Fig. S12. The relative error can thus be used as a guide to assess protein quantification reliability, and corresponding protein weight can be applied to filter proteins.
Fig. 9.
Weighted mean method applied to biological data sets. In A is a comparison of protein quantities for the A431 cell line dataset calculated by weighted mean and regular mean. The results are from 0, 2, 6, and 24 h of whole cell lysate of A431 cell line samples post drug treatment. In B, the protein quantities for the lung cancer dataset are compared. The bars represent percentage of protein ratios passing different relative error thresholds, for weighted protein mean and regular protein mean. Proteins with one peptide are excluded from the comparison because weighting will not affect those proteins.
DISCUSSION
Reliable quantitative data is essential in biomarker discovery and to interpret proteome biology. The purpose of this study was to generate a basis for the decision of what protein quantities are reliable and find a way for accurate and precise protein quantification by isobaric labeling. To investigate this we have used thousands of peptide measurements to estimate variance and bias for quantification by iTRAQ mass spectrometry in complex human cell line samples. Based on the results, we have suggested a concept for experimental design and a methodology to assess protein quantification.
In MS based proteomics experiments, it is beneficial to have as good protein coverage as possible for robust identification. For quantification, only identified peptides with accurate quantitative measurements should be included. Variance stabilizing methods might give peptides a more homogeneous variance but the actual uncertainty in the quantitative measurement remains (12). Further, a constant variance across all proteins can probably not be expected in a complex human sample. A filter can be used to exclude peptides with intensity below certain threshold, regarded as more uncertain in terms of quantification (17, 18). However, filtering out low intensity peptides will decrease the number of proteins analyzed, by ∼20% in the current data set. On the other hand, it is crucial for the results that the quantitative information on the peptide level is correct when summarizing to protein level quantity. We have in this study evaluated two alternative methods to improve protein quantities: either by removing low intensity peptides before summarizing to protein quantity or by using all peptides but weight them according to their uncertainty (determined by their absolute intensity) when summarizing to protein quantity.
The weighted mean method, which accounts for errors introduced by low intensity peptides, was adopted from Onsongo et al. (20) with some changes. In the original method, the weight of a bin is calculated as one divided by the mean error for peptides within that bin. In our study, the median error of peptides in the bin is instead used to calculate the weight, because the median is less sensitive to outlying measurements than the mean. In the current study, the weight is related to the minimum peptide intensity, instead of the product of reporter ion intensities, because this represents the most uncertain measurement in the ratio. The changes in the method improved the protein quantities when applied to an independent clinical data set of lung cancer tissue samples. In the current study, the weight is calculated based on an internal training set (technical duplicate) for each run rather than an external training set. An internal training set for the weights is to prefer, according to our results, because different experimental settings for the MS analysis will affect the data quality differently, as is clearly shown in this study. The intensities and RMSEs values differ between experimental runs, so weights and limits on accuracy and precision based on one study might not be transferable to the next study. As an outcome of these results on experimental planning, we suggest including one technical duplicate in each iTRAQ run so weights can be calculated specifically for every new data set, and then be applied to the remaining biological iTRAQ samples.
The comparison of the performance of weighted mean, regular mean and a filtered mean for protein quantification revealed that the protein quantities calculated from weighted mean have smaller relative error than protein quantification by calculating the regular mean. The improvement is rather modest, around 5% for the clinical data set of lung cancer tissue samples. Still, we believe this is an important improvement, it corresponds to around 90 more proteins in the clinical data set with accurate quantification (<5% relative error), which can be essential for discovering biomarkers. For protein quantification by filtering out low intensity peptides, filtering out almost half of the peptides with raw intensity below 10,000 (40% RMSEs), the relative error at the protein level is not improved. It seems like even if low intensity peptides have larger RMSEs values than high intensity peptides, they distribute around the true value and thus contribute to create a stable protein quantity. The result also shows that the relative error of protein quantity is largely dependent on the number of peptides used for protein ratio calculation (Fig. 6). For proteins with few peptides for quantification there is a strong dependence on the peptide intensity level (reflected by the protein weight). However, for proteins with many peptides the intensity of the peptides has smaller impact on the error. Even at low protein weight the relative error is rather small for proteins with multiple peptides for quantification. Hence, peptides with low intensity can be important for creating a robust protein quantity, this is another reason for not setting a peptide intensity filter. At the peptide level, around 50% of the Orbitrap data has a RMSEs of maximum 40%, this translates to an error at the protein level below 5% for around 50% of all protein ratios (Figs. 2 and 5). This is in line with our previous observations when studying the distribution of ratios between replicates (data not shown).
To assess the confidence of the quantification, we have used RMSEs and relative error rather than CV used by many others (11, 12). RMSEs and relative error includes both bias and variance and thus reflects the full uncertainty in the raw measurements. In our settings, the variance seems to be the largest contributor to the error (Figs. 2 and S2). A small bias (around 5%) toward one could be seen in this study, confirming the results of others (11–14). In a “real” biological study we aim to even out the biases from sample preparation and labeling by normalization to equal mean or median of peptide intensities. This is based on the assumption that the samples are similar in terms of protein distribution. This procedure also evens out biases from the instrumental analysis to some extent. Hence, we can assume that most contributions to the bias are reduced in the standard data analysis workflow, and the variance evaluated here represents the error also in a real biological study.
A comparison between instruments revealed similar RMSEs for Orbitrap and MALDI, whereas QTOF overall had higher RMSEs for the peptide quantification. This result probably reflects the energy regime used by the different instruments, MALDI have a similar high energy regime for fragmentation as the Orbitrap whereas the QTOF has a lower collision energy. A large difference is also seen in the number of peptides and proteins identified, Orbitrap identifies approximately four times more proteins than the other instruments do. Increasing the amount of loaded peptides as well as prefractionating the sample by IPG-IEF results in the best performance for the Orbitrap, both when it comes to error levels at the peptide and protein level as well as number of identified peptides and proteins. According to the results in this study, the suggested optimal settings for the Orbitrap would be a normalized collision energy of 37.5, a fragmentation time of 30 ms, and 50,000 as the number of target ions. These values may vary between instruments but can serve as a starting point for optimization.
In the original standard data set the peptide ratios are the same over the iTRAQ channels, consequently even peptides wrongly assigned to a protein will produce the correct protein ratio. In a real biological data set this is of course not the case because each iTRAQ channel represents a different biological sample. For this reason we also evaluated the approach on independent cell line and clinical data sets where protein quantification was improved by using the internal duplicate to calculate weights and relative error (Fig. 9).
The result from the current study is a guideline to assess the quality of protein quantities. Because of the large variation between different experimental settings, we suggest calculating the peptide weights and setting the limits in each study individually, based on a technical duplicate within the experiment. The protein ratios are then calculated based on the weighed peptide intensities to generate more accurate protein quantities (with smaller relative error). We suggest that a plot, like the one in Fig. 6, and corresponding table (supplementary File S6) are created for each data set based on the duplicate in the experiment. The plot can, together with the table, be used to set a threshold on protein weights to ascertain reliable protein ratios. This will be especially important for proteins with one or a few peptides for quantification. Generally, small proteins with fewer peptides detected as well as low abundant proteins have the largest relative errors and thus represent the biggest challenge when it comes to reliable protein quantification. By this approach, the accepted level of relative error can be set based on the experimental conditions and biological questions asked. By setting a limit on the protein weights rather than at the peptide intensity, we avoid the risk of excluding peptides important for accurate protein quantification as well as the problem of adjusting to different intensity ranges between experiments. Besides the possible application to other data sets, the method should also easily be transferred to both other labeling methods such as TMT as well as to label free mass spectrometry methods. For label free methods, the calculation of weights rely on good overlap between duplicate runs. A recent study in our group has shown around 84% overlap of peptide identifications and a 98% correlation of peptide quantities for technical duplicates, Sandberg et al. manuscript in preparation.
We have in this study developed a methodology for improved protein quantification in shotgun proteomics. The suggested experimental design and developed algorithms decrease the relative protein quantification error in the analysis of complex biological samples. Further, this methodology allows quality control of protein data and guide assessment of quantification reliability for proteins with few peptides. This is highly important in analyzing biological samples, as in biomarker discovery, where we seek for quantitative differences between samples.
Supplementary Material
Footnotes
* This project has gained financial support from Karolinska Institutet (KID-funding), Swedish research council, Swedish cancer Society, the Cancer Society in Stockholm and FP7 EU project GlycoHit.
 This article contains supplemental Figs. S1 to S12 and Tables S1 to S4.
1 The abbreviations used are:
- iTRAQ
- isobaric tags for relative and absolute quantification
- SILAC
- stable isotope labeling by amino acids in cell culture
- CV
- coefficient of variance
- PSM
- peptide spectrum match
- HCD
- higher-energy collisional dissociation
- CID
- collision induced dissociation
- FDR
- false discovery rate
- PQPQ
- protein quantification by peptide quality control
- RMSE
- root mean square error
- RMSEs
- scaled root mean square error
- RSD
- relative standard deviation.
REFERENCES
- 1. Beck M., Schmidt A., Malmstroem J., Claassen M., Ori A., Szymborska A., Herzog F., Rinner O., Ellenberg J., Aebersold R. (2011) The quantitative proteome of a human cell line. Mol. Syst. Biol. 7, 549. [DOI] [PMC free article] [PubMed] [Google Scholar]
- 2. Geiger T., Wehner A., Schaab C., Cox J., Mann M. (2012) Comparative proteomic analysis of eleven common cell lines reveals ubiquitous but varying expression of most proteins. Mol. Cell. Proteomics 11, M111.014050. [DOI] [PMC free article] [PubMed] [Google Scholar]
- 3. Nagaraj N., Wisniewski J. R., Geiger T., Cox J., Kircher M., Kelso J., Pääbo S., Mann M. (2011) Deep proteome and transcriptome mapping of a human cancer cell line. Mol. Syst. Biol. 7, 548. [DOI] [PMC free article] [PubMed] [Google Scholar]
- 4. Arabi A., Ullah K., Branca R. M., Johansson J., Bandarra D., Haneklaus M., Fu J., Ariës I., Nilsson P., Den Boer M. L., Pokrovskaja K., Grander D., Xiao G., Rocha S., Lehtiö J., Sangfelt O. (2012) Proteomic screen reveals Fbw7 as a modulator of the NF-kappaB pathway. Nat. Commun. 3, 976. [DOI] [PMC free article] [PubMed] [Google Scholar]
- 5. Bantscheff M., Schirle M., Sweetman G., Rick J., Kuster B. (2007) Quantitative mass spectrometry in proteomics: a critical review. Anal. Bioanal. Chem. 389, 1017–1031 [DOI] [PubMed] [Google Scholar]
- 6. Ong S. E., Mann M. (2005) Mass spectrometry-based proteomics turns quantitative. Nat. Chem. Biol. 1, 252–262 [DOI] [PubMed] [Google Scholar]
- 7. Gygi S. P., Rist B., Gerber S. A., Turecek F., Gelb M. H., Aebersold R. (1999) Quantitative analysis of complex protein mixtures using isotope-coded affinity tags. Nat. Biotechnol. 17, 994–999 [DOI] [PubMed] [Google Scholar]
- 8. Ross P. L., Huang Y. N., Marchese J. N., Williamson B., Parker K., Hattan S., Khainovski N., Pillai S., Dey S., Daniels S., Purkayastha S., Juhasz P., Martin S., Bartlet-Jones M., He F., Jacobson A., Pappin D. J. (2004) Multiplexed protein quantitation in Saccharomyces cerevisiae using amine-reactive isobaric tagging reagents. Mol. Cell. Proteomics 3, 1154–1169 [DOI] [PubMed] [Google Scholar]
- 9. Ong S. E., Blagoev B., Kratchmarova I., Kristensen D. B., Steen H., Pandey A., Mann M. (2002) Stable isotope labeling by amino acids in cell culture, SILAC, as a simple and accurate approach to expression proteomics. Mol. Cell. Proteomics 1, 376–386 [DOI] [PubMed] [Google Scholar]
- 10. Duncan M. W., Aebersold R., Caprioli R. M. (2010) The pros and cons of peptide-centric proteomics. Nat. Biotechnol. 28, 659–664 [DOI] [PubMed] [Google Scholar]
- 11. Mahoney D. W., Therneau T. M., Heppelmann C. J., Higgins L., Benson L. M., Zenka R. M., Jagtap P., Nelsestuen G. L., Bergen H. R., Oberg A. L. (2011) Relative quantification: characterization of bias, variability and fold changes in mass spectrometry data from iTRAQ-labeled peptides. J. Proteome Res. 10, 4325–4333 [DOI] [PMC free article] [PubMed] [Google Scholar]
- 12. Karp N. A., Huber W., Sadowski P. G., Charles P. D., Hester S. V., Lilley K. S. (2010) Addressing accuracy and precision issues in iTRAQ quantitation. Mol. Cell. Proteomics 9, 1885–1897 [DOI] [PMC free article] [PubMed] [Google Scholar]
- 13. Wang H., Alvarez S., Hicks L. M. (2012) Comprehensive comparison of iTRAQ and label-free LC-based quantitative proteomics approaches using two Chlamydomonas reinhardtii strains of interest for biofuels engineering. J. Proteome Res. 11, 487–501 [DOI] [PubMed] [Google Scholar]
- 14. Ow S. Y., Salim M., Noirel J., Evans C., Rehman I., Wright P. C. (2009) iTRAQ underestimation in simple and complex mixtures: “the good, the bad and the ugly”. J. Proteome Res. 8, 5347–5355 [DOI] [PubMed] [Google Scholar]
- 15. Bantscheff M., Boesche M., Eberhard D., Matthieson T., Sweetman G., Kuster B. (2008) Robust and sensitive iTRAQ quantification on an LTQ Orbitrap mass spectrometer. Mol. Cell. Proteomics 7, 1702–1713 [DOI] [PMC free article] [PubMed] [Google Scholar]
- 16. Griffin T. J., Xie H., Bandhakavi S., Popko J., Mohan A., Carlis J. V., Higgins L. (2007) iTRAQ reagent-based quantitative proteomic analysis on a linear ion trap mass spectrometer. J. Proteome Res. 6, 4200–4209 [DOI] [PMC free article] [PubMed] [Google Scholar]
- 17. Hu J., Qian J., Borisov O., Pan S., Li Y., Liu T., Deng L., Wannemacher K., Kurnellas M., Patterson C., Elkabes S., Li H. (2006) Optimized proteomic analysis of a mouse model of cerebellar dysfunction using amine-specific isobaric tags. Proteomics 6, 4321–4334 [DOI] [PMC free article] [PubMed] [Google Scholar]
- 18. Lin W. T., Hung W. N., Yian Y. H., Wu K. P., Han C. L., Chen Y. R., Chen Y. J., Sung T. Y., Hsu W. L. (2006) Multi-Q: a fully automated tool for multiplexed protein quantitation. J. Proteome Res. 5, 2328–2338 [DOI] [PubMed] [Google Scholar]
- 19. Gan C. S., Chong P. K., Pham T. K., Wright P. C. (2007) Technical, experimental, and biological variations in isobaric tags for relative and absolute quantitation (iTRAQ). J. Proteome Res. 6, 821–827 [DOI] [PubMed] [Google Scholar]
- 20. Onsongo G., Stone M. D., Van Riper S. K., Chilton J., Wu B., Higgins L., Lund T. C., Carlis J. V., Griffin T. J. (2010) LTQ-iQuant: A freely available software pipeline for automated and accurate protein quantification of isobaric tagged peptide data from LTQ instruments. Proteomics 10, 3533–3538 [DOI] [PMC free article] [PubMed] [Google Scholar]
- 21. Li Z., Adams R. M., Chourey K., Hurst G. B., Hettich R. L., Pan C. (2012) Systematic Comparison of Label-Free, Metabolic Labeling, and Isobaric Chemical Labeling for Quantitative Proteomics on LTQ Orbitrap Velos. J. Proteome Res. 11, 1582–1590 [DOI] [PubMed] [Google Scholar]
- 22. Domon B., Aebersold R. (2010) Options and considerations when selecting a quantitative proteomics strategy. Nat. Biotechnol. 28, 710–721 [DOI] [PubMed] [Google Scholar]
- 23. White F. M. (2011) The potential cost of high-throughput proteomics. Sci. Signal. 4, pe8. [DOI] [PubMed] [Google Scholar]
- 24. Prakash A., Piening B., Whiteaker J., Zhang H., Shaffer S. A., Martin D., Hohmann L., Cooke K., Olson J. M., Hansen S., Flory M. R., Lee H., Watts J., Goodlett D. R., Aebersold R., Paulovich A., Schwikowski B. (2007) Assessing bias in experiment design for large scale mass spectrometry-based quantitative proteomics. Mol. Cell. Proteomics 6, 1741–1748 [DOI] [PubMed] [Google Scholar]
- 25. Eriksson H., Lengqvist J., Hedlund J., Uhlen K., Orre L. M., Bjellqvist B., Persson B., Lehtiö J., Jakobsson P. J. (2008) Quantitative membrane proteomics applying narrow range peptide isoelectric focusing for studies of small cell lung cancer resistance mechanisms. Proteomics 8, 3008–3018 [DOI] [PubMed] [Google Scholar]
- 26. Shilov I. V., Seymour S. L., Patel A. A., Loboda A., Tang W. H., Keating S. P., Hunter C. L., Nuwaysir L. M., Schaeffer D. A. (2007) The Paragon Algorithm, a next generation search engine that uses sequence temperature values and feature probabilities to identify peptides from tandem mass spectra. Mol Cell Proteomics 6, 1638–1655 [DOI] [PubMed] [Google Scholar]
- 27. Reiter L., Claassen M., Schrimpf S. P., Jovanovic M., Schmidt A., Buhmann J. M., Hengartner M. O., Aebersold R. (2009) Protein identification false discovery rates for very large proteomics data sets generated by tandem mass spectrometry. Mol. Cell. Proteomics 8, 2405–2417 [DOI] [PMC free article] [PubMed] [Google Scholar]
- 28. Ihaka R., Gentleman R. (1996) R: A language for data analysis and graphics. J. Computat. Graphical Statistics 5, 299–314 [Google Scholar]
- 29. Forshed J., Johansson H. J., Pernemalm M., Branca R. M., Sandberg A., Lehtiö J. (2011) Enhanced Information Output From Shotgun Proteomics Data by Protein Quantification and Peptide Quality Control (PQPQ). Mol. Cell. Proteomics 10, M111 010264 [DOI] [PMC free article] [PubMed] [Google Scholar]
- 30. Chambers J. M., Hastie T. J., eds. (1992) Statistical Models in S, Wadsworth & Brooks/Cole, Pacific Grove, California [Google Scholar]
Associated Data
This section collects any data citations, data availability statements, or supplementary materials included in this article.


